
Most Requested Symbols

The breadth of increased equity participation to the upside over the past week has not been limited to domestic equity markets, as we have seen international equities move back into the top half of the DALI rankings.
Today's featured stock is Bloomin' Brands (BLMN)
DDOG, PSX, IRDM, TMUS, ANET, LDOS, TGTX, DGII, & NTLA.
Call: Abbott Laboratories (ABT); Put: Activision Blizzard (ATVI); Covered Write: Synchrony Financial (SYF).
SAVE THE DATE! Thursday, December 10 - NDW Virtual Symposium - 12 pm - 4 pm ET - Details coming soon!
We are excited to announce phase three of the Nasdaq Dorsey Wright Model Builder with the launch of Matrix and FSM-based Relative Strength (RS) Testing Service. As part of this launch, we are granting you free access to the Service for the remainder of 2020. The tool is designed to help you more easily design, test, implement, and monitor custom models powered by the Nasdaq Dorsey Wright FSM methodology, and we believe it is our most powerful tool yet. Through the end of December, be sure to join us each Thursday at 1 pm EST for a custom modeler demo presented by the analyst team.
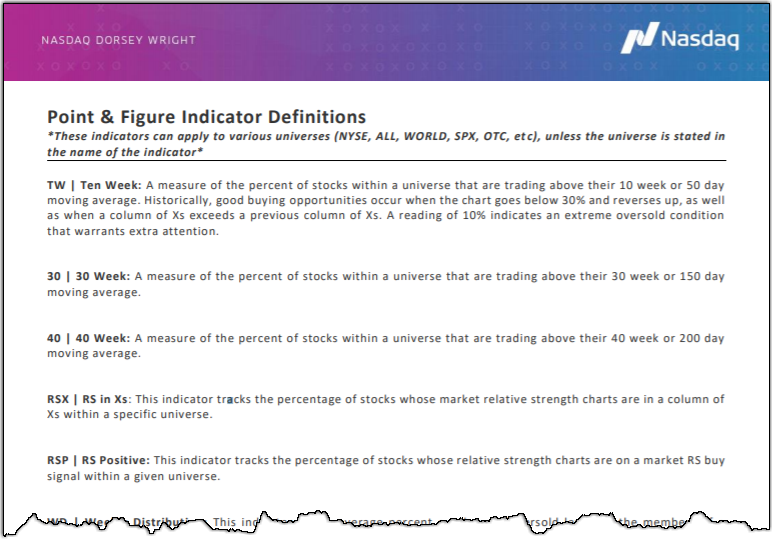
We're excited to announce our new Point & Figure Technical Indicator Guide, which provides definitions for the various short and long-term indicators we use to evaluate the strength and participation of the overall market. These Point & Figure technical indicators span indexes, sectors, styles, and economic groups and sub-groups and can be viewed in our Technical Indicator Report. To access the Technical Indicator Report, simply click on the Asset Allocation menu and select “Technical Indicator Report”. Click here to download a copy of this guide.

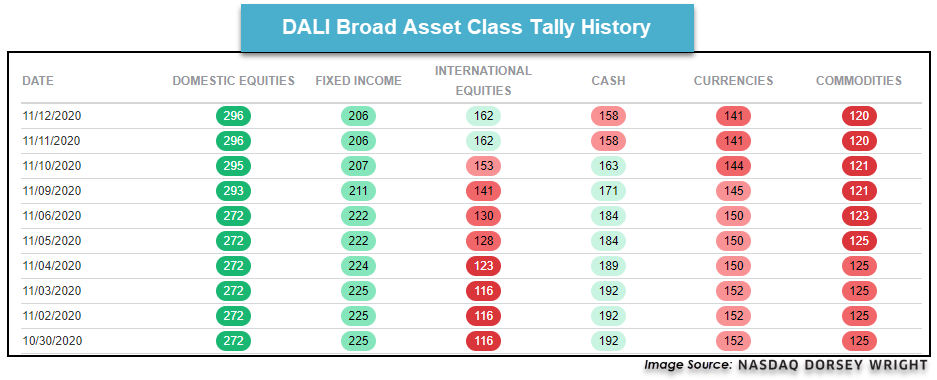
The breadth of increased equity participation to the upside over the past week has not been limited to domestic equity markets, as we have seen international equities demonstrate substantial improvements from a relative strength perspective. This is perhaps most noticeable in our Dynamic Asset Level Investing (DALI) tool, as international equities now sits in the top half of the asset class rankings at third out of the six broad areas examined. Prior to the COVID-induced global equity decline in the first quarter of this year, international equities had remained second in the DALI rankings since January 2017. The volatility that ensued in March of this year led the asset class to a tally count low of only 65 signals by the end of that month. During that decline, we saw international equities lose 127 buy signals in the five-day span ended on March 12, the most significant five-day signal decline for the asset class throughout the entire DALI history dating back to late-2005.
While there have certainly been pockets of strength within international equities over the past few months, the asset class began the month of November in the last position in DALI and remained at that spot through November 4 with a tally count of 123 buy signals. However, the last few days led international equities to gain 39 buy signals to arrive at a tally count of 162 on November 11, where the asset class remains through trading Thursday. This 39 signal increase is the largest five-day signal gain for international equities since the 2008-2009 market environment, which saw extreme signal movement due to the broader market volatility. Since that time, there have only been two other periods that saw international equities gain 30 or more buy signals in a five-day span, occurring in February 2012 and August 2016. It is important to keep in mind that an asset class ranking change is not technically cemented until we see a five signal dispersion between the areas in question, and cash still sits just 4 signals behind international equities. However, the current ranking of third for international equities does not have any allocation ramifications from a DALI Tactical Tilt strategy standpoint, which is the main place we see the five signal dispersion rule implemented. Keep this signal dispersion rule in mind if we continue to see international equities move higher in the DALI rankings, which may affect the Tactical Tilt strategies.
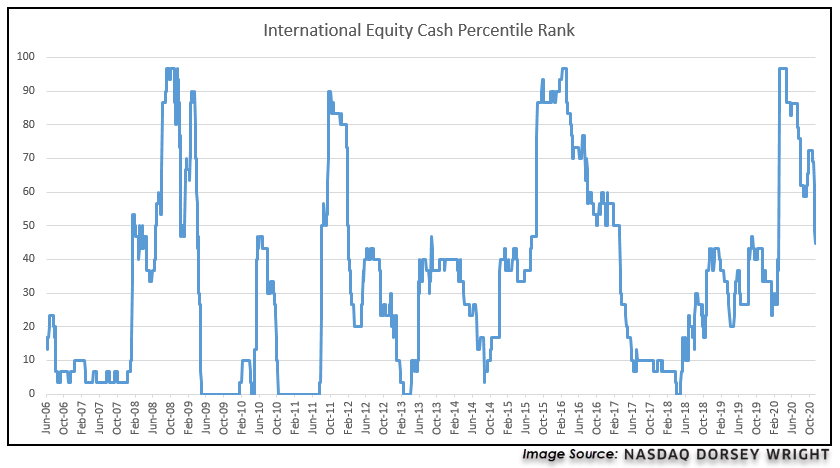
The relative strength improvement from international equities has also been demonstrated in the Cash Percentile Rank for the asset class over the past few days, as we have seen that percentile reading come down from north of 70% in late-October to a reading of 44.83% through trading Thursday. As a refresher, this reading depicts the percentage of names cash is ranked above in a broad international equities matrix, with lower readings indicating strength from the asset class against cash. This move transitions international equities from a weak, “red light” indication to an average “yellow light” indication as the percentile rank fell into the middle third. This swiftness with which we have seen this percentile rank decline is also notable, as the indicator has fallen by 24.14% over the past 10 trading days. There has not been this sharp of a decline in the cash percentile rank for international equities since February 2012, similar to the uptick in buy signals for the asset class in the DALI rankings. Additionally, a historical view of this percentile rank reveals that the 50% level has been a line of demarcation for this reading, as each of the three moves beneath this threshold since the beginning of 2009 has ultimately led to a reading of 20% or below within a few months.
In order to discern which areas within the improving international equities asset class are strongest, we can look toward the NDW country index matrix rankings that we introduced earlier this year. These rankings utilize the 43 individual NDW country indexes in a relative strength matrix ranking to establish buy, hold and sell designations for each country. Those representatives that are found in the top quartile, or eleven names, are areas that would be most favorable for new allocations according to relative strength. The countries in the second quartile are still suitable for investment but have not shown as much consistent strength, leading them to a “hold” classification. Countries found in the bottom half would not be ideal from a relative strength perspective and would receive the “sell” classification.
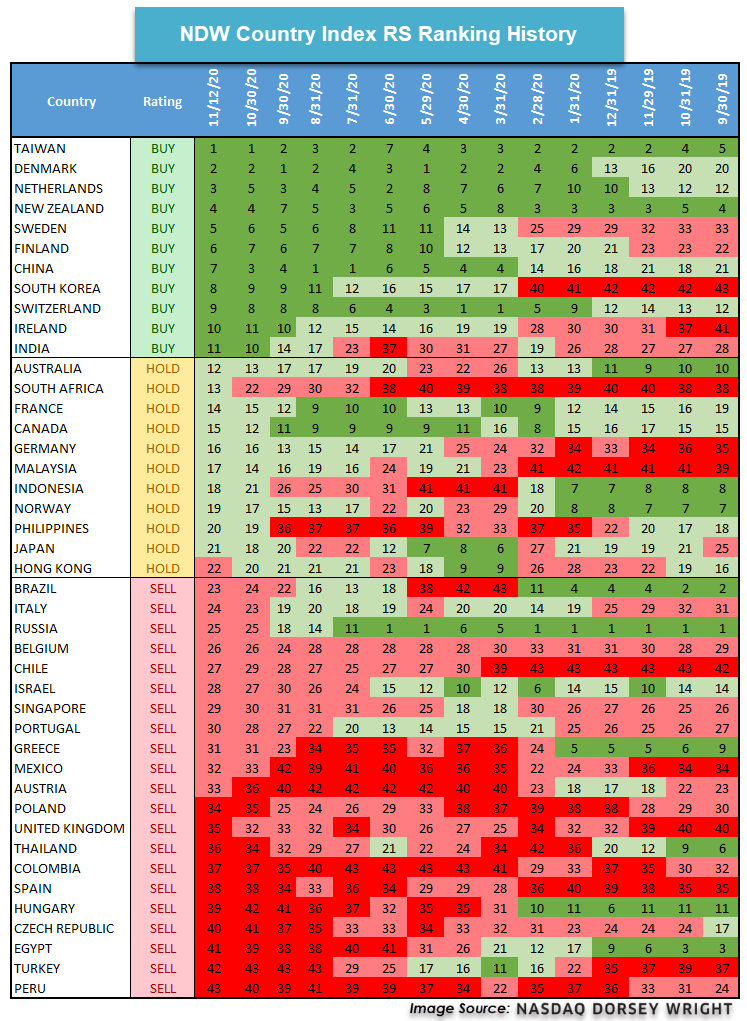
The top end of these rankings has shown little change over the past few months, with India being the only new addition in the fourth quarter. Europe has substantial representation at the top of the rankings, including Denmark, the Netherlands, Sweden, Finland, and Switzerland. These areas have maintained a “buy” designation since May of this year, however, we continue to see underweight positions in these countries throughout most broad developed market funds. As an example, we see that Switzerland, the Netherlands, Sweden, and Denmark combine for an allocation of just under 20% within the iShares MSCI EAFE ETF EFA, and Finland does not even receive enough allocation to be included as an individual representative. This highlights how using relative strength analysis to gain more focused exposure toward areas of strength in developed markets can allow for further separation from the bulk of international equity investors.
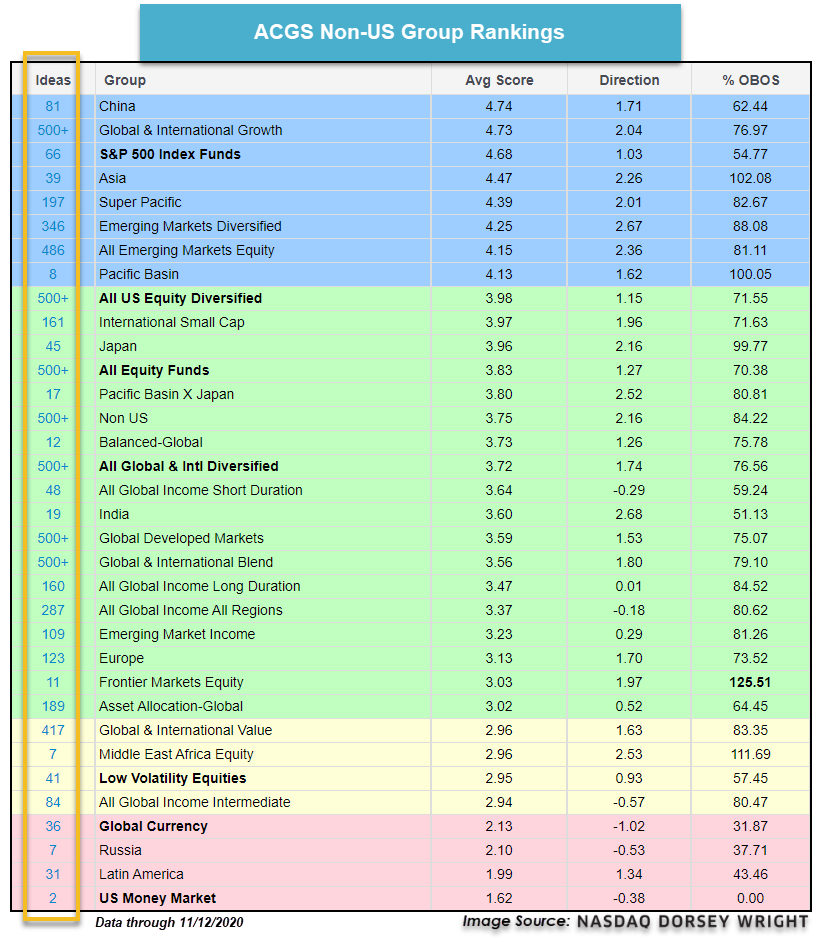
Interestingly enough, there are only three emerging market representatives found in the top quartile of names, specifically looking at Taiwan, China, and India. However, Taiwan and China have been among the most consistently strong countries since February of this year, and also show continued strength in other relative comparisons across the NDW system, such as the Asset Class Group Scores (ACGS) page, which incorporates both absolute and relative strength characteristics into the score rankings. China has been the highest-ranked international group in these rankings for most of the past several months, and still ranks ahead of the core domestic equity representative, the S&P 500 Index funds group, in average group score (as discussed in last Thursday’s Fund Score Overview). The strength of both China and Taiwan have led the iShares MSCI Emerging Markets ETF EEM to a year-to-date return of 6.22%, as those two countries alone combine for over 53% of the fund’s allocation. Comparatively, the underperformance of EFA on a year-to-date basis with a return of -1.61% can be at least partially explained by the underweighting of high relative strength countries within the broad-developed representative.
Those looking to capitalize on the recent improvement in international equities have a variety of idea generation options available on the NDW system. One, in particular, can be found on the ACGS page, which can be filtered through the non-US view selection. As previously mentioned, China and other Asian groups continue to maintain high positions in these rankings through their elevated scores. Europe as a whole is not scoring quite as high, but it is important to note that this Europe group includes favorable names as well as not so favorable areas, such as the United Kingdom. The “Ideas” link to the left of each group name can be used to dive deeper into each region, as the fund representatives will then be sorted by their fund scores to further differentiate between areas of strength and weakness.
Over the last few weeks, we’ve seen value and small caps finally beginning to show some signs of life with Small Cap Blend and Small Cap Value having the highest score directions when looking at the US Styles view on the Asset Class Group Scores page. While it’s too early to tell if there will be a rotation from growth into value, the broadening out of the market is a healthy sign. On the other hand, we have seen the US Fixed Income Long Duration group drop below the 3.00 threshold as we’ve seen interest rates trending upwards. Since Small Cap Value has a large amount of exposure to financials, it will be important to monitor groups that are sensitive to moves in interest rates like US Fixed Income Long Duration to get more confirmation of strength. When we look at the average group scores for Small Cap Value and US Fixed Income Long Duration, we can see they are fairly inversely correlated.
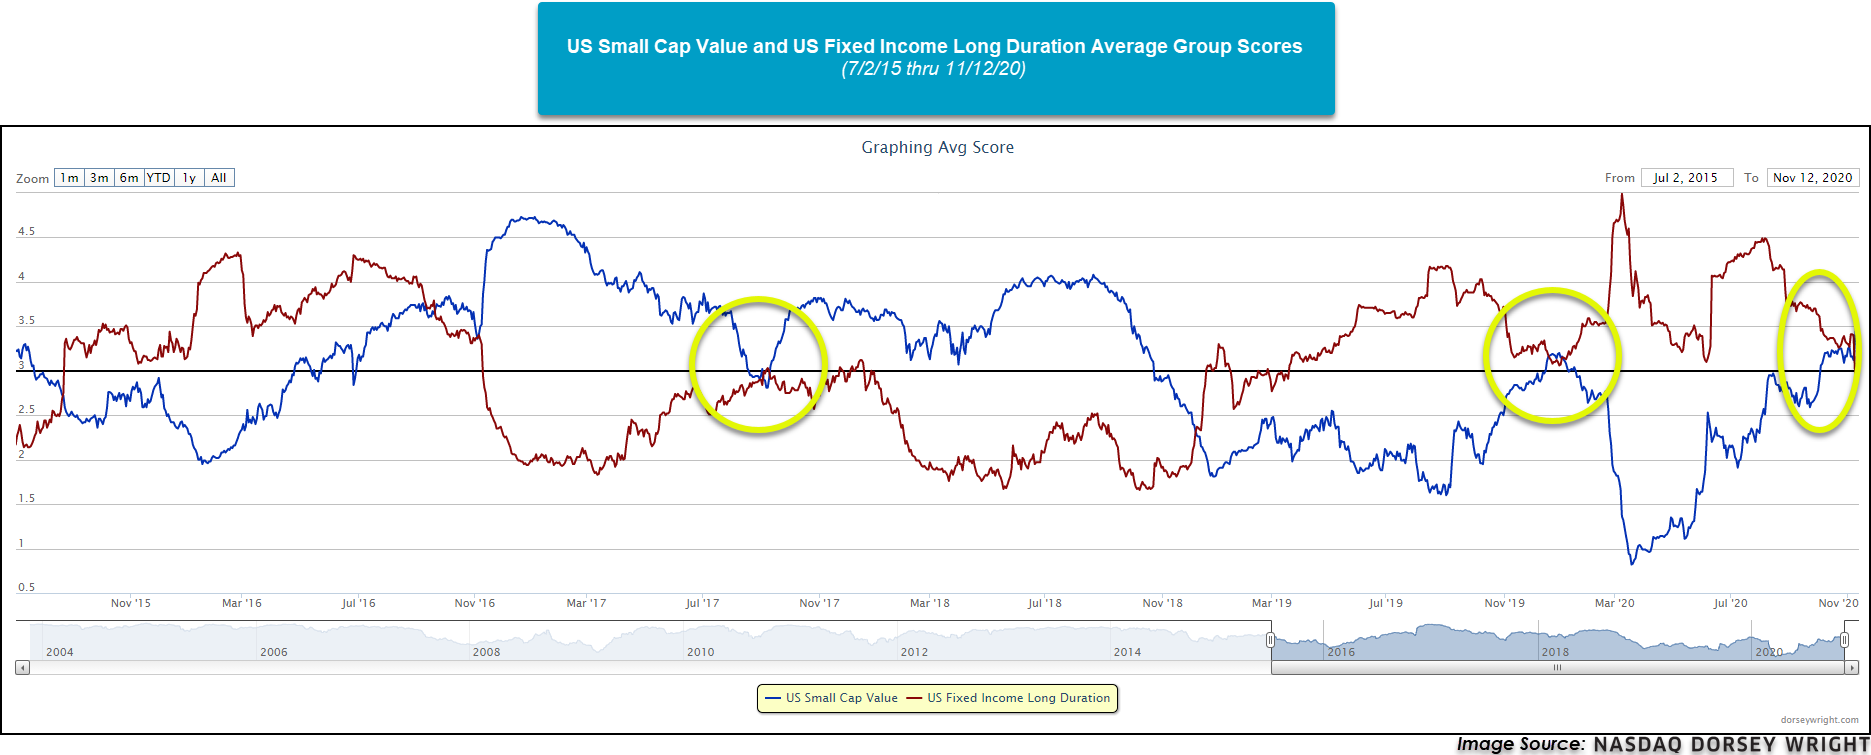
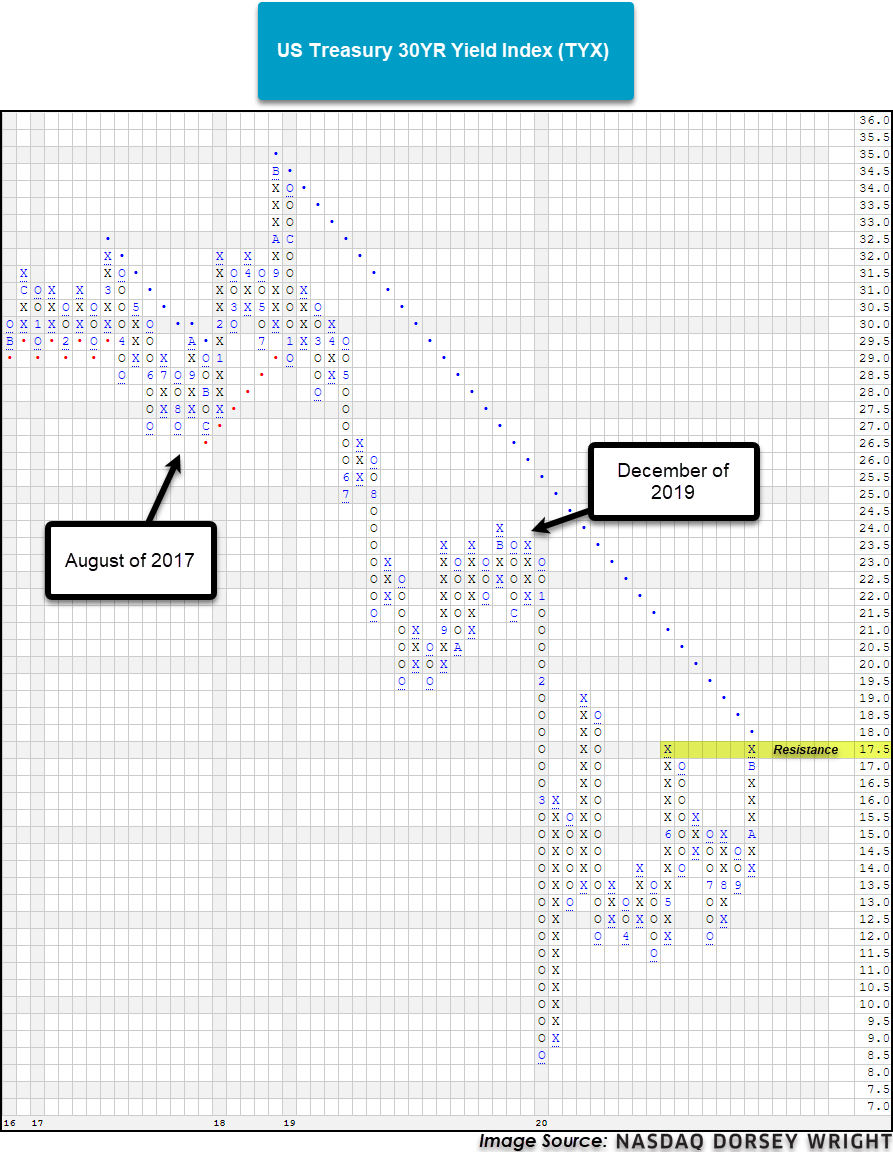
Looking at the last few years, the two groups have met around the 3.00 mark a few times, each occurring when the US Treasury 30YR Yield Index TYX was at some point of resistance or support. In August of 2017, rates were able to hold support and the US Fixed Income Long Duration group was unable to break above the 3.00 mark while the US Small Cap Value group was able to hold above. The next meeting around the 3.00 threshold was in December of 2019 and the 30YR Yield Index failed to break above 23.50 and the US Fixed Income Long Duration group was able to hold above the 3.00 mark while the US Small Cap Value group was unable to move above the threshold. Lastly, the most recent battle of the 3.00 mark between the two groups is happening right now and the 30YR Yield Index is at a point of resistance yet again at 17.50. If rates were able to break above this point, it would be reasonable to expect that US Small Cap Value would see a continuation to the upside as Financials, another group that has shown strong improvement over the last month, benefits from higher interest rates.
As we are heading towards the end of 2020, it will be important to monitor for any signs of rotation between asset classes. After a long period of leadership for Large Cap Growth, it’s too early to tell if we are in fact seeing a rotation into value. Moving forward, be sure to visit the Asset Class Group Scores Page so if/when we do see any leadership changes you can shift your allocations accordingly.
A message from Steve Raymond:
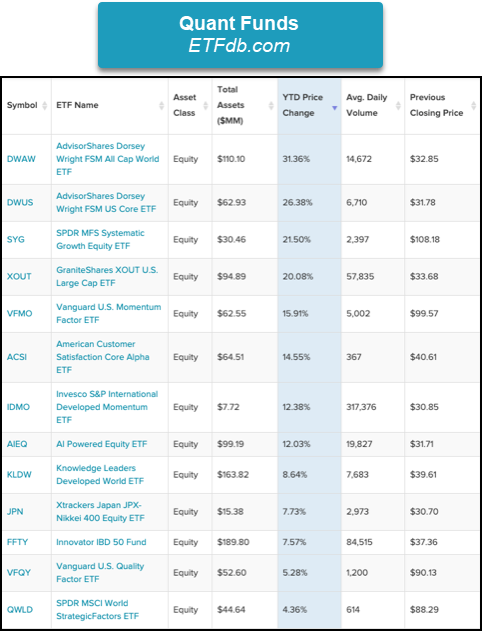
If you weren't already aware, keep in mind that FSM is available in ETF format and is climbing the various lists of attention. Like below for example, from the folks at ETFdb.com where we can see that both the FSM US Core (DWUS) as well as the FSM All Cap World (DWAW) continue to lead their Quant-based ETF List. This ETFdb.com list is populated with their Quant categorized funds that rely on algorithmic or systematically programmed investment strategies. With word of mouth spreading the FSM news, the net assets between these two funds is rapidly moving up towards 200 million. I appreciate this and more importantly, I appreciate your grassroots support for the FSM endeavor over the years. More good stuff is on the way, but don’t forget “these two” opportunities, as they are designed to be “used together” and represent a very important set of plugin solutions within the FSM ecosystem.
Best,
Steve

Average Level
21.53
| AGG | iShares US Core Bond ETF |
| USO | United States Oil Fund |
| DIA | SPDR Dow Jones Industrial Average ETF |
| DVY | iShares Dow Jones Select Dividend Index ETF |
| DX/Y | NYCE U.S.Dollar Index Spot |
| EFA | iShares MSCI EAFE ETF |
| FXE | Invesco CurrencyShares Euro Trust |
| GLD | SPDR Gold Trust |
| GSG | iShares S&P GSCI Commodity-Indexed Trust |
| HYG | iShares iBoxx $ High Yield Corporate Bond ETF |
| ICF | iShares Cohen & Steers Realty ETF |
| IEF | iShares Barclays 7-10 Yr. Tres. Bond ETF |
| LQD | iShares iBoxx $ Investment Grade Corp. Bond ETF |
| IJH | iShares S&P 400 MidCap Index Fund |
| ONEQ | Fidelity Nasdaq Composite Index Track |
| QQQ | Invesco QQQ Trust |
| RSP | Invesco S&P 500 Equal Weight ETF |
| IWM | iShares Russell 2000 Index ETF |
| SHY | iShares Barclays 1-3 Year Tres. Bond ETF |
| IJR | iShares S&P 600 SmallCap Index Fund |
| SPY | SPDR S&P 500 Index ETF Trust |
| TLT | iShares Barclays 20+ Year Treasury Bond ETF |
| GCC | WisdomTree Continuous Commodity Index Fund |
| VOOG | Vanguard S&P 500 Growth ETF |
| VOOV | Vanguard S&P 500 Value ETF |
| EEM | iShares MSCI Emerging Markets ETF |
| XLG | Invesco S&P 500 Top 50 ETF |
| Symbol | Company | Sector | Current Price | Action Price | Target | Stop | Notes |
|---|---|---|---|---|---|---|---|
| AN | Autonation Inc. | Autos and Parts | $59.65 | hi 50s - low 60s | 100 | 50 | 5 for 5'er, top 10% of favored AUTO sector matrix, pullback from ATH, pot cov. write R-R>3.0 |
| SCHN | Schnitzer Steel Industries | Steel/Iron | $22.54 | 19 - 21 | 32.50 | 16.50 | 3 for 5'er, top half of favored STEE sector matrix, bullish catapult, 3.7% yield, R-R>3.0 |
| RCII | Rent-A-Center, Inc. | Retailing | $32.10 | low to mid 30s | 65 | 24 | 4 for 5'er, 5 consec buy signals, LT peer RS buy, pos weekly & mon momentum, 3.59% yield |
| TTC | The Toro Company | Machinery and Tools | $85.91 | low to high 80s | 126 | 70 | 4 for 5'er, consec buy signals, LT market and peer RS buy signal, 1.22% yield |
| FIVE | Five Below Inc | Household Goods | $142.83 | hi 130s - hi 140s | 149 | 120 | 5 for 5'er, top 25% of favored HOUS sector matrix, triple top breakout, potential covered write, Earn. 12/2 |
| BMCH | BMC Stock Holdings Inc. | Building | $44.07 | mid to upper 40s | 61 | 37 | 5 for 5'er, pos trend, pos mon mom, LT market RS buy, 7 consec buy signals, ATH, top of fav DWABUIL matrix |
| CMI | Cummins Inc. | Machinery and Tools | $233.14 | 216 - 236 | 304 | 188 | 5 for 5'er, pullback from ATH, consec buy signals, pos trend, top 1/3 of favored machinery & tools sector matrix. 2.36% yield |
| SGMS | Scientific Games Corporation | Gaming | $33.32 | low-to-mid 30s | 62 | 29 | 5 for 5'er, top third of GAME sector matrix, spread triple top, pullback from multi-year high, R-R>4.0 |
| LL | Lumber Liquidators Holdings Inc | Building | $25.84 | mid to upper 20s | 47 | 21 | 4 for 5'er, pos trend, 7 consec buy signals, pullback from multi-year high |
| BLMN | Bloomin' Brands Inc | Restaurants | $15.61 | 15 - 17 | 21 | 13.50 | 4 for 5'er, favored REST sector, triple top breakout, pullback to middle of trading band, pot. cov. write |
| Symbol | Company | Sector | Current Price | Action Price | Target | Stop | Notes |
|---|
| Symbol | Company | Sector | Current Price | Action Price | Target | Stop | Notes |
|---|---|---|---|---|---|---|---|
| AVGO | Broadcom Ltd | Semiconductors | $370.20 | 360s - 380s | 468 | 300 | OK to add exposure or hold here. Maintain $300 stop. Earnings 12/10 |
| Comment |
|---|
| AMP Ameriprise Financial R ($183.69) - Finance - We will now raise our stop to $154, the second potential sell signal on AMP's default chart. |
| AMAT Applied Materials, Inc. R ($71.85) - Semiconductors - We will now raise our stop to $59, the potential trend line violation on AMAT's default chart. |
BLMN Bloomin' Brands Inc R ($15.86) - Restaurants - BLMN is a 4 for 5'er and belongs to the favored restaurant sector. In trading earlier this week, BLMN completed a third consecutive buy signal when it broke a triple top at $18, taking out resistance dating back to September. The stock subsequently pulled back to the middle of its trading band, offering an entry point for new long exposure. BLMN also offers a potential covered write opportunity on the April '21 call options. Long exposure may be added in the $15 - $17 range and we will set our initial stop at $13.50, a potential triple bottom break on BLMN's default chart. We will use the top of the trading band, $21, as our target price.
| 17 | 18 | 19 | 20 | ||||||||||||||||||||||||||||||||||||||||||||||||||
| 25.00 | 4 | • | • | • | 25.00 | ||||||||||||||||||||||||||||||||||||||||||||||||
| 24.00 | X | O | X | • | X | • | 24.00 | ||||||||||||||||||||||||||||||||||||||||||||||
| 23.00 | • | 2 | O | X | O | • | • | • | X | O | • | 23.00 | |||||||||||||||||||||||||||||||||||||||||
| 22.00 | 5 | • | C | 5 | X | O | • | X | • | X | • | • | X | O | • | 22.00 | |||||||||||||||||||||||||||||||||||||
| 21.00 | X | O | • | X | O | 6 | X | B | O | • | X | O | X | • | • | X | B | 1 | • | Top | 21.00 | ||||||||||||||||||||||||||||||||
| 20.00 | 4 | O | • | X | O | X | O | 9 | O | X | • | 2 | O | X | O | X | • | X | O | X | 2 | • | 20.00 | ||||||||||||||||||||||||||||||
| 19.50 | • | X | 7 | X | 7 | X | O | X | O | X | O | X | 3 | X | O | X | O | X | O | X | O | • | 19.50 | ||||||||||||||||||||||||||||||
| 19.00 | O | • | X | O | X | O | O | X | C | 1 | O | X | 4 | • | 5 | X | O | X | O | X | O | • | 19.00 | ||||||||||||||||||||||||||||||
| 18.50 | O | 2 | • | 3 | O | X | • | 8 | X | O | X | O | • | • | O | 6 | 9 | A | X | O | • | 18.50 | |||||||||||||||||||||||||||||||
| 18.00 | C | X | O | X | O | X | X | • | O | • | O | X | • | 7 | X | O | X | O | • | X | 18.00 | ||||||||||||||||||||||||||||||||
| 17.50 | 1 | X | O | X | O | X | O | X | • | • | O | • | O | X | O | X | O | • | X | X | X | O | 17.50 | ||||||||||||||||||||||||||||||
| 17.00 | O | • | O | • | 8 | X | O | X | • | • | O | X | O | 3 | • | X | O | X | O | X | O | 17.00 | |||||||||||||||||||||||||||||||
| 16.50 | • | • | 9 | B | • | 8 | X | • | O | • | X | O | X | O | X | O | 16.50 | ||||||||||||||||||||||||||||||||||||
| 16.00 | • | O | X | • | O | • | X | O | A | O | X | O | Mid | 16.00 | |||||||||||||||||||||||||||||||||||||||
| 15.50 | O | • | O | • | X | O | X | O | B | O | 15.50 | ||||||||||||||||||||||||||||||||||||||||||
| 15.00 | • | O | X | • | X | O | X | O | X | 15.00 | |||||||||||||||||||||||||||||||||||||||||||
| 14.50 | O | X | O | • | 9 | O | X | O | X | 14.50 | |||||||||||||||||||||||||||||||||||||||||||
| 14.00 | O | X | O | • | X | O | O | 14.00 | |||||||||||||||||||||||||||||||||||||||||||||
| 13.50 | O | X | X | O | • | X | 13.50 | ||||||||||||||||||||||||||||||||||||||||||||||
| 13.00 | O | X | O | X | O | X | • | X | • | 13.00 | |||||||||||||||||||||||||||||||||||||||||||
| 12.50 | O | X | O | 6 | O | X | O | X | • | 12.50 | |||||||||||||||||||||||||||||||||||||||||||
| 12.00 | O | X | 5 | X | O | X | O | X | X | • | 12.00 | ||||||||||||||||||||||||||||||||||||||||||
| 11.50 | O | X | O | X | X | O | X | O | X | O | X | • | 11.50 | ||||||||||||||||||||||||||||||||||||||||
| 11.00 | O | X | O | X | O | X | O | O | 7 | X | O | X | • | Bot | 11.00 | ||||||||||||||||||||||||||||||||||||||
| 10.50 | O | X | O | X | O | X | O | X | O | X | 8 | • | 10.50 | ||||||||||||||||||||||||||||||||||||||||
| 10.00 | O | X | O | X | O | X | O | X | O | X | • | 10.00 | |||||||||||||||||||||||||||||||||||||||||
| 9.50 | O | X | O | O | X | O | O | • | 9.50 | ||||||||||||||||||||||||||||||||||||||||||||
| 9.00 | O | X | X | O | X | • | 9.00 | ||||||||||||||||||||||||||||||||||||||||||||||
| 8.50 | O | X | O | X | X | O | 8.50 | ||||||||||||||||||||||||||||||||||||||||||||||
| 8.00 | O | X | O | X | O | X | 8.00 | ||||||||||||||||||||||||||||||||||||||||||||||
| 7.50 | O | X | O | X | O | X | 7.50 | ||||||||||||||||||||||||||||||||||||||||||||||
| 7.00 | O | X | O | X | O | 7.00 | |||||||||||||||||||||||||||||||||||||||||||||||
| 6.50 | O | X | X | O | X | 6.50 | |||||||||||||||||||||||||||||||||||||||||||||||
| 6.00 | O | X | O | X | 4 | X | 6.00 | ||||||||||||||||||||||||||||||||||||||||||||||
| 5.50 | O | X | O | X | O | 5.50 | |||||||||||||||||||||||||||||||||||||||||||||||
| 5.00 | O | X | O | X | 5.00 | ||||||||||||||||||||||||||||||||||||||||||||||||
| 4.75 | O | O | 4.75 | ||||||||||||||||||||||||||||||||||||||||||||||||||
| 17 | 18 | 19 | 20 |

| ANET Arista Networks Inc ($273.80) - Internet - ANET moved higher Friday to break a double top at $272, marking a new 52-week high. This 3 for 5'er moved to a positive trend last week and sits in the top third of the internet sector RS matrix. The technical picture continues to strengthen, however, those looking to add exposure may wish to wait for a pullback or normalization of the trading band as the stock is now in heavily overbought territory. Initial support can be found at $256. |
| DDOG Datadog Inc Class A ($86.17) - Software - DDOG bounced back from its earnings decline on Wednesday, but reversed back down today. The mean reversion bounce might be over here, and if you are still long DDOG we would advise moving on to a stronger name. |
| DGII Digi International Inc ($16.70) - Software - DGII rose Friday to break a double top at $18 before moving to $18.50 intraday, matching its all-time high last reached in December 2019. This 5 for 5'er moved to a positive trend in August and ranks in the top quintile of the software sector RS matrix. The weight of the evidence is positive here, however, DGII is now in overbought territory so those looking to add exposure would be best served to wait for a pullback or normalization of the trading band. Initial support can be found at $14.50. |
| IRDM Iridium Communications, Inc. ($31.22) - Telephone - IRDM broke a triple top at $31, marking the third consecutive buy signal on the chart. This stock is a solid 4 for 5’er within the telephone sector that has maintained a long-term market RS buy signal since December 2016. From here, support sits at $26, the bullish support line. |
| LDOS Leidos Holdings Inc. ($98.51) - Computers - LDOS reversed up into a column of Xs Friday and broke a double top at $98, marking its third consecutive buy signal. This 3 for 5'er moved to a positive trend last week and has been on an RS buy signal against the market since early-2016. Weekly momentum also just flipped positive, suggesting the potential for further upside from here. Exposure may be considered at current levels, with initial support offered at $94. Further support can be found at $90. |
| NTLA Intellia Therapeutics Inc. ($33.25) - Drugs - Intellia shares moved higher today to break a double top at $32 to mark its fourth consecutive buy signal. This 5 for 5'er has been in a positive trend since April and went on an RS buy signal versus the market this month. Intellia currently holds the top spot in its stock sector group matrix. Recent price action has put NTLA into heavily overbought territory, so those wishing to initiate a long position may be best served to wait for a pullback or price normalization. From here, support can be found at $28. |
| PSX Phillips 66 ($59.25) - Oil - PSX continued to rally on Friday as it printed four Xs on its default chart and gave a second consecutive buy signal when it broke a double top at $59. Despite the recent positive action, the technical picture for PSX remains negative as it is a 1 for 5'er trading in a negative trend. From here PSX faces overhead resistance at $61. Potential short sellers should note that PSX carries a 6.1% yield. |
| TGTX TG Therapeutics, Inc. ($29.46) - Biomedics/Genetics - TGTX shares moved higher today to complete a bullish triangle at $30 to mark its third consecutive buy signal. This 5 for 5'er has been in a positive trend since May and on an RS buy signal versus the market since December of 2019. TGTX is actionable at current levels with a weekly overbought/oversold reading of 3%. From here, support can be found at $26. |
| TMUS T-Mobile US Inc. ($128.22) - Telephone - TMUS, a perfect 5 for 5'er, broke a double top at $128 and is now trading at new all-time highs. Today’s break marks the seventh consecutive buy signal on the chart, confirming that demand is in control. From here, support sits at $120. |
| Name | Option Symbol | Action | Stop Loss |
|---|---|---|---|
| Abbott Laboratories - $112.58 | O: 21C110.00D19 | Buy the March 110.00 calls at 8.35 | 102.00 |
| Name | Option | Action |
|---|---|---|
| Freeport-McMoRan Inc. ( FCX) | Jan. 16.00 Calls | Raise the option stop loss to 2.45 (CP: 4.45) |
| T-Mobile US Inc. ( TMUS) | Jan. 115.00 Calls | Raise the option stop loss to 12.75 (CP: 14.75) |
| Name | Option Symbol | Action | Stop Loss |
|---|---|---|---|
| Activision Blizzard, Inc. - $77.55 | O: 21O80.00D19 | Buy the March 80.00 puts at 7.70 | 84.00 |
| Name | Option | Action |
|---|---|---|
|
|
||
| Name | Option Sym. | Call to Sell | Call Price | Investment for 500 Shares | Annual Called Rtn. | Annual Static Rtn. | Downside Protection |
|---|---|---|---|---|---|---|---|
| Synchrony Financial $29.11 | O: 21C31.00D19 | Mar. 31.00 | 2.50 | $13,922.60 | 29.70% | 22.63% | 7.24% |
| Name | Action |
|---|---|
| The Chemours Company (CC) - 21.68 | Sell the January 23.00 Calls. |
| L Brands Inc. (LB) - 33.06 | Sell the January 35.00 Calls. |
| The Gap, Inc. (GPS) - 21.73 | Sell the January 23.00 Calls. |
| Bank of America (BAC) - 26.69 | Sell the February 28.00 Calls. |
| Viacom CBS Inc. (VIAC) - 29.25 | Sell the March 31.00 Calls. |
| Name | Covered Write |
|---|---|
|
|
|
Daily Equity & Market Analysis
Loading, Please Wait...
