Extreme low levels for the Money Market Percentile Rank (MMPR) can be good for equity markets.
The steady improvement across many risk-on groups on the Asset Class Group Scores (ACGS) page has led to a further dampening of the US Money Market group. This caused the Money Market Percentile Rank (MMPR) to drop below 2% for the first time since 2016 at a current posting of 1.41%. This reading has only dropped below 2% a handful of times since the origin of the indicator, dating back to September 2005. In order to examine these market environments closer, we took each date when the MMPR fell below 2% and filtered for only those dates where the MMPR had not been below 2% over the previous two months. This leaves us with four instances prior to Monday of this week. We then took the forward total return of the S&P 500 Index TR.SPXX from each of those dates, looking for returns over the forward 1, 3, 6, and 12-month timeframes. It should be noted that this is a small sample size of instances to work with, and each market environment certainly had its own set of unique circumstances. What we found was that the S&P 500 demonstrated the potential for either muted returns or a slight pullback one month after extremely low MMPR levels. These returns improved substantially as the timeframe examined increased, with the exception of 2011, which saw the pullback extend to the three-month timeframe before improving. The general trend displayed by these returns seems to indicate that the lowest levels for the MMPR have tended to be immediately followed by a period of market consolidation, which ultimately led to continued growth for the major domestic equity benchmark.

It is difficult to predict from these indications alone whether the next few months will show a further pullback as we saw in 2011, or substantial improvement like we saw in 2016. However, we have already seen some consolidation in those sectors that have led the domestic equity space higher throughout the past several months. The areas of technology and consumer cyclicals are still the top-scoring sectors on the ACGS system, as well as the top two ranked sectors from a relative strength perspective in the DALI tool. These areas have seen similar score movements since early-September, as both groups have fluctuated between average scores of 4.50 and 5. They also each sit slightly south of their score highs over the past six months, leading to muted average score direction reading for both groups.
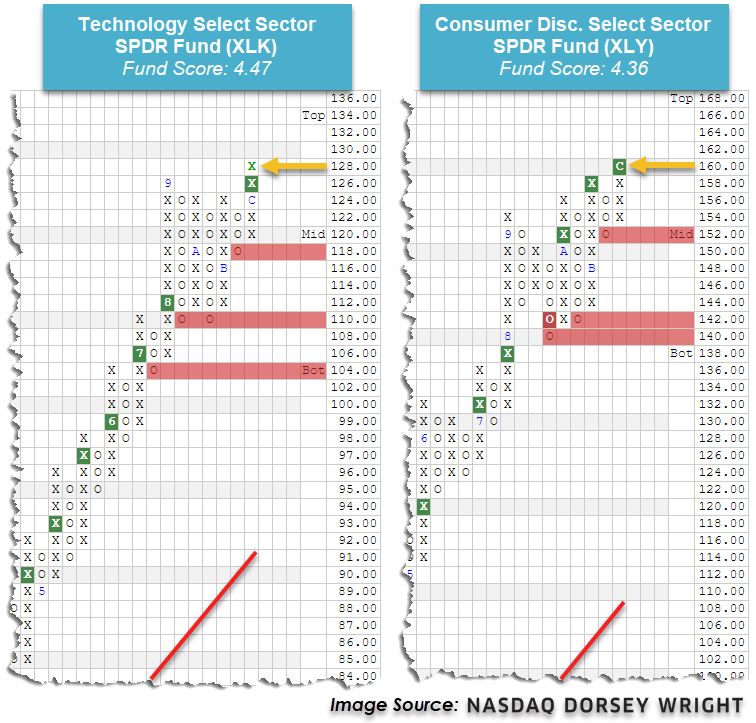
The SPDR sector representatives for technology XLK and consumer discretionary (cyclical) XLY have been indicative of this recent movement. Interestingly enough, both funds broke out to new all-time highs on their respective point & figure charts with movement Wednesday, with XLK surpassing its September high to advance to $128 and XLY advancing past its November high to $160. They each also possess a favorable fund score north of 4.00 but have negative score directions. While it is generally ideal to look for positive fund score directions, the negative score directions, in this case, do not necessarily indicate that XLK and XLY are weak. Rather, it shows that they have not continued their advances as much as other previously laggard sectors that have shown more rapid improvement over the past few weeks. The slower ascent has also led to further normalization on the trading bands of both XLK and XLY, leaving the funds actionable at current levels from a weekly overbought/oversold (OBOS) perspective.