
Most Requested Symbols

The breadth of strength among international equity markets has continued to expand over the past week, with specific emerging market economies showing the most significant improvement.
Today's featured stock is Quanta Services, Inc.(PWR).
AGCO, BLNK, CHDN, DFS, DKNG, DOMO, DRI, GKOS, IMVT, SNX & YETI.
Call: The TJX Companies (TJX), Put: JD.COM (JD), Covered Write: American International Group (AIG)
We are excited to announce phase three of the Nasdaq Dorsey Wright Model Builder with the launch of Matrix and FSM-based Relative Strength (RS) Testing Service. As part of this launch, we are granting you free access to the service for the remainder of 2020. The tool is designed to help you more easily design, test, implement, and monitor custom models powered by the Nasdaq Dorsey Wright methodology. Through the end of December, be sure to join us each Thursday at 1 pm EST for a custom modeler demo presented by the analyst team.
11/19/2020: Static Model Builder Demo Replay - Click Here
12/9/2020: Matrix Model Builder Demo Replay - Click here
11/5/2020: FSM Model Builder Demo Replay - Click here
Click here to register for future Nasdaq Dorsey Wright Model Builder Demos
On December 4th, the Percent Positive Trend for NYSE ^PTNYSE reached 70% for the first time since February of 2013 which is a span of almost 8 years! This means that 70% of the stocks within the NYSE universe are currently trading in a positive trend. The NYSE universe has much more emphasis on small and mid cap names compared to the SPX universe which is strictly large cap names. Going back to 1994, this is the tenth time the ^PTNYSE has reached such a level, not including clusters of occurrences within 30 days. The 3 month, 6 month, and 1 year returns are on average very positive for both the S&P 500 Index and the Russell 2000 Index. The average returns for each index are fairly similar over the 3 month and 6 month periods, but over the 1 year period, the S&P 500 Index outpaced the Russell 2000 Index by over 500 basis points. While broader participation is a good sign for domestic equities as a whole, it does not necessarily mean that small and mid caps will perform better than large caps, at least when only observing the ^PTNYSE.


Each week the analysts at DWA review and comment on all major asset classes in the global markets. Shown below is the summary or snapshot of the primary technical indicators we follow for multiple areas. Should there be changes mid-week we will certainly bring these to your attention via the report.
| Universe | BP Col & Level (actual) | BP Rev Level | PT Col & Level (actual) | PT Rev Level | HiLo Col & Level (actual) | HiLo Rev Level | 10 Week Col & Level (actual) | 10 Week Rev Level | 30 Week Col & Level (actual) | 30 Week Rev Level |
|---|---|---|---|---|---|---|---|---|---|---|
| ALL |
|
58% |
|
54% |
|
90% |
|
76% |
|
74% |
| NYSE |
|
68% |
|
64% |
|
92% |
|
80% |
|
80% |
| OTC |
|
56% |
|
50% |
|
90% |
|
74% |
|
70% |
| World |
|
52% |
|
50% |
|
|
|
68% |
|
66% |
Equity markets were generally flat over the course of the past week with the S&P 500 SPX down 0.21% and the S&P 500 Equal Weighted Index SPXEWI down just 0.06% (12/8 – 12/15); however, Small Caps remained a bright spot. The iShares Russell 2000 ETF IWM is up more than 25% over the past 90 days compared to a 9% gain for the S&P 500. Interestingly enough, all segments of Small Caps have seen gains in excess of 25% over the past three months including Small Growth and Small Value.
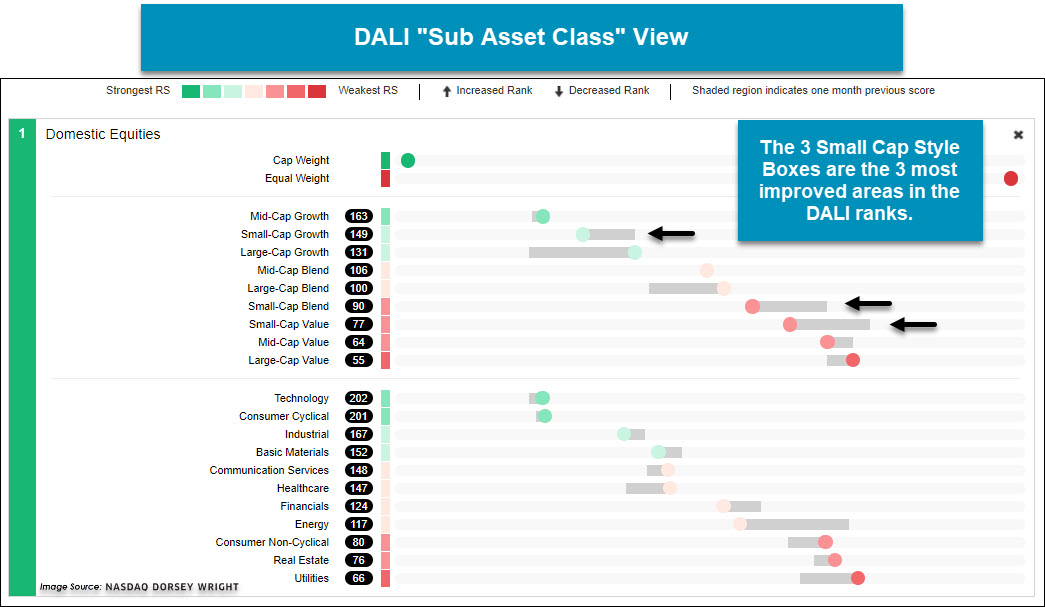
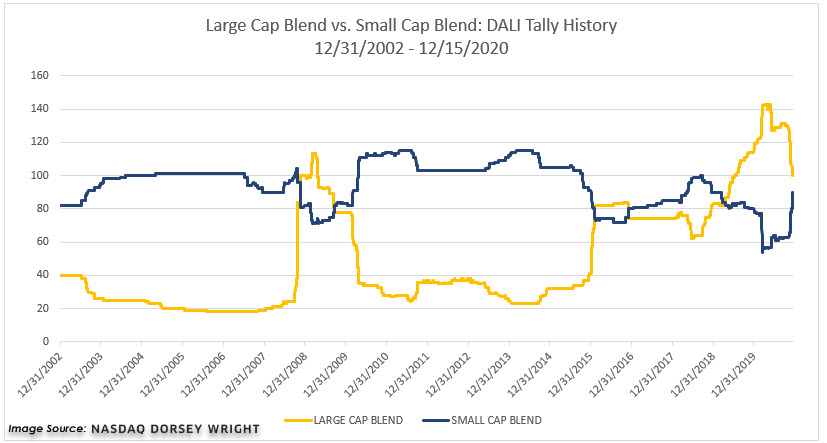
The improvement in the Small Cap space has been seen on a number of different fronts, DALI included, as the 3 Small Cap related style boxes are the 3 most improved style boxes within DALI, with Small Cap Growth continuing to be the strongest. While Small Cap Growth has been in the top three styles for much of this year, Small Blend and Value are moving up the ranks to the extent that Small Blend is close to overtaking Large Blend, which would be the first time in nearly two years Small Blend would be ahead of Large Blend. All this is to say, we are continuing to see improvement in the Small Cap space as we head into the end of 2021.

| Symbol | Name | Price | Yield | PnF Trend | RS Signal | RS Col. | Fund Score | 200 Day MA | Weekly Mom |
|---|---|---|---|---|---|---|---|---|---|
| DIA | SPDR Dow Jones Industrial Average ETF Trust | 302.62 | 2.03 | Positive | O | 3.84 | 263.65 | +6W | |
| EEM | iShares MSCI Emerging Markets ETF | 50.48 | 2.38 | Positive | Sell | O | 5.21 | 41.93 | +10W |
| EFA | iShares MSCI EAFE ETF | 72.26 | 2.31 | Positive | Sell | O | 2.97 | 61.91 | +7W |
| FM | iShares MSCI Frontier 100 ETF | 28.09 | 2.90 | Positive | Sell | O | 1.19 | 24.57 | -1W |
| IJH | iShares S&P MidCap 400 Index Fund | 227.83 | 1.48 | Positive | Buy | O | 3.53 | 181.79 | +10W |
| IJR | iShares S&P SmallCap 600 Index Fund | 91.28 | 1.40 | Positive | Buy | O | 4.23 | 69.91 | +10W |
| QQQ | Invesco QQQ Trust | 307.29 | 0.54 | Positive | Buy | X | 4.77 | 253.10 | +4W |
| RSP | Invesco S&P 500 Equal Weight ETF | 126.89 | 1.73 | Positive | Buy | X | 4.35 | 104.74 | +10W |
| SPY | SPDR S&P 500 ETF Trust | 369.59 | 1.54 | Positive | O | 4.11 | 317.50 | +7W | |
| XLG | Invesco S&P 500 Top 50 ETF | 280.81 | 1.28 | Positive | O | 4.44 | 244.36 | +4W |
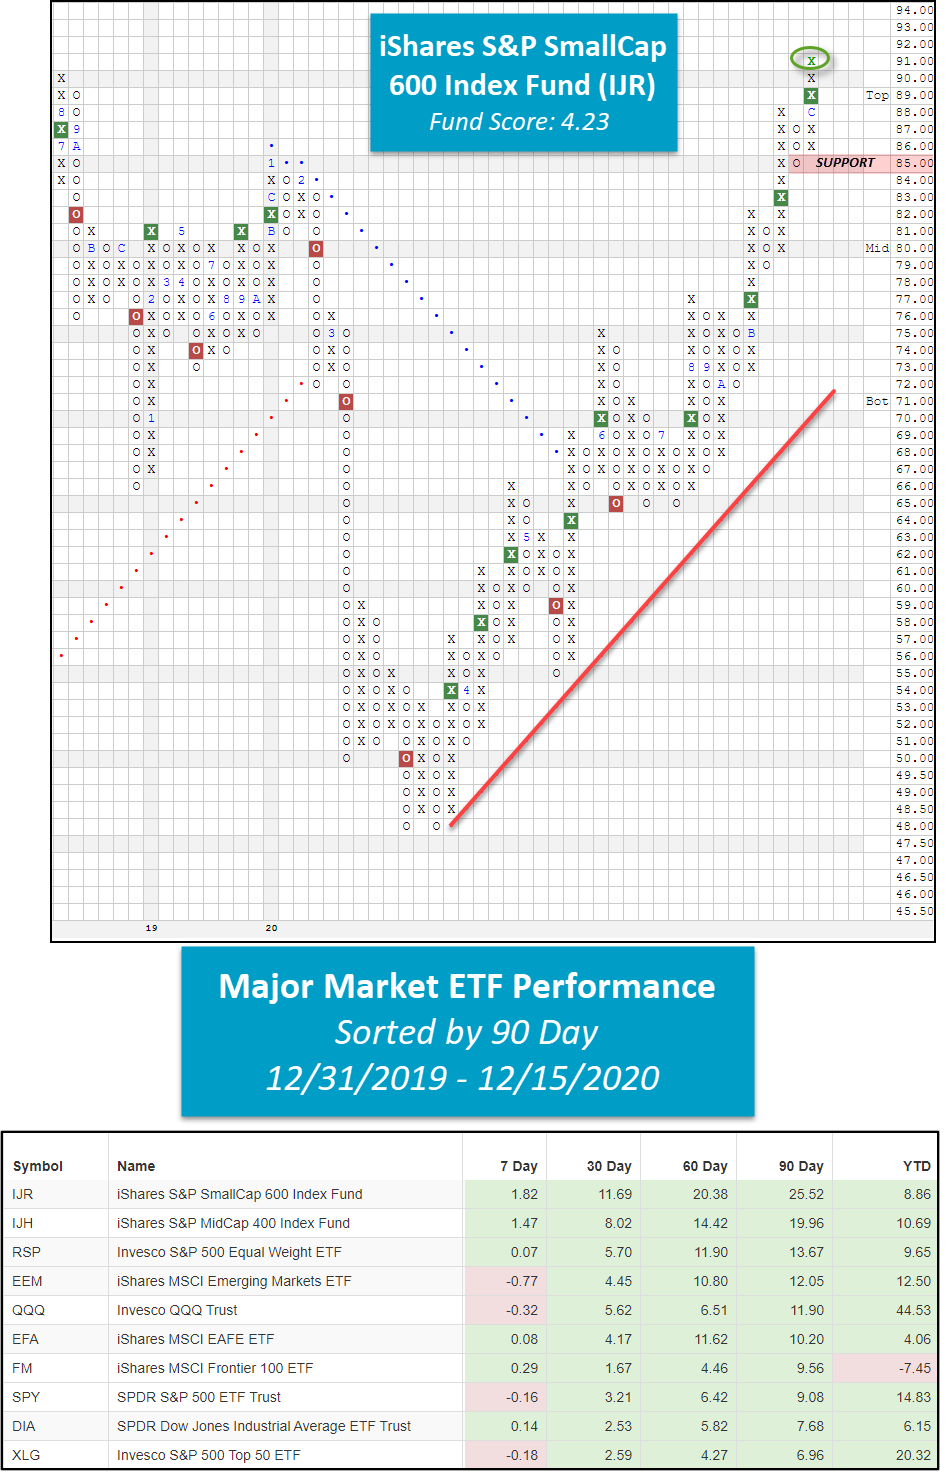
It was a mixed bag in terms of performance over the last week as six major market funds covered in this report finished the week in positive territory while the remaining four funds finished in the red. The best performing ETF for the week was once again the iShares S&P SmallCap 600 Index Fund IJR with a gain of 1.82% while the iShares MSCI Emerging Markets ETF EEM lagged with a loss of -0.77%.
Last week, we discussed the notable action on the Point & Figure chart of IJR, which had just rallied to match its all-time high from August 2018 at $90. As previously mentioned, IJR gained 0.91% over the last seven days, making it the best performing major market fund for the second week in a row. With Tuesday’s (12/15) trading session, IJR’s positive price action caused the fund to print an X at $91, officially marking a new all-time high for the small-cap proxy. Currently, IJR has a solid fund score of 4.23 coupled with a strongly positive score direction of 2.65. While IJR still lags the majority of the major market funds covered in this report on a year-to-date basis, we find that over the last 30, 60, and 90 day periods, IJR has outperformed all 10 major market funds, including the high-flying QQQ and SPY. IJR’s impressive rally has pushed the fund into heavily overbought territory, where the potential for a mean-reversion becomes higher. Currently, IJR’s overbought/oversold (OBOS%) reading is 123% overbought, the highest OBOS% level recorded since December 2016 when it read 129% overbought. From here, initial support sits at $85, with additional support offered at $79.
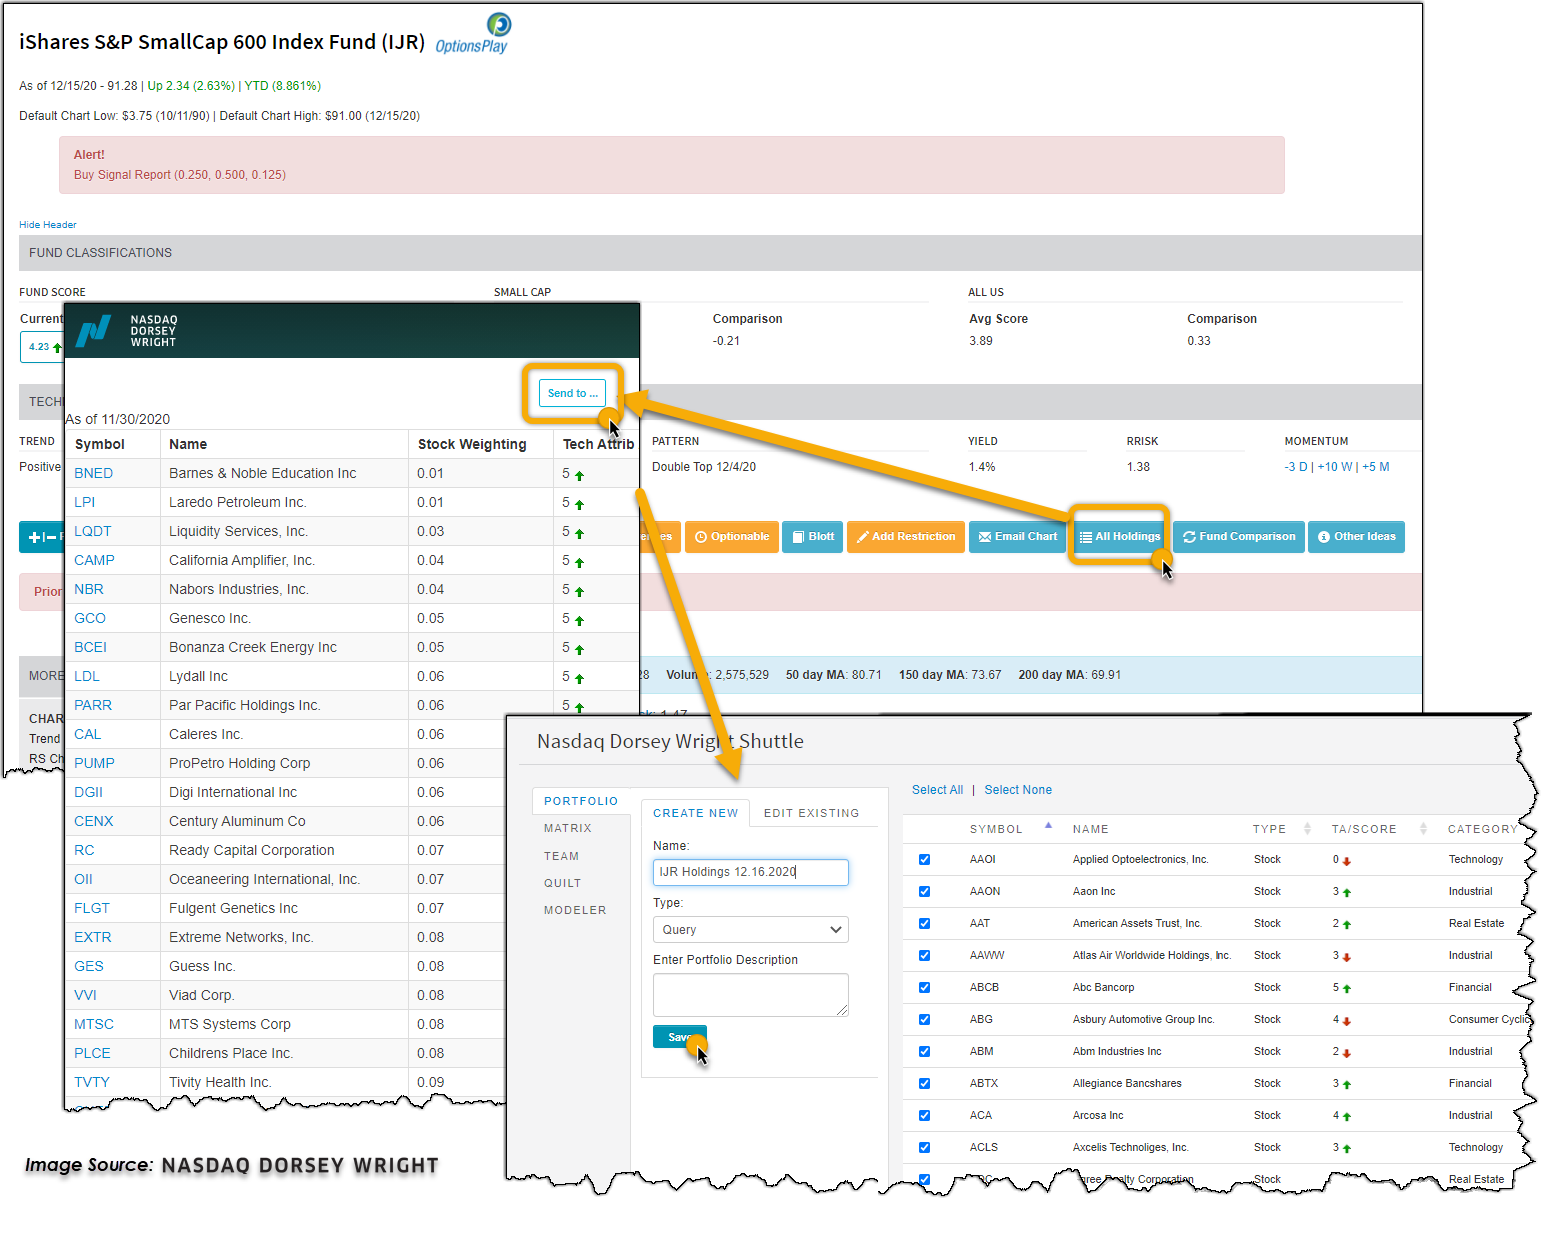
If you are looking for small-cap stock exposure via single stocks, simply click the “All Holdings” button off IJR’s trend chart. Once the current holdings are loaded in a new window, you can easily save the list to a custom portfolio by clicking the “Send to..” shuttle button. Once you click into this custom portfolio, we suggest sorting the list by technical attributes to identify the high RS names or even using the custom portfolio as the starting universe for a stock screen to generate actionable ideas.
SECTOR BULLISH PERCENT CHANGES
| Reversed to X | Reversed to O |
|---|---|
| 0 | 1 (BPPROT | 58), |
| To Xs | To Os |
|---|---|
| None | Leisure ( 0.66 to 64 ) |
| None | Retailing ( 0.02 to 62 ) |
| None | Wall Street ( 0.91 to 70 ) |
Average Level
67.39
| Sector |
|---|
| None |
| Sector |
|---|
| Drugs (48%) - Bull Confirmed |
| Sector |
|---|
| Autos & Parts (74%) - Bull Confirmed |
| Building (70%) - Bull Confirmed |
| Utilities / Electric (54%) - Bull Correction |
| Protection Safety Eq (58%) - Bull Correction |
SECTOR INDICATOR CHART CHANGES
PT is the percentage of stocks within a sector that are trading above their bullish support lines. RSX is the percentage of stocks within a sector whose relative strength charts are in a column of Xs. RSP is the percentage of stocks within a sector whose relative strength charts are on a buy signal. The strongest sectors, i.e. market leaders, will have most of these indicators positive and moving higher in a column of Xs.
|
There were only rising sector PT charts this week, with 16 rising and none moving lower. The following sector charts rose: Aerospace Airline [^PTAERO], Banks [^PTBANK], Biomedics/Genetics [^PTBIOM], Computers [^PTCOMP], Finance [^PTFINA], Gas Utilities [^PTGUTI], Healthcare [^PTHEAL], Insurance [^PTINSU], Oil [^PTOIL], Protection Safety Equipment [^PTPROT], Restaurants [^PTREST], Savings & Loans [^PTSAVI], Semiconductors [^PTSEMI], Textiles/Apparel [^PTTEXT], Transports/Non Air [^PTTRAN], Waste Management [^PTWAST]. No charts reversed in column. |
|
| ^PT Charts Reversing Up - | ^PT Charts Reversing Down - |
|
|
|
| ^PT Charts Moving Higher - | ^PT Charts Moving Lower - |
|
|
|
There were mostly RSX charts rising this week, with 19 rising and 3 moving lower. The following sector charts rose: Banks [^RSXBANK], Biomedics/Genetics [^RSXBIOM], Business Products [^RSXBUSI], Computers [^RSXCOMP], Electronics [^RSXELEC], Finance [^RSXFINA], Forest Prods/Paper [^RSXFORE], Internet [^RSXINET]-Rev. , Leisure [^RSXLEIS], Media [^RSXMEDI], Metals Non Ferrous [^RSXMETA], Oil Service [^RSXOILS], Precious Metals [^RSXPREC]-Rev. , Restaurants [^RSXREST], Savings & Loans [^RSXSAVI], Semiconductors [^RSXSEMI], Telephone [^RSXTELE], Wall Street [^RSXWALL], Waste Management [^RSXWAST]. The following sector charts fell: Building [^RSXBUIL]-Rev. , Household Goods [^RSXHOUS], Retailing [^RSXRETA]-Rev. . There were 2 that moved to buy signals and 0 that moved to sell signals. The following were buy signals: Electronics [^RSXELEC],Waste Management [^RSXWAST]. The following were sell signals: . |
|
| ^RSX Charts Reversing Up - | ^RSX Charts Reversing Down - |
| ^RSX Charts Moving Higher - | ^RSX Charts Moving Lower - |
|
|
|
There were only rising sector RSP charts this week, with 6 rising and none moving lower. The following sector charts rose: Gaming [^RSPGAME], Internet [^RSPINET]-Rev. , Oil [^RSPOIL], Oil Service [^RSPOILS], Textiles/Apparel [^RSPTEXT], Wall Street [^RSPWALL]-Rev. . There were 2 that reversed to X. |
|
| ^RSP Charts Reversing Up - | ^RSP Charts Reversing Down - |
|
|
|
| ^RSP Charts Moving Higher - | ^RSP Charts Moving Lower - |
|
|
|
FAVORED SECTOR STATUS CHANGES
A sector is considered to be Favored if it has 3 or 4 of the sector indicators (Relative Strength, RSX, RSP, & PT) positive, Average if it has 2 of the 4 indicators positive, & Unfavored if it has 0 or 1 of the indicators positive. The table below contains those sectors that have experienced a Favored Sector Status change over the past week. It is best to focus on sectors that are about 50% or lower on their Bullish Percent charts & are in Xs. Note: If a sector moves from Favored to Average, it doesn't necessarily mean that the sector in question has to be sold - it just means you need to evaluate your individual positions with exposure to that sector.
| Changes since 12/09/2020 | Full Report |
|
|
|
|
|||||||||
|
|
|
|
|
|
|||||||
|
|
|
|
|
|||||||
|
|
|
|
|
|
|||||||

The breadth of strength among international equity markets has continued to expand over the past week, with specific emerging market economies showing the most significant improvement. This can be seen on the non-US view of the Asset Class Group Scores (ACGS) page, which shows Latin America as the group with the highest average score direction among the international groups examined at a recent posting of 3.16. We can see that this improvement has essentially only been over the past six weeks, as the Latin America group began November at an average fund score of only 0.92 and has risen rapidly to its current group score of 3.74 through trading Tuesday. The group has not been able to maintain an average score above 4.00 for a prolonged period of time since the fourth quarter of 2018, making the potential further improvement of Latin America an important place to monitor as we look towards 2021.

The iShares S&P Latin America 40 ETF ILF has been indicative of this recent improvement, as it has ascended from a double bottom formation at $21 in November to march higher in a single column of Xs, reaching $29 earlier this month. Although the fund still sits in negative territory from a year-to-date performance standpoint with a return of -14% through Tuesday, ILF has risen over 17% in the past 30 days, besting the gains of the broad international fund ACWX as well as the broad emerging markets representative EEM, which have each gained just over 4% during the same timeframe. Looking underneath the hood at the country exposure within ILF reveals, perhaps unsurprisingly, that Brazil makes up a vast majority of the fund at an allocation of 62%. However, Mexico also has a substantial allocation at 21%, as the only other country representative with their percentage exposure in double-digits.

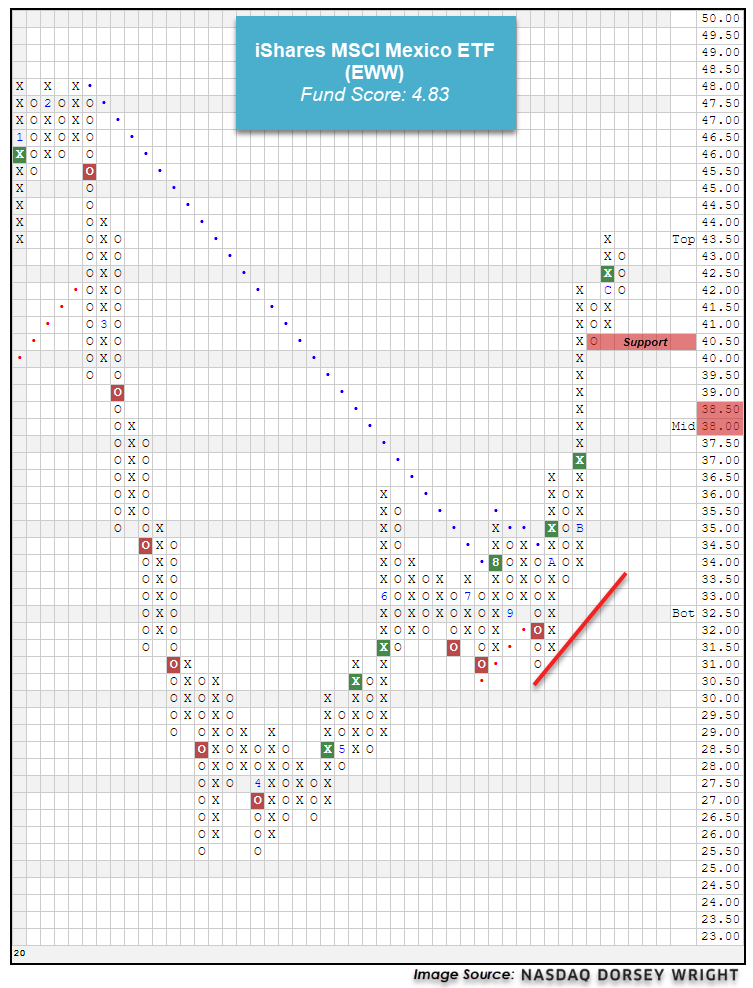
Those looking for investment ideas in Latin America outside of Brazil may consider the iShares MSCI Mexico ETF EWW as a potential candidate for further examination. This fund has moved substantially higher off its September low of $31 to break through to a positive trend and ultimately give three consecutive buy signals before reaching its December high of $43.50. The fund has since pulled back from heavily overbought territory and current sits at $42 on its default chart. This improvement can also be seen in its strongly positive score direction of 4.37 that brings its recent score posting to an impressive 4.83, which bests the average non-US equity fund (3.84) as well as the average Latin American fund (3.74). Exposure to EWW may be considered either at current levels or upon further normalization of the fund’s trading band, as it remains in slightly overbought territory with a recent weekly overbought/oversold (OBOS) reading of 77%. Initial support can be found at $40.50 on the default chart, with further support found on the more sensitive ¼ point chart at $38.25.
The US Treasury 10YR Yield Index TNX reversed up into a column of Xs at 0.95% in Wednesday’s trading, but remains below its recent high of 0.975%. The 30-year yield Index TYX also reversed up Wednesday and currently sits at 1.7%; TYX has formed a potential bullish triangle, which would be completed with a breakout at 1.75%.
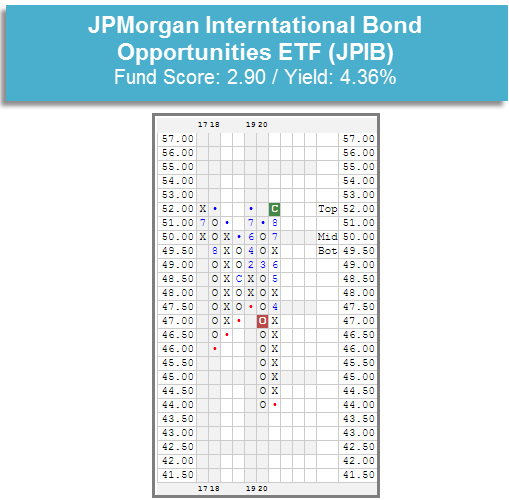
As mentioned last week, the US dollar DX/Y has continued to weaken and currently sits at a multi-year low on its default chart. The weakening dollar is a tailwind foreign bonds and in yesterday’s trading, the JPMorgan International Bond Opportunities ETF JPIB broke a double top at $52, returning it to a buy signal and a positive trend for the first time since March. JPIB currently has a 2.90 fund score and yields 4.36%. The fund currently sits in heavily-overbought territory, so those considering adding exposure may wish to wait for a pullback or for price to normalize at current levels.
As they have for much of the year, convertible bonds continue to lead the fixed income market from a relative strength perspective. The convertibles group currently has a 4.81 average fund score in the Asset Class Group Scores System, placing it first among fixed income group and fifth amongst all 135 groups in the system. Over the last 30 days (12/15), the inverse-fixed income group is the only fixed income group that has had its average score increase, as it has risen 0.06 points. The score of every other fixed income group has declined over this period, in many cases due to rising interest rates. The largest score deteriorations belong to the retirement & income, corp bond-high yield, strategic income, and inflation protection groups, which have all seen their scores decline by at least -0.25 points.
Remember, these are technical comments only. Just as you must be aware of fundamental data for the stocks we recommend based on technical criteria in the report, so too must you be aware of important data regarding delivery, market moving government releases, and other factors that may influence commodity pricing. We try to limit our technical comments to the most actively traded contracts in advance of delivery, but some contracts trade actively right up to delivery while others taper off well in advance. Be sure you check your dates before trading these contracts. For questions regarding this section or additional coverage of commodities email james.west@dorseywright.com.
Data represented in the table below is through 12/15/2020:
Broad Market Commodities Report
| Symbol | Name | Price | PnF Trend | RS Signal | RS Col. | 200 Day MA | Weekly Mom |
|---|---|---|---|---|---|---|---|
| CL/ | Crude Oil Continuous | 47.55 | Positive | Buy | O | 36.15 | +5W |
| DBLCIX | Deutsche Bank Liquid Commodities Index | 301.22 | Negative | Sell | O | 262.50 | +5W |
| DWACOMMOD | DWA Continuous Commodity Index | 568.78 | Positive | Buy | O | 480.26 | -201W |
| GC/ | Gold Continuous | 1857.50 | Negative | Buy | O | 1815.80 | -6W |
| HG/ | Copper Continuous | 3.54 | Positive | Buy | X | 2.78 | +7W |
| ZG/ | Corn (Electronic Day Session) Continuous | 425.00 | Positive | Buy | X | 354.60 | -7W |
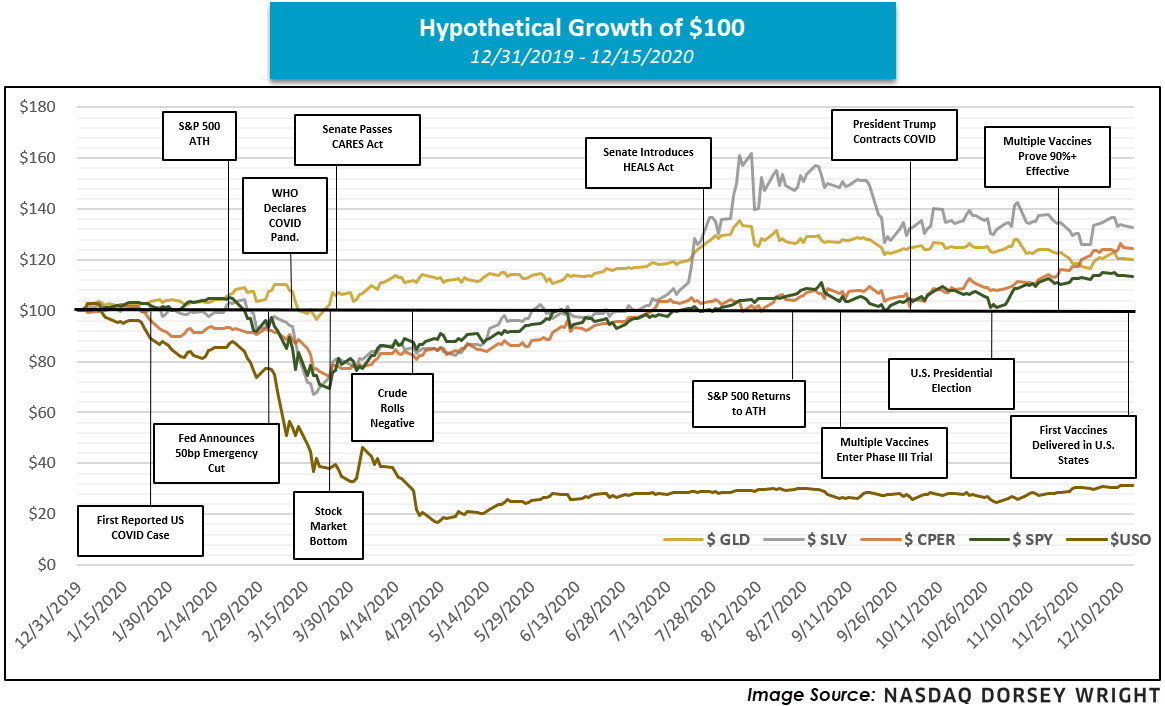
It’s been a hectic year, in many ways. When beginning to construct the graphic below, we quickly realized the sheer number of pivotal events that happened in 2020, implying our list is certainly not exhaustive; however, it does help convey the rollercoaster experience for the markets since the close of 2019. The year opened on mostly stable footing for the groups mentioned, and even after the first U.S. COVID case was reported in Washington state in late January, the S&P 500 (SPX) did not reach its all-time high until roughly a month later (February 19th). However, following the major index’s all-time high a series of events quickly sent the market and respective commodity prices lower, a few being the emergency rate cut from the Federal Reserve and declaration of COVID as a global pandemic. Note that while equites, copper, silver, and oil plummeted, gold remained relatively robust and partially led the charge off the market bottom on March 23rd, perhaps fulfilling its assumed role as a “safe haven” asset. Despite its recent pullback, gold (GLD) still holds an impressive year-to-date return north of 20%.
Keep in mind that after about a month following the market bottom on March 23rd, we still found crude oil falling, eventually rolling negative for the first time ever in April. Oil, represented by the United States Oil Fund (USO) below, remains the worst performer of the grouping on the year despite its recent bounce, posting a loss in excess of -60%.
However, as the global outlook began to improve with promising vaccine data and a continually accommodative fiscal posture, we then saw precious metals pick up steam, particularly silver. In fact, the iShares Silver Trust (SLV) hit $27 in August, its highest level in over seven years. As of late, we’ve seen the precious metals space cool as base metals like copper (represented by (CPER) below) and the broad equity market have continued steadily higher. Although through yesterday (12/15), SLV remains the best performer of the group on the year, followed by CPER, GLD, and the S&P 500 (TR.SPXX).
Average Level
47.45
| AGG | iShares US Core Bond ETF |
| USO | United States Oil Fund |
| DIA | SPDR Dow Jones Industrial Average ETF |
| DVY | iShares Dow Jones Select Dividend Index ETF |
| DX/Y | NYCE U.S.Dollar Index Spot |
| EFA | iShares MSCI EAFE ETF |
| FXE | Invesco CurrencyShares Euro Trust |
| GLD | SPDR Gold Trust |
| GSG | iShares S&P GSCI Commodity-Indexed Trust |
| HYG | iShares iBoxx $ High Yield Corporate Bond ETF |
| ICF | iShares Cohen & Steers Realty ETF |
| IEF | iShares Barclays 7-10 Yr. Tres. Bond ETF |
| LQD | iShares iBoxx $ Investment Grade Corp. Bond ETF |
| IJH | iShares S&P 400 MidCap Index Fund |
| ONEQ | Fidelity Nasdaq Composite Index Track |
| QQQ | Invesco QQQ Trust |
| RSP | Invesco S&P 500 Equal Weight ETF |
| IWM | iShares Russell 2000 Index ETF |
| SHY | iShares Barclays 1-3 Year Tres. Bond ETF |
| IJR | iShares S&P 600 SmallCap Index Fund |
| SPY | SPDR S&P 500 Index ETF Trust |
| TLT | iShares Barclays 20+ Year Treasury Bond ETF |
| GCC | WisdomTree Continuous Commodity Index Fund |
| VOOG | Vanguard S&P 500 Growth ETF |
| VOOV | Vanguard S&P 500 Value ETF |
| EEM | iShares MSCI Emerging Markets ETF |
| XLG | Invesco S&P 500 Top 50 ETF |
Relative strength is a measure of how a stock is performing when compared to something else, in this case the S&P 500 Equal Weighted Index (SPXEWI). Each day the stock's closing price is divided by that of the SPXEWI, the resulting numbers decimal is moved two places and then plotted on a Point & Figure chart. Whenever the relative strength chart shows a double top buy signal (e.g. RS Buy or Positive Relative Strength), it suggests the stock is likely to outperform the market for the foreseeable future. Conversely, whenever the relative strength chart gives a double bottom sell signal (e.g. RS Sell or Negative Relative Strength) it suggests the stock will under-perform the market. Relative strength signals tend to last roughly 18 to 24 months on average. Consequently, changes from buy signals to sell signals (and vice versa) are important to be aware of as they are longer-term implications of a stock's likely performance versus the indices. Using the Point & Figure chart along with the relative strength chart will allow you to better ascertain risk-reward and other trade management tools, but we always want to over-weight our portfolios toward those stocks that are on RS buy signals, giving us the best chance of outperforming the broader market.
In the Optionable Universe, this week we saw 38 relative strength buy signals compared to 51 last week. On the sell side, there were 10 relative strength sell signals compared to 12 last week.
| Symbol | Company | Sector | Price | RS vs Market Signal | RS vs Market Column | RS vs Peer Signal | RS vs Peer Column | Tech Attrib |
|---|---|---|---|---|---|---|---|---|
| ATLC | Atlanticus Holdings Corp | Financial Services | 21.370 | Buy | X | Buy | X | 5 |
| CIB | Bancolombia S.A. (Colombia) ADR | Banks | 40.660 | Buy | X | Sell | X | 3 |
| DENN | Denny's Corporation | Cyclical Goods and Services | 14.120 | Buy | X | Sell | X | 3 |
| EGHT | 8*8, Inc. | Technology Services | 31.000 | Buy | X | Sell | X | 4 |
| BIDU | Baidu, Inc. (China) ADR | Technology Services | 185.500 | Buy | X | Sell | X | 4 |
| CATM | Cardtronics PLC | Financial Services | 35.770 | Buy | X | Sell | X | 4 |
| VERU | Veru Inc. | Medical Products | 9.330 | Buy | X | Buy | X | 5 |
| IGT | International Game Technology | Cyclical Goods and Services | 15.260 | Buy | X | Sell | X | 4 |
| IMGN | Immunogen Inc | Biotechnology | 7.440 | Buy | X | Buy | X | 5 |
| JOE | the St Joe Company | Real Estate Investment & Services | 38.690 | Buy | X | Buy | X | 5 |
| LPL | LG Display Co., Ltd. (Korea) ADR | Industrial Goods & Svcs | 8.320 | Buy | X | Sell | X | 2 |
| NBR | Nabors Industries, Inc. | Oil Drilling, Equipment Svcs | 70.580 | Buy | X | Buy | X | 5 |
| PSMT | PriceSmart, Inc. | Retail | 91.480 | Buy | X | Sell | X | 3 |
| LPI | Laredo Petroleum Inc. | Oil Companies Major | 19.510 | Buy | X | Buy | X | 5 |
| MTDR | Matador Resources Company | Oil Companies Secondary | 12.440 | Buy | X | Buy | X | 5 |
| SF | Stifel Financial Corp | Financial Services | 77.400 | Buy | X | Buy | X | 5 |
| SGMO | Sangamo Therapeutics Inc. | Biotechnology | 12.980 | Buy | O | Buy | O | 3 |
| WBS | Webster Financial Corporation | Banks | 43.010 | Buy | X | Sell | X | 4 |
| CBIO | Catalyst Biosciences Inc. | Biotechnology | 7.230 | Buy | X | Sell | X | 3 |
| WD | Walker & Dunlop, Inc. | Real Estate Investment & Services | 90.730 | Buy | X | Buy | X | 5 |
| UAN | CVR L.P. | Chemicals | 14.230 | Buy | X | Buy | X | 4 |
| SCM | Stellus Capital Investment Corp | Financial Services | 11.020 | Buy | X | Buy | X | 5 |
| VUZI | Vuzix Corporation | Communications Technology | 5.740 | Buy | X | Sell | X | 4 |
| BRG | Bluerock Residential Growth REIT, Inc. | Equity REITs | 11.060 | Buy | X | Buy | X | 5 |
| SCYX | Scynexis Inc. | Pharmaceuticals | 7.400 | Buy | X | Buy | X | 5 |
| FLOW | SPX FLOW INC | Industrial Goods & Svcs | 59.730 | Buy | X | Sell | X | 4 |
| EDIT | Editas Medicine Inc | Biotechnology | 64.930 | Buy | X | Buy | X | 5 |
| TRTN | Triton International Ltd/Bermuda | Industrial Goods & Svcs | 48.880 | Buy | X | Sell | X | 4 |
| PUMP | ProPetro Holding Corp | Oil Companies Major | 8.100 | Buy | X | Buy | X | 5 |
| BKR | Baker Hughes Company | Oil Companies Secondary | 22.010 | Buy | X | Buy | X | 5 |
| CEIX | CONSOL Energy Inc. | Coal | 7.100 | Buy | X | Buy | X | 4 |
| SMAR | Smartsheet, Inc. Class A | Software | 71.140 | Buy | X | Sell | X | 4 |
| LEVI | Levi Strauss & Co. Class A | Cyclical Goods and Services | 20.820 | Buy | X | Sell | X | 4 |
| EWBC.TR | East West Bancorp, Inc. TR | Banks | 52.285 | Buy | X | Sell | X | 4 |
| IMGN.TR | Immunogen Inc TR | Biotechnology | 7.440 | Buy | X | Buy | X | 5 |
| COF.TR | Capital One Financial Corporation TR | Financial Services | 94.309 | Buy | X | Sell | X | 4 |
| DXC.TR | DXC Technology Co TR | Technology Hardware Equip | 24.185 | Buy | X | Sell | X | 3 |
| JOE.TR | the St Joe Company TR | Real Estate Investment & Services | 38.779 | Buy | X | Buy | X | 5 |
| Symbol | Company | Sector | Price | RS vs Market Signal | RS vs Market Column | RS vs Peer Signal | RS vs Peer Column | Tech Attrib |
|---|---|---|---|---|---|---|---|---|
| CALM | Cal-Maine Foods, Inc. | Food and Beverage | 37.450 | Sell | O | Sell | O | 0 |
| GPRE | Green Plains Inc. | Chemicals | 13.810 | Sell | O | Buy | O | 2 |
| K | Kellogg Company | Food and Beverage | 61.240 | Sell | O | Sell | O | 0 |
| NOC | Northrop Grumman Systems Corporation | Industrial Goods & Svcs | 298.510 | Sell | O | Buy | O | 1 |
| CONE | CyrusOne Inc | Equity REITs | 68.110 | Sell | O | Sell | O | 0 |
| RDHL | REDHILL BIOPHARMA LTD | Pharmaceuticals | 8.890 | Sell | O | Buy | O | 2 |
| BZUN | Baozun Inc | Technology Services | 34.560 | Sell | O | Sell | O | 0 |
| BJ | BJ's Wholesale Club Holdings Inc | Retail | 37.110 | Sell | O | Sell | O | 1 |
| GPRE.TR | Green Plains Inc. TR | Chemicals | 13.810 | Sell | O | Buy | O | 2 |
| WPC.TR | W.P. Carey & Co. LLC TR | Equity REITs | 76.330 | Sell | O | Buy | O | 2 |
| Symbol | Company | Sector | Current Price | Action Price | Target | Stop | Notes |
|---|---|---|---|---|---|---|---|
| AOS | A.O. Smith Corporation | Building | $56.42 | mid to upper 50s | 72 | 47 | 4 for 5'er, four consec buy signals, mutli-year high, market RS buy signal since 9/2008, 1.86% yield |
| SPWR | Sunpower Corporation | Electronics | $24.87 | low 20s | 33.50 | 18 | 5 for 5'er, #3 of 59 names in ELEC sector matrix, pos wkly mom flip, pot cov. write |
| BECN | Beacon Roofing Supply, Inc. | Building | $39.21 | 36 - 40 | 56 | 30 | 4 for 5'er, top third of fav DWABUIL, consec buy signals, 52 week highs, pos weekly mom flip |
| APAM | Artisan Partners Asset Management, Inc | Finance | $48.50 | mid-to-upper 40s | 53.50 | 39 | 5 for 5'er, top 20% of FINA sector matrix, multiple buy signals, pos wkly mom flip, 6% yield |
| CZR | Caesars Entertainment Inc. | Gaming | $75.24 | low-to-mid 70s | 88 | 62 | 4 for 5'er, #1 of 12 in favored GAME sector matrix, triple top breakout, pot. covered write |
| APPS | Digital Turbine Inc. | Computers | $48.02 | low to upper 40s | 78 | 35 | 5 for 5'er, LT market RS buy signal, consec buy signals, pullback from ATH,fav COMP sector |
| LASR | nLIGHT, Inc. | Semiconductors | $35.51 | low-to-mid 30s | 55 | 27 | 5 for 5'er, top 10% of SEMI sector matrix, consec buy signals, pullback from multi-year high |
| JCI | Johnson Controls International PLC | Protection Safety Equipment | $46.04 | mid 30s | 58 | 39 | 4 for 5'er, top half of PROT sector matrix, multiple buy signals 2.3% yield, R-R>2.0 |
| DE | Deere & Company | Machinery and Tools | $261.99 | 250s to low 270s | 348 | 208 | 5 for 5'er, ATH, pos trend, top 25% of DWAMACH, 1 box from 7th consec buy signal |
| PWR | Quanta Services, Inc. | Electronics | $69.24 | hi 60s - low 70s | 86 | 58 | 5 for 5'er, top 20% of favored ELEC sector matrix, triple top breakout, pullback from ATH |
| Symbol | Company | Sector | Current Price | Action Price | Target | Stop | Notes |
|---|
| Comment |
|---|
| SNPS Synopsys Inc R ($247.74) - Software - We will now raise our stop to $208, the first potential sell signal on SNPS's default chart. |
| NOW Servicenow Inc R ($547.85) - Software - We will now raise our stop $472, a potential spread triple bottom break on NOW's default chart. |
| Z Zillow Group Inc. Class C R ($135.16) - Real Estate - We will now raise or stop to $114, the first potential sell signal on Z's default chart. |
| ENPH Enphase Energy Inc R ($160.70) - Electronics - We will now raise our stop to $124, the firs potential sell signal on ENPH's default chart. |
PWR Quanta Services, Inc. R ($68.50) - Electronics - PWR is a 5 for 5'er that ranks in the top quintile of the favored electronics sector matrix. On its default chart, PWR has given seven consecutive buy signals, most recently breaking a triple top at $71. The stock reached an all-time high in last week's trading before pulling back, offering an entry point for long exposure. PWR also offers a potential covered write opportunity on the May '21 call options. Long exposure may be added in the upper $60s and lower $70s and we will set our initial stop at $58, which would take out multiple levels of support on PWR's default chart. Using a modified vertical price objective based on the most recent buy signal, we will set our target price at $86.
| 16 | 17 | 18 | 19 | 20 | |||||||||||||||||||||||||||||||||||||||||||||||||
| 73.00 | X | 73.00 | |||||||||||||||||||||||||||||||||||||||||||||||||||
| 72.00 | X | O | 72.00 | ||||||||||||||||||||||||||||||||||||||||||||||||||
| 71.00 | C | O | 71.00 | ||||||||||||||||||||||||||||||||||||||||||||||||||
| 70.00 | X | X | X | O | 70.00 | ||||||||||||||||||||||||||||||||||||||||||||||||
| 69.00 | X | O | X | O | X | O | 69.00 | ||||||||||||||||||||||||||||||||||||||||||||||
| 68.00 | X | X | O | X | O | X | o | 68.00 | |||||||||||||||||||||||||||||||||||||||||||||
| 67.00 | X | O | X | O | X | O | 67.00 | ||||||||||||||||||||||||||||||||||||||||||||||
| 66.00 | X | O | X | O | X | 66.00 | |||||||||||||||||||||||||||||||||||||||||||||||
| 65.00 | X | O | X | O | Mid | 65.00 | |||||||||||||||||||||||||||||||||||||||||||||||
| 64.00 | X | X | B | O | X | 64.00 | |||||||||||||||||||||||||||||||||||||||||||||||
| 63.00 | X | O | X | O | X | O | X | 63.00 | |||||||||||||||||||||||||||||||||||||||||||||
| 62.00 | X | O | X | O | X | O | 62.00 | ||||||||||||||||||||||||||||||||||||||||||||||
| 61.00 | X | O | X | O | 61.00 | ||||||||||||||||||||||||||||||||||||||||||||||||
| 60.00 | X | O | X | 60.00 | |||||||||||||||||||||||||||||||||||||||||||||||||
| 59.00 | X | O | 59.00 | ||||||||||||||||||||||||||||||||||||||||||||||||||
| 58.00 | X | 58.00 | |||||||||||||||||||||||||||||||||||||||||||||||||||
| 57.00 | X | 57.00 | |||||||||||||||||||||||||||||||||||||||||||||||||||
| 56.00 | X | 56.00 | |||||||||||||||||||||||||||||||||||||||||||||||||||
| 55.00 | A | Bot | 55.00 | ||||||||||||||||||||||||||||||||||||||||||||||||||
| 54.00 | X | 54.00 | |||||||||||||||||||||||||||||||||||||||||||||||||||
| 53.00 | X | X | 53.00 | ||||||||||||||||||||||||||||||||||||||||||||||||||
| 52.00 | 9 | O | X | 52.00 | |||||||||||||||||||||||||||||||||||||||||||||||||
| 51.00 | X | O | X | 51.00 | |||||||||||||||||||||||||||||||||||||||||||||||||
| 50.00 | X | O | X | 50.00 | |||||||||||||||||||||||||||||||||||||||||||||||||
| 49.00 | X | O | 49.00 | ||||||||||||||||||||||||||||||||||||||||||||||||||
| 48.00 | X | 48.00 | |||||||||||||||||||||||||||||||||||||||||||||||||||
| 47.00 | X | 47.00 | |||||||||||||||||||||||||||||||||||||||||||||||||||
| 46.00 | X | 46.00 | |||||||||||||||||||||||||||||||||||||||||||||||||||
| 45.00 | • | X | • | 45.00 | |||||||||||||||||||||||||||||||||||||||||||||||||
| 44.00 | X | • | X | • | 44.00 | ||||||||||||||||||||||||||||||||||||||||||||||||
| 43.00 | B | O | • | X | X | • | 43.00 | ||||||||||||||||||||||||||||||||||||||||||||||
| 42.00 | X | O | • | X | O | 8 | • | 42.00 | |||||||||||||||||||||||||||||||||||||||||||||
| 41.00 | 5 | X | C | • | X | O | X | • | 41.00 | ||||||||||||||||||||||||||||||||||||||||||||
| 40.00 | 1 | X | O | X | O | X | • | X | O | X | X | • | 40.00 | ||||||||||||||||||||||||||||||||||||||||
| 39.00 | C | O | X | O | X | X | X | 1 | X | O | • | X | O | X | O | X | • | 39.00 | |||||||||||||||||||||||||||||||||||
| 38.00 | X | A | O | 4 | O | 6 | O | X | O | X | 2 | X | O | • | X | 6 | O | X | O | X | • | 38.00 | |||||||||||||||||||||||||||||||
| 37.00 | 1 | O | X | 9 | 2 | X | X | 3 | O | X | O | X | O | X | O | 3 | X | O | X | O | X | 7 | X | • | 37.00 | ||||||||||||||||||||||||||||
| 36.00 | X | O | 8 | O | X | O | X | O | 5 | O | C | 2 | O | X | 8 | 9 | A | O | X | O | X | O | O | • | 36.00 | ||||||||||||||||||||||||||||
| 35.00 | C | 4 | X | O | X | O | X | O | X | O | X | O | X | O | O | X | O | X | 5 | X | • | 35.00 | |||||||||||||||||||||||||||||||
| 34.00 | X | 5 | 7 | O | O | X | 3 | X | 6 | B | O | X | O | X | • | O | X | O | X | • | 34.00 | ||||||||||||||||||||||||||||||||
| 33.00 | X | O | X | O | 4 | O | X | O | X | O | • | O | 4 | O | X | • | 33.00 | ||||||||||||||||||||||||||||||||||||
| 32.00 | X | O | X | A | X | O | X | • | O | X | X | X | O | X | • | 32.00 | |||||||||||||||||||||||||||||||||||||
| 31.00 | • | X | O | O | O | 1 | • | O | X | O | X | O | X | O | X | • | 31.00 | ||||||||||||||||||||||||||||||||||||
| 30.00 | • | B | O | X | • | O | X | O | X | O | X | O | X | • | 30.00 | ||||||||||||||||||||||||||||||||||||||
| 29.00 | • | A | O | X | • | O | O | X | O | O | • | 29.00 | |||||||||||||||||||||||||||||||||||||||||
| 28.00 | • | X | O | • | O | X | • | 28.00 | |||||||||||||||||||||||||||||||||||||||||||||
| 27.00 | • | 9 | • | O | X | • | 27.00 | ||||||||||||||||||||||||||||||||||||||||||||||
| 26.00 | O | 8 | • | O | X | • | 26.00 | ||||||||||||||||||||||||||||||||||||||||||||||
| 25.00 | O | 7 | • | O | X | • | 25.00 | ||||||||||||||||||||||||||||||||||||||||||||||
| 24.00 | O | X | • | O | • | 24.00 | |||||||||||||||||||||||||||||||||||||||||||||||
| 23.00 | O | C | 4 | • | • | 23.00 | |||||||||||||||||||||||||||||||||||||||||||||||
| 22.00 | O | X | O | X | • | 22.00 | |||||||||||||||||||||||||||||||||||||||||||||||
| 21.00 | O | B | O | 3 | • | 21.00 | |||||||||||||||||||||||||||||||||||||||||||||||
| 20.00 | O | X | O | X | • | 20.00 | |||||||||||||||||||||||||||||||||||||||||||||||
| 19.50 | O | X | O | X | • | 19.50 | |||||||||||||||||||||||||||||||||||||||||||||||
| 19.00 | O | X | 1 | 2 | X | • | 19.00 | ||||||||||||||||||||||||||||||||||||||||||||||
| 18.50 | O | O | X | O | X | • | 18.50 | ||||||||||||||||||||||||||||||||||||||||||||||
| 18.00 | O | X | O | X | • | 18.00 | |||||||||||||||||||||||||||||||||||||||||||||||
| 17.50 | O | O | X | • | 17.50 | ||||||||||||||||||||||||||||||||||||||||||||||||
| 17.00 | O | • | 17.00 | ||||||||||||||||||||||||||||||||||||||||||||||||||
| 16 | 17 | 18 | 19 | 20 |
| AGCO AGCO Corporation ($97.81) - Machinery and Tools - AGCO returned to a buy signal on Wednesday with a double top break at $97 and continued higher to $98, now just one box away from matching its all-time chart high. The 4 for 5'er ranks in the top quartile of the favored machinery and tools stock sector matrix and recently returned to an RS buy signal versus the market last month. Demand is in control. Initial support is offered around $89. |
| BLNK Blink Charging Co ($31.61) - Autos and Parts - BLNK broke a spread quadruple top at $30 before moving higher to $31 on Wednesday. BLNK is a perfect 5 for 5’er within the favored autos and parts sector that ranks 4th out of 53 stocks in the sector RS matrix. From here, support sits at $26 while overhead resistance lies at $34. |
| CHDN Churchill Downs Inc ($203.44) - Gaming - CHDN broke a spread triple top at $204 and is now trading at new all-time highs. CHDN is a healthy 4 for 5’er within the favored gaming sector that has maintained a long-term market RS buy signal since March 2015. From here, support sits at $192. |
| DFS Discover Financial Services ($86.38) - Finance - DFS shares moved higher today to break a double top at $86 to mark its third consecutive buy signal. This 4 for 5'er has been in a positive trend since September and on an RS buy signal versus the market since May. Recent price action has put DFS into heavily overbought territory, so those wishing to take a long position may be best served to wait for a pullback or price normalization. From here, support can be found at $82. |
| DKNG DraftKings Inc Class A ($53.80) - Gaming - DKNG broke a triple top at $54 on Wednesday, flipping the overall trend back to positive. DKNG is now a 4 for 5’er within the favored gaming sector that has experienced four weeks of positive weekly momentum. From here, support sits at $48 while DKNG faces resistance at $64. |
| DOMO Domo, Inc. Class B ($60.46) - Software - DOMO reversed up into a column of Xs Wednesday and broke a double top at $58, before reaching a new all-time high at $60 intraday. This 5 for 5'er moved to a positive trend in April and ranks 8th out of 120 names in the software sector RS matrix. Weekly momentum recently flipped positive also, indicating the potential for higher prices. The overall weight of the evidence is positive here, however, recent price movement has left DOMO in heavily overbought territory so those looking to add exposure may be best served by waiting for a pullback or normalization of the trading band. Initial support is offered at $54, with further support potentially found at $43. |
| DRI Darden Restaurants, Inc. ($116.50) - Restaurants - DRI broke a double top at $116 before moving higher to $118, marking the stock’s second consecutive buy signal. DRI is a 4 for 5’er within the favored restaurants sector that is trading well above the bullish support line. From here, support sits at $106 while resistance lies at $124. DRI expects earnings on 12/18. |
| GKOS Glaukos Corp. ($72.11) - Healthcare - GKOS shares moved higher today to break a double top at $72 to mark its sixth consecutive buy signal. This 5 for 5'er has been in a positive trend since September and on an RS buy signal versus the market since October. Recent price action has put GKOS into heavily overbought territory, so those wishing to initiate a long position may be best served to wait for a pullback or price normalization. From here, support can be offered at $67. |
| IMVT Health Sciences Acquisitions Corporation ($51.71) - Biomedics/Genetics - IMVT shares moved higher today to break a triple top at $52 to return to a buy signal. This 5 for 5'er has been in a positive trend and on an RS buy signal versus the market since March. With a weekly overbought/oversold reading of 27%, IMVT is actionable at current levels. From here, support can be found at $46. |
| SNX SYNNEX Corporation ($82.93) - Computers - Shares of SNX moved higher Wednesday to break a double top at $83, matching its all-time high from earlier this month. This 4 for 5'er moved to a positive trend in May and ranks in the top third of the favored computers sector RS matrix. Weekly momentum recently flipped positive as well, suggesting the potential for further upside from here. Those looking to add exposure may consider the stock at current levels, with initial support offered at $78. Further support can be found at $76, $75, and $73. Note that earnings are expected on 1/7. |
| YETI YETI Holdings, Inc. ($73.65) - Leisure - YETI is a perfect 5 for 5’er within the favored leisure sector. YETI broke a double top at $73 before moving higher to $74, marking a new all-time high in addition to the stock’s fourth consecutive buy signal. From here, support sits at $68. |
| Name | Option Symbol | Action | Stop Loss |
|---|---|---|---|
| The TJX Companies, Inc. - $66.62 | TJX2116D60 | Buy the April 60.00 calls at 9.20 | 60.00 |
| Name | Option | Action |
|---|---|---|
| Weyerhaeuser Company ( WY) | Jan. 26.00 Calls | Raise the option stop loss to 5.50 (CP: 7.50) |
| Apple Inc. ( AAPL) | Apr. 120.00 Calls | Raise the option stop loss to 13.05 (CP: 15.05) |
| Name | Option Symbol | Action | Stop Loss |
|---|---|---|---|
| JD.COM INC - $81.77 | JD2119O85 | Buy the March 85.00 puts at 8.95 | 86.00 |
| Name | Option | Action |
|---|---|---|
| The Progressive Corporation (PGR) | Feb. 100.00 Puts | Stopped at 98.00 (CP: 96.21) |
| Name | Option Sym. | Call to Sell | Call Price | Investment for 500 Shares | Annual Called Rtn. | Annual Static Rtn. | Downside Protection |
|---|---|---|---|---|---|---|---|
| American International Group, Inc. $38.54 | AIG2121E40 | May. 40.00 | 3.00 | $17,866.60 | 25.43% | 16.94% | 6.75% |
| Name | Action |
|---|---|
| Marathon Petroleum Corp. (MPC) - 42.25 | Sell the April 45.00 Calls. |
| Phillips-Van Heusen Corporation (PVH) - 95.53 | Sell the March 90.00 Calls. |
| Comerica Incorporated (CMA) - 52.95 | Sell the April 57.50 Calls. |
| Delta Air Lines Inc. (DAL) - 41.85 | Sell the March 45.00 Calls. |
| KeyCorp (KEY) - 15.69 | Sell the March 16.00 Calls. |
| Mosaic Company (MOS) - 23.11 | Sell the March 25.00 Calls. |
| Name | Covered Write |
|---|---|
| General Motors ( GM - 41.66 ) | March 45.00 covered write. |
Daily Equity & Market Analysis
Loading, Please Wait...
