It’s been a hectic year, in many ways, so we created a brief timeline of key events with respective commodity performance
Remember, these are technical comments only. Just as you must be aware of fundamental data for the stocks we recommend based on technical criteria in the report, so too must you be aware of important data regarding delivery, market moving government releases, and other factors that may influence commodity pricing. We try to limit our technical comments to the most actively traded contracts in advance of delivery, but some contracts trade actively right up to delivery while others taper off well in advance. Be sure you check your dates before trading these contracts. For questions regarding this section or additional coverage of commodities email james.west@dorseywright.com.
Data represented in the table below is through 12/15/2020:
Broad Market Commodities Report
Portfolio View - Commodity Indices
| Symbol | Name | Price | PnF Trend | RS Signal | RS Col. | 200 Day MA | Weekly Mom |
|---|---|---|---|---|---|---|---|
| CL/ | Crude Oil Continuous | 47.55 | Positive | Buy | O | 36.15 | +5W |
| DBLCIX | Deutsche Bank Liquid Commodities Index | 301.22 | Negative | Sell | O | 262.50 | +5W |
| DWACOMMOD | DWA Continuous Commodity Index | 568.78 | Positive | Buy | O | 480.26 | -201W |
| GC/ | Gold Continuous | 1857.50 | Negative | Buy | O | 1815.80 | -6W |
| HG/ | Copper Continuous | 3.54 | Positive | Buy | X | 2.78 | +7W |
| ZG/ | Corn (Electronic Day Session) Continuous | 425.00 | Positive | Buy | X | 354.60 | -7W |
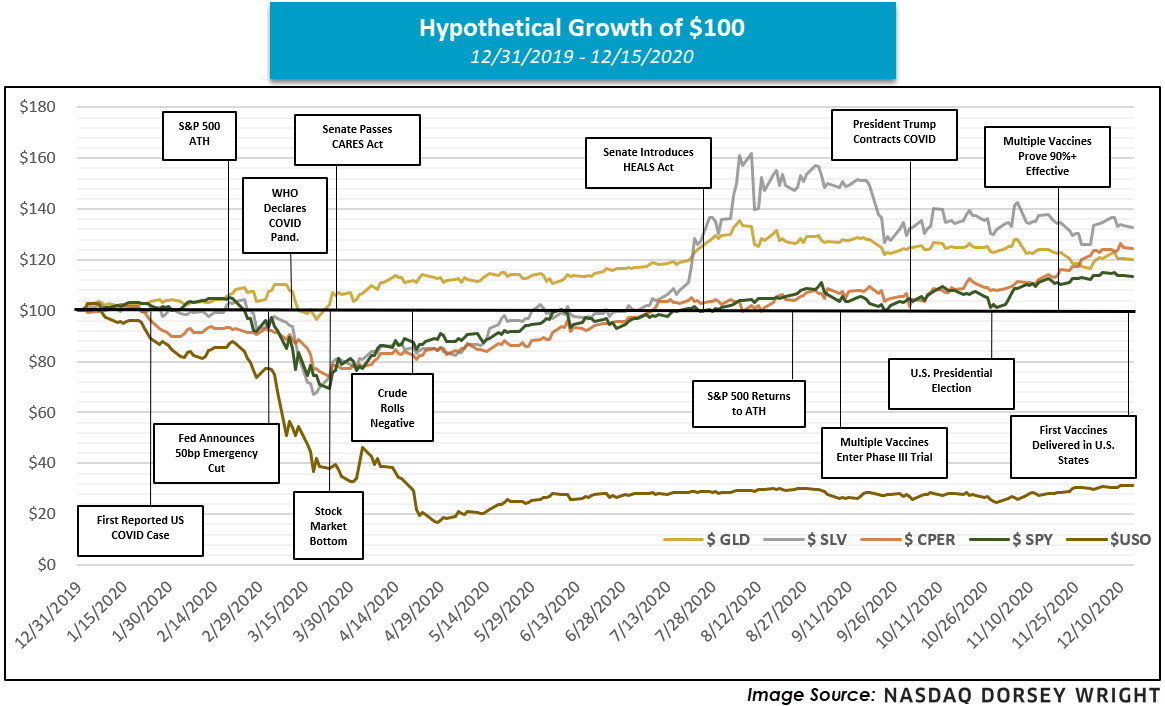
It’s been a hectic year, in many ways. When beginning to construct the graphic below, we quickly realized the sheer number of pivotal events that happened in 2020, implying our list is certainly not exhaustive; however, it does help convey the rollercoaster experience for the markets since the close of 2019. The year opened on mostly stable footing for the groups mentioned, and even after the first U.S. COVID case was reported in Washington state in late January, the S&P 500 (SPX) did not reach its all-time high until roughly a month later (February 19th). However, following the major index’s all-time high a series of events quickly sent the market and respective commodity prices lower, a few being the emergency rate cut from the Federal Reserve and declaration of COVID as a global pandemic. Note that while equites, copper, silver, and oil plummeted, gold remained relatively robust and partially led the charge off the market bottom on March 23rd, perhaps fulfilling its assumed role as a “safe haven” asset. Despite its recent pullback, gold (GLD) still holds an impressive year-to-date return north of 20%.
Keep in mind that after about a month following the market bottom on March 23rd, we still found crude oil falling, eventually rolling negative for the first time ever in April. Oil, represented by the United States Oil Fund (USO) below, remains the worst performer of the grouping on the year despite its recent bounce, posting a loss in excess of -60%.
However, as the global outlook began to improve with promising vaccine data and a continually accommodative fiscal posture, we then saw precious metals pick up steam, particularly silver. In fact, the iShares Silver Trust (SLV) hit $27 in August, its highest level in over seven years. As of late, we’ve seen the precious metals space cool as base metals like copper (represented by (CPER) below) and the broad equity market have continued steadily higher. Although through yesterday (12/15), SLV remains the best performer of the group on the year, followed by CPER, GLD, and the S&P 500 (TR.SPXX).