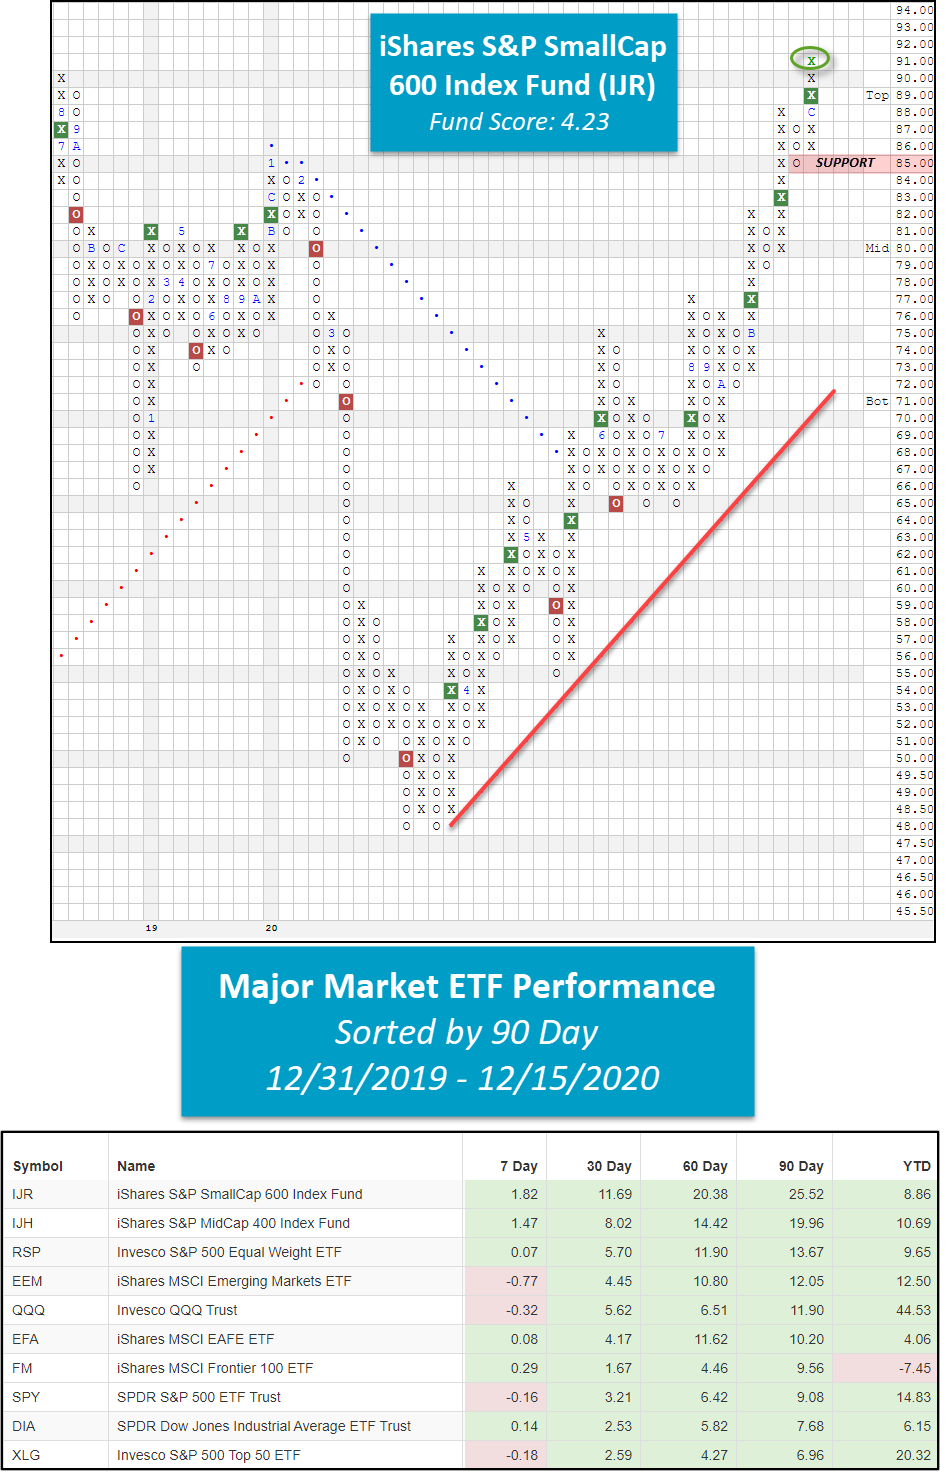
IJR prints a new all-time high.
Portfolio View - Major Market ETFs
| Symbol | Name | Price | Yield | PnF Trend | RS Signal | RS Col. | Fund Score | 200 Day MA | Weekly Mom |
|---|---|---|---|---|---|---|---|---|---|
| DIA | SPDR Dow Jones Industrial Average ETF Trust | 302.62 | 2.03 | Positive | O | 3.84 | 263.65 | +6W | |
| EEM | iShares MSCI Emerging Markets ETF | 50.48 | 2.38 | Positive | Sell | O | 5.21 | 41.93 | +10W |
| EFA | iShares MSCI EAFE ETF | 72.26 | 2.31 | Positive | Sell | O | 2.97 | 61.91 | +7W |
| FM | iShares MSCI Frontier 100 ETF | 28.09 | 2.90 | Positive | Sell | O | 1.19 | 24.57 | -1W |
| IJH | iShares S&P MidCap 400 Index Fund | 227.83 | 1.48 | Positive | Buy | O | 3.53 | 181.79 | +10W |
| IJR | iShares S&P SmallCap 600 Index Fund | 91.28 | 1.40 | Positive | Buy | O | 4.23 | 69.91 | +10W |
| QQQ | Invesco QQQ Trust | 307.29 | 0.54 | Positive | Buy | X | 4.77 | 253.10 | +4W |
| RSP | Invesco S&P 500 Equal Weight ETF | 126.89 | 1.73 | Positive | Buy | X | 4.35 | 104.74 | +10W |
| SPY | SPDR S&P 500 ETF Trust | 369.59 | 1.54 | Positive | O | 4.11 | 317.50 | +7W | |
| XLG | Invesco S&P 500 Top 50 ETF | 280.81 | 1.28 | Positive | O | 4.44 | 244.36 | +4W |
Additional Comments:
It was a mixed bag in terms of performance over the last week as six major market funds covered in this report finished the week in positive territory while the remaining four funds finished in the red. The best performing ETF for the week was once again the iShares S&P SmallCap 600 Index Fund IJR with a gain of 1.82% while the iShares MSCI Emerging Markets ETF EEM lagged with a loss of -0.77%.
Last week, we discussed the notable action on the Point & Figure chart of IJR, which had just rallied to match its all-time high from August 2018 at $90. As previously mentioned, IJR gained 0.91% over the last seven days, making it the best performing major market fund for the second week in a row. With Tuesday’s (12/15) trading session, IJR’s positive price action caused the fund to print an X at $91, officially marking a new all-time high for the small-cap proxy. Currently, IJR has a solid fund score of 4.23 coupled with a strongly positive score direction of 2.65. While IJR still lags the majority of the major market funds covered in this report on a year-to-date basis, we find that over the last 30, 60, and 90 day periods, IJR has outperformed all 10 major market funds, including the high-flying QQQ and SPY. IJR’s impressive rally has pushed the fund into heavily overbought territory, where the potential for a mean-reversion becomes higher. Currently, IJR’s overbought/oversold (OBOS%) reading is 123% overbought, the highest OBOS% level recorded since December 2016 when it read 129% overbought. From here, initial support sits at $85, with additional support offered at $79.
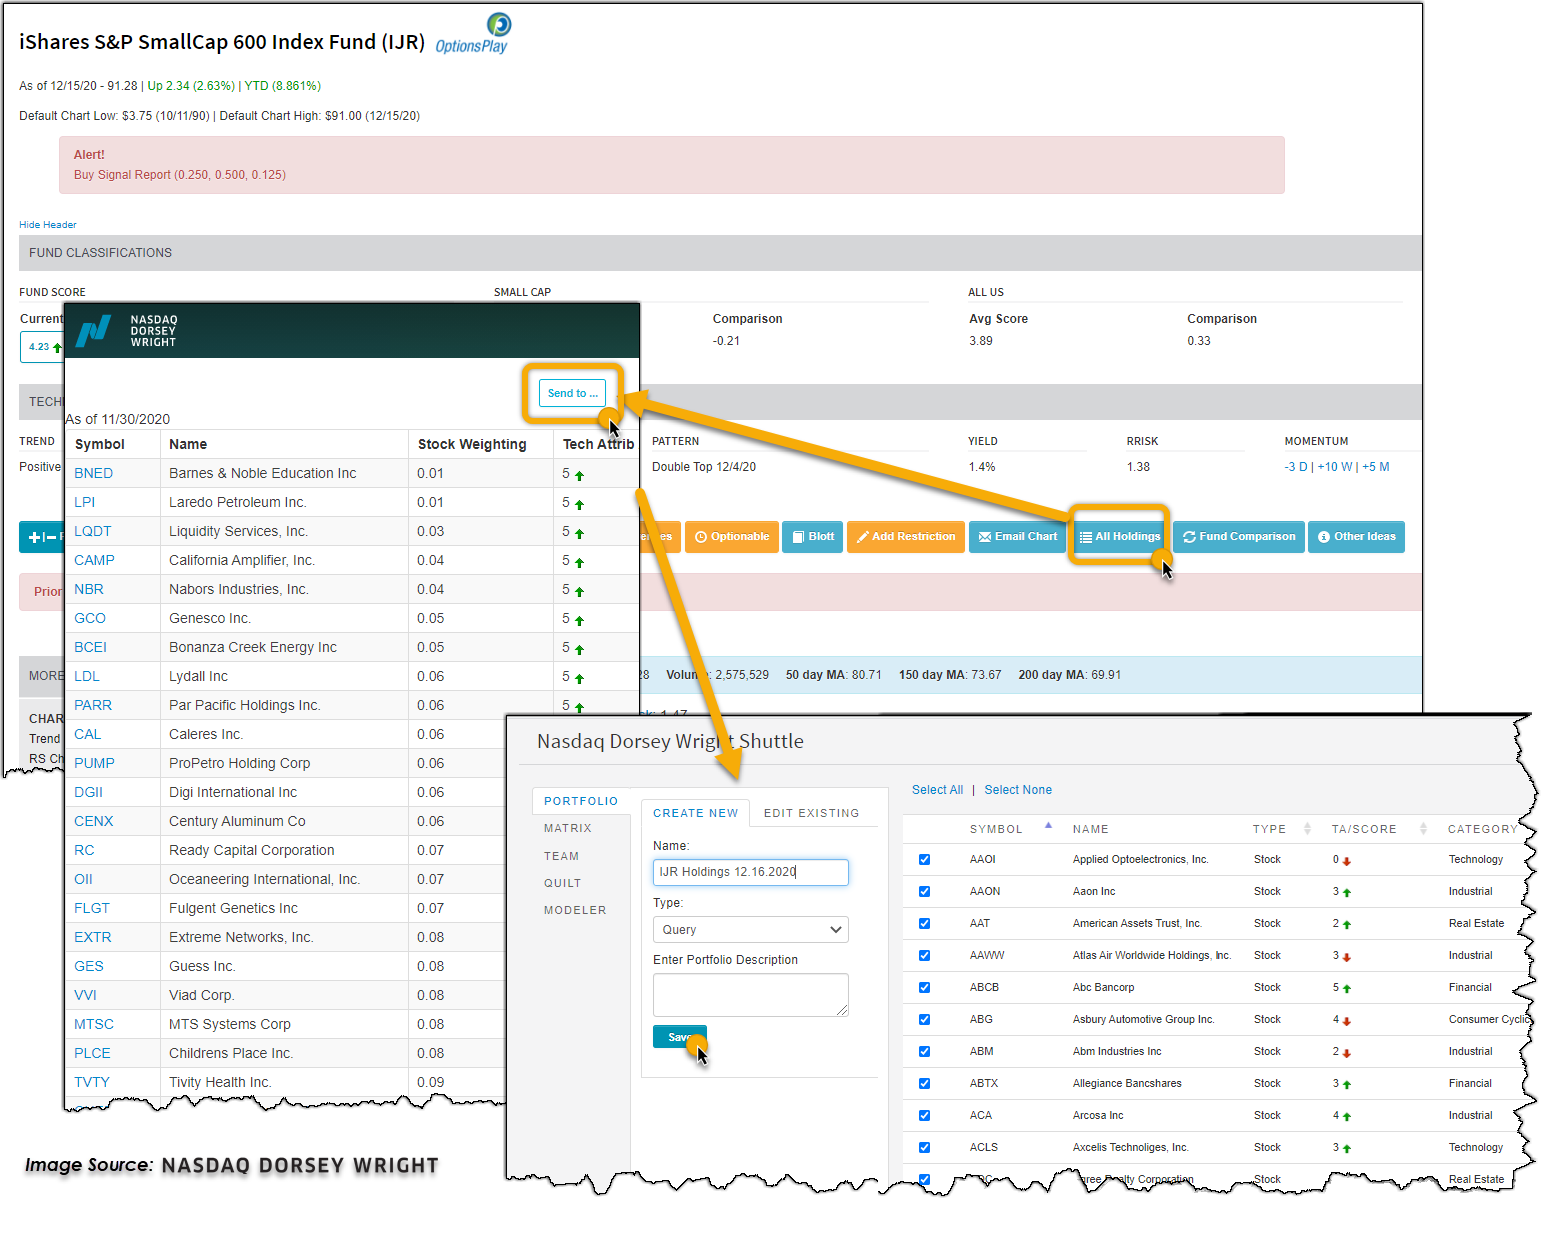
If you are looking for small-cap stock exposure via single stocks, simply click the “All Holdings” button off IJR’s trend chart. Once the current holdings are loaded in a new window, you can easily save the list to a custom portfolio by clicking the “Send to..” shuttle button. Once you click into this custom portfolio, we suggest sorting the list by technical attributes to identify the high RS names or even using the custom portfolio as the starting universe for a stock screen to generate actionable ideas.