
Most Requested Symbols

It has been almost two months since Domestic Equities moved back up to the number one position within the DALI Asset Class rankings, and interestingly enough Domestic Equities is the only asset class to have gained more buy signals since it moved to number one on August 25th.
Nordic countries have shown recent improvement and are worth monitoring as potential places to look towards for strength in international markets.
We review the mechanics of target maturity ETFs.
Today's featured stock is Broadcom (AVGO)
CDAY, TER, IBM, WEX, CLDR, WTFC, JRVR, LNT, & COP
Call: Electronic Arts (EA), Put: Tyson Foods (TSN), Covered Write: General Motors (GM)
This morning PayPal PYPL announced they would allow users to buy and sell cryptocurrency. Not only will users be able to buy and sell cryptocurrencies, but they will also be able to shop and transact with cryptocurrencies by early 2021. There are a few other mainstream fintech companies like Square Inc SQ and Robinhood Markets Inc that allow users to buy and sell cryptocurrencies, but PayPal’s foray into the space is noteworthy given its reach with its 346 million active accounts and $221 billion in payments processed in Q2 of this year (Source: Reuters). PYPL shares rose over 4% and Bitcoin futures rose over 7% on the news. PYPL is a 5 for 5’er and is one box away from reaching a new all-time chart high; earnings are expected on November 2nd. For those interested in exposure to bitcoin in an ETF wrapper, the Bitcoin Investment Trust GBTC has a 4.57 fund score and is up over 60% year-to-date (through 10/20).


Each week the analysts at DWA review and comment on all major asset classes in the global markets. Shown below is the summary or snapshot of the primary technical indicators we follow for multiple areas. Should there be changes mid-week we will certainly bring these to your attention via the report.
| Universe | BP Col & Level (actual) | BP Rev Level | PT Col & Level (actual) | PT Rev Level | HiLo Col & Level (actual) | HiLo Rev Level | 10 Week Col & Level (actual) | 10 Week Rev Level | 30 Week Col & Level (actual) | 30 Week Rev Level |
|---|---|---|---|---|---|---|---|---|---|---|
| ALL |
|
46% |
|
50% |
|
80% |
|
58% |
|
62% |
| NYSE |
|
52% |
|
56% |
|
80% |
|
58% |
|
68% |
| OTC |
|
44% |
|
40% |
|
80% |
|
60% |
|
60% |
| World |
|
42% |
|
42% |
|
|
|
54% |
|
60% |
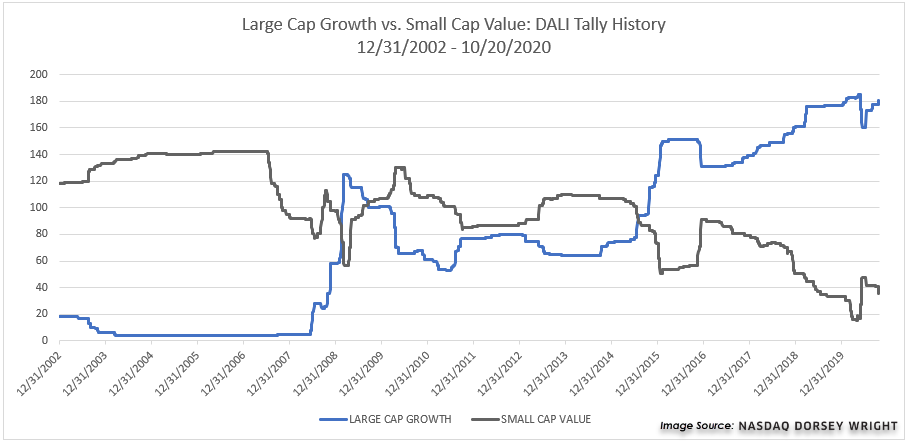
It has been almost two months since Domestic Equities moved back up to the number one position within the DALI Asset Class rankings, and interestingly enough Domestic Equities is the only asset class to have gained more buy signals since it moved to number one on August 25th. Domestic Equities has picked up 43 new buy signals while all other asset classes have seen a decline, Commodities leads the way on the downside with -22. While Small Caps have participated in the rally, especially over the past few months, we have not seen much wavering in the leadership trend of Large Cap Growth over Small Cap Value.
These two style boxes, Large Growth and Small Value, are on polar opposite ends of the spectrum as it relates to the current DALI rankings. Large Cap growth remains the highest-ranked US style box (out of nine) with a tally signal count of 181 while Small Cap Value is in last place with a count of just 36. After a bit of a recovery from Small Value in recent months, going from a low reading of 15 buy signals in April to a high of 48 by June. However, since late August when Domestic Equities took over the number one spot, Small Cap Value has lost the second most signals (6) while Large Cap Growth has gained the most signals (6). These two style boxes have been important over the year, just at different times, and those respective leadership trends have been prolonged. For instance, Large Cap Growth has been favored over Small Cap Value for more than 5 years now; however, prior to that Small Cap Value was favored for nearly six years (October 2009 to August 2015) and really Small Cap Value was favored for nearly 13 years outside of about seven months in 2009.
This is all to say that these leadership trends across Growth and Value, and specifically Large Growth and Small Value, can last for extended periods of time. Small Value began to close the gap back in the summer; however, Large Growth has recently expanded that lead back out. Both are important styles to monitor, and given the broad strength of US equities, Small Cap names have certainly participated to the upside since the market lows; however, overweighting Large Growth remains the leadership trend.

| Symbol | Name | Price | Yield | PnF Trend | RS Signal | RS Col. | Fund Score | 200 Day MA | Weekly Mom |
|---|---|---|---|---|---|---|---|---|---|
| DIA | SPDR Dow Jones Industrial Average ETF Trust | 282.95 | 2.07 | Positive | O | 4.13 | 262.74 | +1W | |
| EEM | iShares MSCI Emerging Markets ETF | 45.93 | 1.94 | Positive | Sell | O | 4.98 | 41.04 | +2W |
| EFA | iShares MSCI EAFE ETF | 64.82 | 2.52 | Positive | Sell | O | 2.76 | 61.86 | -7W |
| FM | iShares MSCI Frontier 100 ETF | 26.89 | 2.95 | Negative | Sell | O | 2.56 | 25.10 | +3W |
| IJH | iShares S&P MidCap 400 Index Fund | 197.73 | 1.61 | Positive | Buy | O | 3.26 | 180.41 | +2W |
| IJR | iShares S&P SmallCap 600 Index Fund | 75.51 | 1.57 | Positive | Buy | O | 3.03 | 69.88 | +2W |
| QQQ | Invesco QQQ Trust | 284.41 | 0.58 | Positive | Buy | X | 5.75 | 239.72 | +2W |
| RSP | Invesco S&P 500 Equal Weight ETF | 112.50 | 1.89 | Positive | Buy | X | 4.07 | 103.96 | +2W |
| SPY | SPDR S&P 500 ETF Trust | 343.38 | 1.65 | Positive | O | 4.28 | 312.00 | +1W | |
| XLG | Invesco S&P 500 Top 50 ETF | 266.08 | 1.33 | Positive | O | 5.55 | 238.08 | +1W |
Generally speaking, it was a negative week across the board for the ten major market funds covered in this report as nine finished in the red while just one fund, the iShares MSCI Frontier 100 ETF FM, managed to finish in the black with a gain of 0.56%. The Invesco QQQ Trust QQQ lagged the group with a loss of -3.43%, followed by the Invesco S&P 500 Top 50 ETF XLG, down -2.71%. On a year-to-date basis, there are now just four major market funds sitting in positive territory, including the QQQ, the XLG, the SPDR S&P 500 ETF Trust SPY, and the iShares MSCI Emerging Markets ETF EEM. Today, we'll examine the EEM's recent price action and technical health of this emerging market proxy; but first, in the table below, we've provided updated support levels for all major market funds covered in this report.
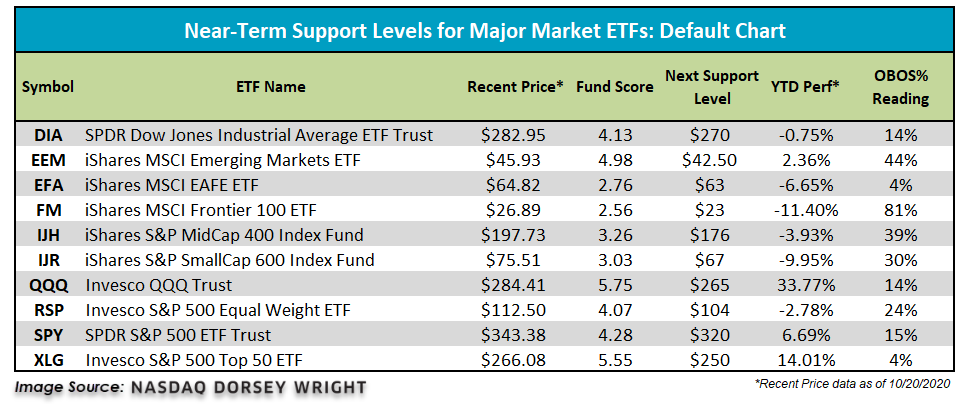
Recall that in January, EEM printed a multi-year high at $46 before moving to a sell signal in February where it broke a triple bottom at $41.50. Shares of EEM then tumbled more than 33% from its January high, moving as low as $30.50 in March following a series of five consecutive sell signals. Later, in March, EEM returned to a buy signal at $33 and gave a total of four consecutive buy signals before moving to a sell signal in September. With recent market action, EEM returned to a Point & Figure buy signal at $45.50 before moving higher to $46, where the fund is now testing its January high. From current levels, a move to $46.50 would mark a new multi-year high. EEM's positive price action since printing its March lows has caused the fund to strengthen significantly from both an absolute and relative perspective. Currently, EEM has a solid fund score of 4.98 with a strongly positive score direction of 4.27, speaking to the fund's improvement over the last six months. This current score beats the average emerging market equity fund by 0.96 score points, the average non-US fund by 1.52 score points, and the average all global and international fund by 1.47 score points. Additionally, EEM has experienced three months of positive monthly momentum and two months of positive weekly momentum, adding to the fund’s healthy technical picture. With an OBOS% reading of 43%, EEM is actionable at current levels with initial support offered at $42.50. Year-to-date, EEM is up 2.36% and is outperforming its developed market counterpart, the iShares MSCI EAFE ETF EFA, by over 9%, making emerging markets the favored international space at this time.

SECTOR BULLISH PERCENT CHANGES
| Reversed to X | Reversed to O |
|---|---|
| 2 (BPFORE | 56), (BPSTEE | 62), |
1 (BPLEIS | 54), |
| To Xs | To Os |
|---|
Average Level
54.36
| Sector |
|---|
| Oil (20%) - Bear Confirmed |
| Oil Service (18%) - Bear Confirmed |
| Sector |
|---|
| Aerospace Airline (42%) - Bear Correction |
| Banks (40%) - Bear Correction |
| Biomedics/Genetics (46%) - Bear Correction |
| Drugs (42%) - Bull Confirmed |
| Utilities / Gas (30%) - Bull Alert |
| Savings & Loans (44%) - Bull Alert |
| Waste Management (50%) - Bull Confirmed |
| Sector |
|---|
| Gaming (50%) - Bear Alert |
| Leisure (54%) - Bear Confirmed |
| Telephone (50%) - Bull Correction |
SECTOR INDICATOR CHART CHANGES
PT is the percentage of stocks within a sector that are trading above their bullish support lines. RSX is the percentage of stocks within a sector whose relative strength charts are in a column of Xs. RSP is the percentage of stocks within a sector whose relative strength charts are on a buy signal. The strongest sectors, i.e. market leaders, will have most of these indicators positive and moving higher in a column of Xs.
|
There were mostly PT charts rising this week, with 8 rising and 1 moving lower. The following sector charts rose: Autos and Parts [^PTAUTO]-Rev. , Banks [^PTBANK]-Rev. , Building [^PTBUIL], Electronics [^PTELEC], Utilities/Electricity [^PTEUTI]-Rev. , Machinery and Tools [^PTMACH]-Rev. , Metals Non Ferrous [^PTMETA], Savings & Loans [^PTSAVI]. The following sector chart fell: Oil Service [^PTOILS]. There were 4 that reversed to X. |
|
| ^PT Charts Reversing Up - | ^PT Charts Reversing Down - |
|
|
|
| ^PT Charts Moving Higher - | ^PT Charts Moving Lower - |
|
|
|
There were mostly RSX charts rising this week, with 17 rising and 1 moving lower. The following sector charts rose: Business Products [^RSXBUSI], Chemicals [^RSXCHEM]-Rev. , Drugs [^RSXDRUG], Electronics [^RSXELEC]-Rev. , Finance [^RSXFINA]-Rev. , Food Beverages/Soap [^RSXFOOD]-Rev. , Healthcare [^RSXHEAL], Household Goods [^RSXHOUS], Internet [^RSXINET], Media [^RSXMEDI]-Rev. , Protection Safety Equipment [^RSXPROT], Retailing [^RSXRETA]-Rev. , Savings & Loans [^RSXSAVI], Software [^RSXSOFT], Textiles/Apparel [^RSXTEXT]-Rev. , Transports/Non Air [^RSXTRAN], Waste Management [^RSXWAST]. The following sector chart fell: Telephone [^RSXTELE]. Retailing [^RSXRETA] was the only sector RSX chart that moved to a buy signal while none moved to a sell signal. |
|
| ^RSX Charts Reversing Up - | ^RSX Charts Reversing Down - |
|
|
|
| ^RSX Charts Moving Higher - | ^RSX Charts Moving Lower - |
|
|
|
There were equal amounts of rising and falling sector RSP charts this week, with 3 both rising and falling. The following sector charts rose: Restaurants [^RSPREST], Textiles/Apparel [^RSPTEXT], Transports/Non Air [^RSPTRAN]. The following sector charts fell: Biomedics/Genetics [^RSPBIOM], Utilities/Electricity [^RSPEUTI], Precious Metals [^RSPPREC]-Rev. . There were 1 that reversed to O. |
|
| ^RSP Charts Reversing Up - | ^RSP Charts Reversing Down - |
|
|
|
| ^RSP Charts Moving Higher - | ^RSP Charts Moving Lower - |
FAVORED SECTOR STATUS CHANGES
A sector is considered to be Favored if it has 3 or 4 of the sector indicators (Relative Strength, RSX, RSP, & PT) positive, Average if it has 2 of the 4 indicators positive, & Unfavored if it has 0 or 1 of the indicators positive. The table below contains those sectors that have experienced a Favored Sector Status change over the past week. It is best to focus on sectors that are about 50% or lower on their Bullish Percent charts & are in Xs. Note: If a sector moves from Favored to Average, it doesn't necessarily mean that the sector in question has to be sold - it just means you need to evaluate your individual positions with exposure to that sector.
| Changes since 10/14/2020 | Full Report |
|
|
|
|
||||||||||
|
|
|
|
|
|
||||||||
|
|
|
|
|
||||||||
|
|
|
|
|
|
||||||||

Broad emerging markets have continued to lead most of the relative rankings across the NDW platform as global equity markets have rallied off their COVID-19 lows, which makes sense given their outperformance compared to developed markets. The iShares MSCI Emerging Markets ETF EEM has outpaced the iShares MSCI EAFE ETF EFA over the past 30 days, with respective returns of 3.17% compared to -0.48%, bringing the emerging market fund into the black on the year with a gain of 2.36%, while EFA continues to lag with a loss of -6.65% over the same timeframe. Much of this outperformance has stemmed from the overweight of China and Taiwan within EEM, which combine to make up over 54% of the fund’s allocation. These two countries also rank highly in our country index relative strength comparison, with China ranking fifth out of the 43 countries examined and Taiwan placing a bit higher at second overall. However, the remaining nine spots in the top quartile of these rankings are developed market countries, based on the relative strength rankings through trading Monday.

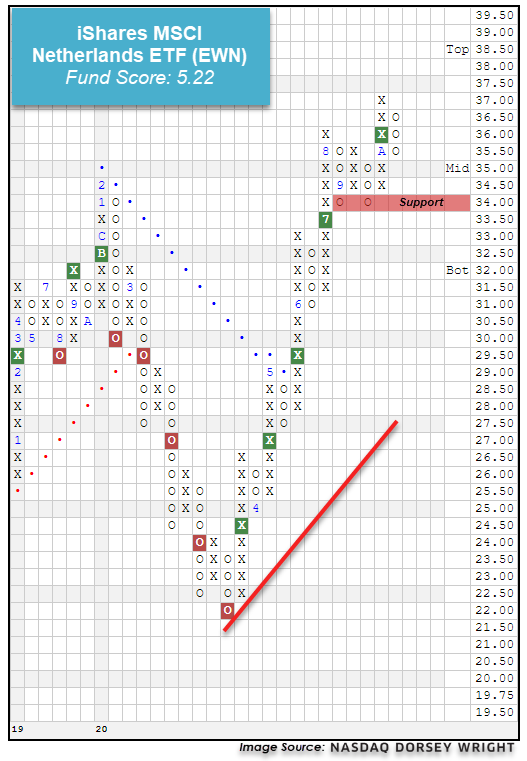
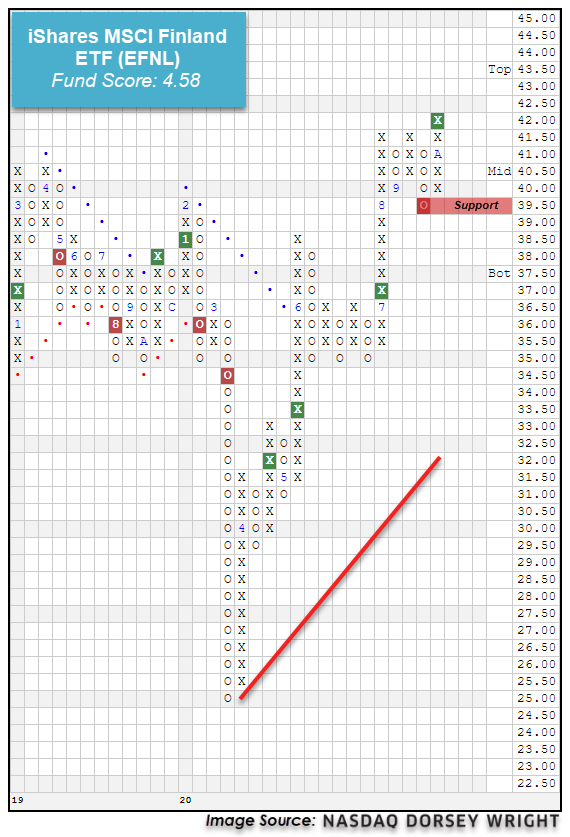
Denmark has held onto the top position in this matrix since the end of September, although we see that four other countries from the Nordic region are also found in the top quartile. This includes the Netherlands, Sweden, Finland, and Switzerland. Today, we will take a closer look at the recent movement from representative funds from some of these areas as potential places to look towards for continued strengthening in international markets.
The iShares MSCI Netherlands ETF EWN has shown significant strength over the past few months, as the fund moved to break through to a positive trend in May and give its fifth consecutive buy signal earlier this month at $36, before moving to a new all-time high at $37 last week. The 5.22 recent fund score posting of the fund bests the average non-US equity score of 3.47 as well as the average Europe fund of 2.73 and is paired with a strongly positive score direction of 3.44. Weekly momentum also recently flipped positive, which suggests the potential for further upside from here. EWN recently pulled back from its all-time high to a current chart position of $35.50 and is suitable for long-exposure consideration at this time. Initial support may be found at $34, with further support offered at $31.
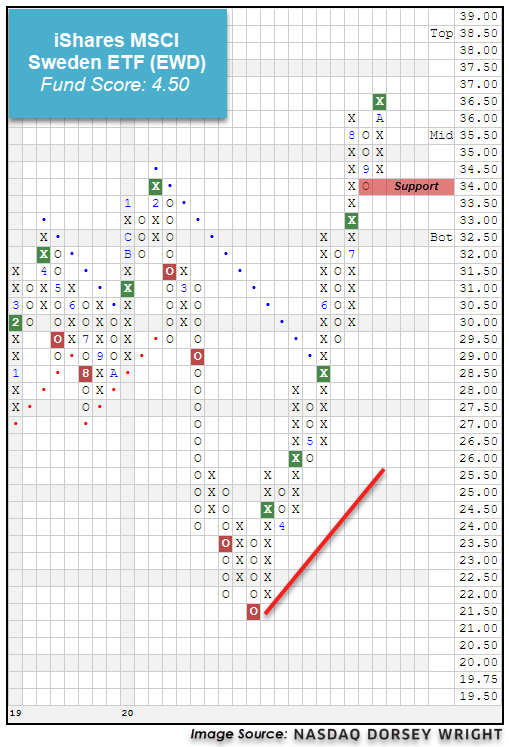
Another fund that has shown consistent strength is the iShares MSCI Sweden ETF EWD, which also gave its fifth consecutive buy signal earlier this month at $36.50, matching a multi-year high from early-2018. This fund moved back to a positive trend in May and shows a recent fund score of 4.50, which bests the average non-US fund (3.47) and average Europe fund (2.73). The recent improvement of EWD has also been displayed through the positive 2.97 score direction, and the fund still sits at a current chart level of $36.50 in the normalized trading territory. Long exposure may be considered here, with initial support offered at $34.
The final fund we will examine today is the iShares MSCI Finland ETF EFNL, which most recently completed a shakeout pattern with a triple top break at $42 to mark a new multi-year high. This fund has improved significantly off its multi-year low of $25 seen in March, moving back to a positive trend in June before rising to current levels at $42. Similar to the other Nordic representatives, EFNL possesses a favorable fund score of 4.58 and an intensely positive score direction of 3.98, indicative of the fund's drastic score improvement over the past six months. Those looking to add exposure may consider the fund at current levels, with initial support offered at $39.50. Note that EFNL also carries a yield of 3.29%.
The US Treasury 10YR Yield Index TNX gave a third consecutive buy signal in Wednesday’s trading when it broke a spread triple top at 0.80%. This is the highest level the index has reached since June when it hit 0.95%.
The US Treasury 30YR Yield Index TYX also gave a fresh buy signal on Wednesday when it broke a double top at 1.625%. Like TNX, TYX also remains below the levels it reached in June.
As discussed in last Thursday’s report, we recently added the NDW Tactical + Ladders Fixed Income Model LADDERS to our suite of guided models. The model combines the State Street Fixed Income Model SSFIXED.TR with two “ladders” composed of BulletShares target maturity ETFs, one investment-grade CORPLADDER, the other high yield HYLADDER.
Therefore, we thought today would be an opportune time to review how target maturity funds work.
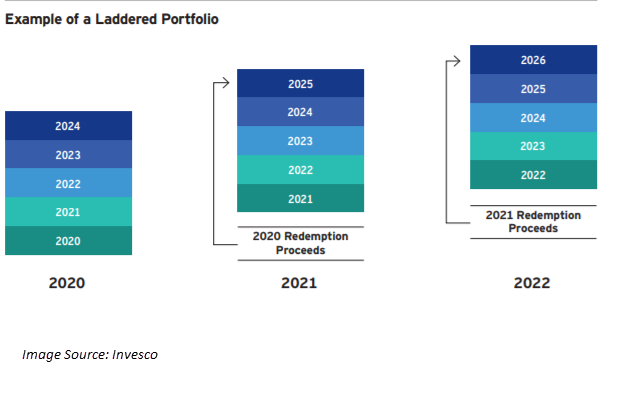
Unlike traditional fixed income ETFs, target maturity ETFs hold individual bonds that each mature or are expected to be called in the same year. As the underlying bonds mature, the cash or cash equivalent holdings of the fund increase and upon the fund reaching maturity the proceeds are distributed to shareholders. Because these funds have a target maturity, they can be used to create a held-to-maturity portfolio to protect against capital losses due to rising interest rates.
As in the LADDERS model, target maturity ETFs can also be used to create laddered portfolios. A laddered portfolio is one with allocations spread across several different maturities, e.g. 20% each to 1 to 5-year maturity bonds. A laddered portfolio provides liquidity and can help minimize interest rate risk.
Even though the underlying bonds in a target maturity ETF are expected to be held until maturity, they are exchange-traded, and therefore the market value and NAV of the fund will still be affected by interest rate movement. Therefore it is important to understand that ultimately, as the bonds near maturity, the NAV of the fund should move toward the par value of its holdings and the fund will receive par value for its bonds (excepting any potential defaults), which will, in turn, be distributed to the funds’ investors.
It is important to note that the movement of NAV towards the underlying par value does not mean that bonds purchased at a premium will result in a capital loss nor that bonds purchased at a discount will result in a capital gain. This is due to how the amortization of premiums and discounts is handled. If a fund purchases its bonds at a discount to par, the discount is amortized over time and may result in the fund distributing more income than would be expected based on the average weighted coupon. The reverse is true if bonds are purchased at a premium.
Remember, these are technical comments only. Just as you must be aware of fundamental data for the stocks we recommend based on technical criteria in the report, so too must you be aware of important data regarding delivery, market moving government releases, and other factors that may influence commodity pricing. We try to limit our technical comments to the most actively traded contracts in advance of delivery, but some contracts trade actively right up to delivery while others taper off well in advance. Be sure you check your dates before trading these contracts. For questions regarding this section or additional coverage of commodities email james.west@dorseywright.com.
Data represented in the table below is through 10/20/2020:
Broad Market Commodities Report
| Symbol | Name | Price | PnF Trend | RS Signal | RS Col. | 200 Day MA | Weekly Mom |
|---|---|---|---|---|---|---|---|
| CL/ | Crude Oil Continuous | 41.46 | Positive | Buy | O | 38.34 | +2W |
| DBLCIX | Deutsche Bank Liquid Commodities Index | 281.50 | Negative | Sell | O | 267.76 | -1W |
| DWACOMMOD | DWA Continuous Commodity Index | 534.86 | Positive | Buy | O | 468.41 | -193W |
| GC/ | Gold Continuous | 1913.70 | Negative | Buy | X | 1760.48 | -9W |
| HG/ | Copper Continuous | 3.14 | Positive | Buy | X | 2.67 | -5W |
| ZG/ | Corn (Electronic Day Session) Continuous | 409.00 | Positive | Buy | O | 347.92 | +9W |
Natural Gas continues full steam ahead, now just shy of doubling in price since its June low
Natural Gas NG/ futures have almost doubled since posting a low in June of this year around $1.45 per MMBtu (one million British thermal units). Tailwinds for the space include weather induced and economic related supply curve changes, in addition to the upcoming transition of season for many areas given the commodity’s inherent role in fueling power plants.
Pivoting to a few charts, beginning with Natural Gas Continuous (NG/) we note a series of three consecutive buy signals, with the latest propelling the commodity to match its highest chart level since February of 2019. Weekly momentum also recently flipped to positive, joining monthly momentum which has been positive for five months now. Furthermore, despite the sharp gains, NG/ remains within normalized trading levels with an Overbought/Oversold (OBOS) reading of 43%. If fortunate to pick up exposure in June one may be sitting on a gain north of 75% at the moment; however, ETFs offering exposure still possess low fund scores and remain well-below their trend lines. A few things to consider on this divergence are the possibility of negative roll yield (a topic previously explained here) or more simply which contracts the underlying ETFs hold. Also, note some ETFs, like the First Trust Natural Gas ETF FCG, actually hold exchange-listed companies that derive a substantial portion of their revenues from the exploration and production of natural gas (Source: ftportfolios.com). So like other areas of the market, knowing what you own is key along with selective exposure.

Average Level
3.82
| AGG | iShares US Core Bond ETF |
| USO | United States Oil Fund |
| DIA | SPDR Dow Jones Industrial Average ETF |
| DVY | iShares Dow Jones Select Dividend Index ETF |
| DX/Y | NYCE U.S.Dollar Index Spot |
| EFA | iShares MSCI EAFE ETF |
| FXE | Invesco CurrencyShares Euro Trust |
| GLD | SPDR Gold Trust |
| GSG | iShares S&P GSCI Commodity-Indexed Trust |
| HYG | iShares iBoxx $ High Yield Corporate Bond ETF |
| ICF | iShares Cohen & Steers Realty ETF |
| IEF | iShares Barclays 7-10 Yr. Tres. Bond ETF |
| LQD | iShares iBoxx $ Investment Grade Corp. Bond ETF |
| IJH | iShares S&P 400 MidCap Index Fund |
| ONEQ | Fidelity Nasdaq Composite Index Track |
| QQQ | Invesco QQQ Trust |
| RSP | Invesco S&P 500 Equal Weight ETF |
| IWM | iShares Russell 2000 Index ETF |
| SHY | iShares Barclays 1-3 Year Tres. Bond ETF |
| IJR | iShares S&P 600 SmallCap Index Fund |
| SPY | SPDR S&P 500 Index ETF Trust |
| TLT | iShares Barclays 20+ Year Treasury Bond ETF |
| GCC | WisdomTree Continuous Commodity Index Fund |
| VOOG | Vanguard S&P 500 Growth ETF |
| VOOV | Vanguard S&P 500 Value ETF |
| EEM | iShares MSCI Emerging Markets ETF |
| XLG | Invesco S&P 500 Top 50 ETF |
Relative strength is a measure of how a stock is performing when compared to something else, in this case the S&P 500 Equal Weighted Index (SPXEWI). Each day the stock's closing price is divided by that of the SPXEWI, the resulting numbers decimal is moved two places and then plotted on a Point & Figure chart. Whenever the relative strength chart shows a double top buy signal (e.g. RS Buy or Positive Relative Strength), it suggests the stock is likely to outperform the market for the foreseeable future. Conversely, whenever the relative strength chart gives a double bottom sell signal (e.g. RS Sell or Negative Relative Strength) it suggests the stock will under-perform the market. Relative strength signals tend to last roughly 18 to 24 months on average. Consequently, changes from buy signals to sell signals (and vice versa) are important to be aware of as they are longer-term implications of a stock's likely performance versus the indices. Using the Point & Figure chart along with the relative strength chart will allow you to better ascertain risk-reward and other trade management tools, but we always want to over-weight our portfolios toward those stocks that are on RS buy signals, giving us the best chance of outperforming the broader market.
In the Optionable Universe, this week we saw 21 relative strength buy signals compared to 20 last week. On the sell side, there were 17 relative strength sell signals compared to 14 last week.
| Symbol | Company | Sector | Price | RS vs Market Signal | RS vs Market Column | RS vs Peer Signal | RS vs Peer Column | Tech Attrib |
|---|---|---|---|---|---|---|---|---|
| BLK | BlackRock, Inc. | Financial Services | 645.070 | Buy | X | Buy | X | 5 |
| TPR | Tapestry Inc. | Retail | 20.480 | Buy | X | Sell | X | 4 |
| CTG | Computer Task Group, Incorporated | Software | 5.750 | Buy | X | Sell | X | 3 |
| ENDP | Endo International PLC | Pharmaceuticals | 5.800 | Buy | X | Buy | X | 5 |
| FLEX | Flex Ltd | Industrial Goods & Svcs | 14.490 | Buy | X | Sell | X | 4 |
| COWN | Cowen Inc. | Financial Services | 18.960 | Buy | X | Buy | X | 5 |
| CMRE | Costamare Inc. | Industrial Goods & Svcs | 7.380 | Buy | X | Buy | X | 5 |
| MDRX | Allscripts-Misys Healthcare Solutions, Inc. | Software | 10.510 | Buy | X | Sell | X | 4 |
| R | Ryder System, Inc. | Industrial Goods & Svcs | 50.310 | Buy | X | Sell | X | 4 |
| STRL | Sterling Construction Company Inc | Construction | 17.070 | Buy | X | Sell | X | 4 |
| IOVA | Iovance Biotherapeutics Inc. | Biotechnology | 37.860 | Buy | X | Sell | X | 4 |
| GKOS | Glaukos Corp. | Medical Products | 55.850 | Buy | X | Sell | X | 4 |
| AQUA | Evoqua Water Technologies Corp | Water Utilities | 23.260 | Buy | X | Buy | X | 5 |
| CAT.TR | Caterpillar Inc. TR | Industrial Goods & Svcs | 174.127 | Buy | X | Sell | X | 3 |
| ANDE.TR | The Andersons, Inc. TR | Food and Beverage | 24.110 | Buy | X | Sell | X | 4 |
| APOG.TR | Apogee Enterprises, Inc. TR | Construction | 28.014 | Buy | X | Sell | X | 3 |
| WRK.TR | WestRock Co TR | Basic Resources | 42.318 | Buy | X | Sell | X | 4 |
| LEA.TR | Lear Corporation TR | Automobiles | 134.407 | Buy | X | Buy | X | 4 |
| R.TR | Ryder System, Inc. TR | Industrial Goods & Svcs | 53.850 | Buy | X | Sell | X | 4 |
| AQUA.TR | Evoqua Water Technologies Corp (TR) | Water Utilities | 23.260 | Buy | X | Buy | X | 5 |
| AIRO | Airspan Networks Inc. | Communications Technology | 8.530 | Buy | O | N/A | O |
| Symbol | Company | Sector | Price | RS vs Market Signal | RS vs Market Column | RS vs Peer Signal | RS vs Peer Column | Tech Attrib |
|---|---|---|---|---|---|---|---|---|
| CGEN | Compugen LTD. (Israel) ADR | Biotechnology | 14.670 | Sell | O | Buy | O | 2 |
| CHCO | City Holding | Financial Services | 59.000 | Sell | O | Buy | O | 1 |
| CNSL | Consolidated Communications Holding, Inc | Fixed Line Communications | 5.200 | Sell | O | Buy | O | 1 |
| GNMK | Genmark Diagnostics Inc | Medical Products | 11.410 | Sell | O | Sell | O | 1 |
| MLR | Miller Industries Inc TN | Industrial Goods & Svcs | 29.150 | Sell | O | Buy | O | 2 |
| PSB | PS Business Parks, Inc. | Equity REITs | 115.590 | Sell | O | Buy | O | 1 |
| PBYI | Puma Biotechnology Inc | Biotechnology | 9.450 | Sell | O | Sell | O | 0 |
| VRTX | Vertex Pharmaceuticals Incorporated | Biotechnology | 214.540 | Sell | O | Buy | O | 1 |
| WIFI | Boingo Wireless Inc | Technology Services | 9.460 | Sell | O | Sell | O | 0 |
| OUT | Outfront Media Inc. | Media | 13.800 | Sell | O | Buy | O | 1 |
| BCLI | Brainstorm Cell Therapeutics | Biotechnology | 10.150 | Sell | O | Sell | O | 0 |
| ADAP | Adaptimmune Therapeutics PLC | Healthcare | 5.390 | Sell | O | Sell | O | 0 |
| CLDR | Cloudera, Inc. | Software | 10.310 | Sell | O | Buy | O | 2 |
| MESO | Mesoblast Limited Sponsored ADR | Biotechnology | 11.870 | Sell | O | Sell | O | 0 |
| CME.TR | CME Group, Inc. TR | Financial Services | 168.571 | Sell | O | Buy | O | 1 |
| ADC.TR | Agree Realty Corporation TR | Equity REITs | 66.944 | Sell | O | Buy | O | 1 |
| WRI.TR | Weingarten Realty Investors TR | Equity REITs | 16.619 | Sell | O | Sell | O | 0 |
| Symbol | Company | Sector | Current Price | Action Price | Target | Stop | Notes |
|---|---|---|---|---|---|---|---|
| CHRW | C.H. Robinson Worldwide, Inc. | Transports/Non Air | $100.51 | hi 90s - low 100s | 146 | 82 | 4 for 5'er, #6 of 43 names in TRAN sector matrix, one box from mkt RS buy signal, spread triple top, 2% yield Earnings 10/27 |
| BLDR | Builders FirstSource, Inc. | Building | $33.66 | low-to-mid 30s | 54.50 | 27 | 5 for 5'er, #4 of 74 in BUIL sector matrix, multiple buy signals, R-R>3.0, pot. covered write. Earn. 10/29 |
| SWKS | Skyworks Solutions, Inc. | Semiconductors | $152.45 | low 140s to low 160s | 196 | 122 | 4 for 5'er, pullback from ATH, top 25% of DWASEMI, pos weekly momentum flip, Earnings 11/2 |
| VEEV | Veeva Systems Inc. | Software | $303.65 | 270s to 300s | 328 | 232 | 5 for 5'er, pullback from AT high, consec buy signals, long-term market RS buy signal, top 25% DWASOFT |
| ARNC | Arconic Corp. | Metals Non Ferrous | $23.76 | low 20s | 29.50 | 18 | 5 for 5'er, #2 of 14 in favored META sector matrix, triple top breakout, pot. covered write |
| BJ | BJ's Wholesale Club Holdings Inc | Retailing | $41.33 | low to mid 40s | 52 | 32 | 4 for 5'er, favored retailing sector, consec buy signals, pullback from ATH |
| PVH | Phillips-Van Heusen Corporation | Textiles/Apparel | $61.59 | low 60s to low 70s | $87 | $49 | 5 for 5'er, top 1/3 of DWATEXT, pos month mom flip |
| LOW | Lowe's Companies, Inc. | Building | $177.09 | 170s to low 180s | 230 | 150 | 5 for 5'er, top half of favored BUI sector matrix, quad top breakout, pos wkly mom flip, LT pos mkt RS, 1.4% yield Earnings 11/18 |
| CDNS | Cadence Design Systems, Inc. | Software | $112.61 | upper $110s to low $120s | $159 | $90 | 5 for 5'er, pullback from all-time high, LT market RS buy signal, pos weekly momentum |
| AVGO | Broadcom Ltd | Semiconductors | $376.99 | 360s - 380s | 468 | 300 | 4 for 5'er, top 20% of SEMI sector matrix, triple top breakout, 3.5% yield |
| Symbol | Company | Sector | Current Price | Action Price | Target | Stop | Notes |
|---|
| Symbol | Company | Sector | Current Price | Action Price | Target | Stop | Notes |
|---|---|---|---|---|---|---|---|
| LEN | Lennar Corporation | Building | $83.29 | low to mid 80s | 94 | 67 | LEN fell to a sell signal in Wednesday's trading. OK to hold here. Maintain $67 stop. |
| Comment |
|---|
| FIZZ National Beverage Corporation R ($86.68) - Food Beverages/Soap - We will now raise our stop to $75, the second potential sell signal on FIZZ's $0.50 chart. |
| ABG Asbury Automotive Group Inc. R ($121.20) - Retailing - We will now raise our stop to $108, the second potential sell signal on ABG's default chart. |
| TNDM Tandem Diabetes Care Inc R ($110.99) - Healthcare - We will now raise our stop to $100, the potential trend line violation on TNDM's default chart. |
| AAWW Atlas Air Worldwide Holdings, Inc. R ($64.16) - Aerospace Airline - We will now raise our stop to $57, the third potential sell signal on AAWW's default chart. |
AVGO Broadcom Ltd R ($373.65) - Semiconductors - AVGO is a 4 for 5'er that ranks in the top quintile of the semiconductors sector matrix and has been on a market RS buy signal since 2010. After falling to a sell signal in September, AVGO rallied and broke a triple top in trading earlier this month, subsequently reaching a new all-time high. The stock pulled back slightly this week, offering an entry point for long exposure. AVGO also offers a 3.5% yield. Exposure may be added in the $360s - $380s and we will set out initial stop at $300, a potential spread triple bottom break on AVGO's default chart. We will us the bullish price objective, $468, as our target price.
| 20 | ||||||||||||||||||||||||||||||||||||||||||||||||||||||
| 384.00 | X | 384.00 | ||||||||||||||||||||||||||||||||||||||||||||||||||||
| 380.00 | X | o | 380.00 | |||||||||||||||||||||||||||||||||||||||||||||||||||
| 376.00 | X | X | o | 376.00 | ||||||||||||||||||||||||||||||||||||||||||||||||||
| 372.00 | X | O | X | X | A | o | 372.00 | |||||||||||||||||||||||||||||||||||||||||||||||
| 368.00 | X | O | X | O | X | O | X | 368.00 | ||||||||||||||||||||||||||||||||||||||||||||||
| 364.00 | X | O | X | O | X | O | X | 364.00 | ||||||||||||||||||||||||||||||||||||||||||||||
| 360.00 | X | O | X | O | X | O | X | 360.00 | ||||||||||||||||||||||||||||||||||||||||||||||
| 356.00 | X | O | X | O | X | O | X | 356.00 | ||||||||||||||||||||||||||||||||||||||||||||||
| 352.00 | 9 | O | O | O | X | Mid | 352.00 | |||||||||||||||||||||||||||||||||||||||||||||||
| 348.00 | X | O | X | 348.00 | ||||||||||||||||||||||||||||||||||||||||||||||||||
| 344.00 | X | O | 344.00 | |||||||||||||||||||||||||||||||||||||||||||||||||||
| 340.00 | X | 340.00 | ||||||||||||||||||||||||||||||||||||||||||||||||||||
| 336.00 | X | 336.00 | ||||||||||||||||||||||||||||||||||||||||||||||||||||
| 332.00 | • | X | 332.00 | |||||||||||||||||||||||||||||||||||||||||||||||||||
| 328.00 | X | X | X | • | • | • | X | X | 328.00 | |||||||||||||||||||||||||||||||||||||||||||||
| 324.00 | X | X | O | X | O | X | O | X | • | X | • | X | O | X | X | 324.00 | ||||||||||||||||||||||||||||||||||||||
| 320.00 | X | O | X | O | X | O | X | O | X | O | X | O | • | X | O | 7 | O | 8 | 320.00 | |||||||||||||||||||||||||||||||||||
| 316.00 | X | O | X | O | X | O | X | O | X | O | 2 | O | • | X | O | X | X | X | O | X | 316.00 | |||||||||||||||||||||||||||||||||
| 312.00 | X | O | X | O | 1 | X | O | O | X | O | • | X | O | X | O | X | O | X | O | X | Bot | 312.00 | ||||||||||||||||||||||||||||||||
| 308.00 | X | C | X | O | X | O | X | O | • | X | O | X | O | X | O | X | O | 308.00 | ||||||||||||||||||||||||||||||||||||
| 304.00 | • | X | O | O | X | O | • | O | • | X | O | X | O | O | 304.00 | |||||||||||||||||||||||||||||||||||||||
| 300.00 | X | • | X | O | • | • | O | • | X | O | X | 300.00 | ||||||||||||||||||||||||||||||||||||||||||
| 296.00 | X | O | B | • | O | • | 6 | O | 296.00 | |||||||||||||||||||||||||||||||||||||||||||||
| 292.00 | X | O | X | • | O | • | X | 292.00 | ||||||||||||||||||||||||||||||||||||||||||||||
| 288.00 | • | X | O | X | • | O | X | • | X | 288.00 | ||||||||||||||||||||||||||||||||||||||||||||
| 284.00 | X | • | X | O | X | • | O | X | O | • | X | 284.00 | ||||||||||||||||||||||||||||||||||||||||||
| 280.00 | X | O | X | O | X | • | O | X | O | • | X | 280.00 | ||||||||||||||||||||||||||||||||||||||||||
| 276.00 | X | O | X | O | X | • | O | 3 | O | • | X | X | X | 276.00 | ||||||||||||||||||||||||||||||||||||||||
| 272.00 | • | 9 | • | O | X | • | O | X | O | • | X | O | X | O | X | 272.00 | ||||||||||||||||||||||||||||||||||||||
| 268.00 | • | A | • | O | X | O | • | X | X | O | X | O | X | 268.00 | ||||||||||||||||||||||||||||||||||||||||
| 264.00 | • | O | O | X | X | O | X | 5 | X | O | X | 264.00 | ||||||||||||||||||||||||||||||||||||||||||
| 260.00 | O | X | O | X | O | X | O | X | O | X | 260.00 | |||||||||||||||||||||||||||||||||||||||||||
| 256.00 | O | X | X | O | X | O | X | O | O | 256.00 | ||||||||||||||||||||||||||||||||||||||||||||
| 252.00 | O | X | O | X | X | O | O | X | 252.00 | |||||||||||||||||||||||||||||||||||||||||||||
| 248.00 | O | X | O | X | O | X | O | 248.00 | ||||||||||||||||||||||||||||||||||||||||||||||
| 244.00 | O | O | X | X | O | X | 244.00 | |||||||||||||||||||||||||||||||||||||||||||||||
| 240.00 | O | X | O | X | 4 | X | 240.00 | |||||||||||||||||||||||||||||||||||||||||||||||
| 236.00 | O | X | O | X | O | X | 236.00 | |||||||||||||||||||||||||||||||||||||||||||||||
| 232.00 | O | X | O | O | X | 232.00 | ||||||||||||||||||||||||||||||||||||||||||||||||
| 228.00 | O | X | O | X | 228.00 | |||||||||||||||||||||||||||||||||||||||||||||||||
| 224.00 | O | X | O | X | • | 224.00 | ||||||||||||||||||||||||||||||||||||||||||||||||
| 220.00 | O | X | O | • | 220.00 | |||||||||||||||||||||||||||||||||||||||||||||||||
| 216.00 | O | X | • | 216.00 | ||||||||||||||||||||||||||||||||||||||||||||||||||
| 212.00 | O | X | • | 212.00 | ||||||||||||||||||||||||||||||||||||||||||||||||||
| 208.00 | O | X | X | • | 208.00 | |||||||||||||||||||||||||||||||||||||||||||||||||
| 204.00 | O | X | O | X | • | 204.00 | ||||||||||||||||||||||||||||||||||||||||||||||||
| 200.00 | O | X | X | O | X | • | 200.00 | |||||||||||||||||||||||||||||||||||||||||||||||
| 198.00 | O | X | O | X | O | X | • | 198.00 | ||||||||||||||||||||||||||||||||||||||||||||||
| 196.00 | O | X | O | X | O | X | • | 196.00 | ||||||||||||||||||||||||||||||||||||||||||||||
| 194.00 | O | X | O | X | O | X | • | 194.00 | ||||||||||||||||||||||||||||||||||||||||||||||
| 192.00 | O | X | O | X | O | X | • | 192.00 | ||||||||||||||||||||||||||||||||||||||||||||||
| 190.00 | O | X | O | X | O | X | • | 190.00 | ||||||||||||||||||||||||||||||||||||||||||||||
| 188.00 | O | X | O | X | O | X | • | 188.00 | ||||||||||||||||||||||||||||||||||||||||||||||
| 186.00 | O | X | O | X | O | X | • | 186.00 | ||||||||||||||||||||||||||||||||||||||||||||||
| 184.00 | O | X | O | X | O | X | • | 184.00 | ||||||||||||||||||||||||||||||||||||||||||||||
| 182.00 | O | O | X | O | X | • | 182.00 | |||||||||||||||||||||||||||||||||||||||||||||||
| 180.00 | O | X | O | X | • | 180.00 | ||||||||||||||||||||||||||||||||||||||||||||||||
| 178.00 | O | X | O | • | 178.00 | |||||||||||||||||||||||||||||||||||||||||||||||||
| 176.00 | O | X | • | 176.00 | ||||||||||||||||||||||||||||||||||||||||||||||||||
| 174.00 | O | X | • | 174.00 | ||||||||||||||||||||||||||||||||||||||||||||||||||
| 172.00 | O | X | • | 172.00 | ||||||||||||||||||||||||||||||||||||||||||||||||||
| 170.00 | O | X | • | 170.00 | ||||||||||||||||||||||||||||||||||||||||||||||||||
| 168.00 | O | X | • | 168.00 | ||||||||||||||||||||||||||||||||||||||||||||||||||
| 166.00 | O | X | • | 166.00 | ||||||||||||||||||||||||||||||||||||||||||||||||||
| 164.00 | O | X | • | 164.00 | ||||||||||||||||||||||||||||||||||||||||||||||||||
| 162.00 | O | X | • | 162.00 | ||||||||||||||||||||||||||||||||||||||||||||||||||
| 160.00 | O | X | • | 160.00 | ||||||||||||||||||||||||||||||||||||||||||||||||||
| 158.00 | O | X | • | 158.00 | ||||||||||||||||||||||||||||||||||||||||||||||||||
| 156.00 | O | • | 156.00 | |||||||||||||||||||||||||||||||||||||||||||||||||||
| 20 |
| CDAY Ceridian HCM Holding, Inc. ($89.86) - Software - CDAY moved higher Wednesday to break a double top at $92, marking a third consecutive buy signal and a new all-time high. This 4 for 5'er moved to a positive trend in April and ranks in the top half of the software sector RS matrix. Weekly and monthly momentum are also each positive, and the stock has been on an RS buy signal against the market since late-2018. Exposure may be considered at current levels, with initial support offered at $88 and further support potentially found at $85. Earnings are expected on 11/9. |
| CLDR Cloudera, Inc. ($10.10) - Software - CLDR continued lower Wednesday to break a double bottom at $10, marking its second consecutive sell signal. This 2 for 5'er moved to an RS sell signal against the market earlier this month and ranks in the bottom quintile of the software sector RS matrix. Long exposure should be avoided here, while those looking for short ideas should note that the stock is currently at support from June, with the bullish support line currently positioned at $9.50. Initial overhead resistance may be found at $12. |
| COP ConocoPhillips ($30.64) - Oil - COP gave a sixth consecutive buy signal on Wednesday when it broke a double bottom at $31. While COP ranks in the top half of the oil sector matrix, the sector as a whole is weak and COP is a 2 for 5'er that has been in a negative trend since June. Long exposure is not recommended. While potential short sellers should note that COP carries a yield north of 5%. Earnings are expected on 10/29. |
| FCX Freeport-McMoRan Inc. ($17.72) - Metals Non Ferrous - FCX gave a third consecutive buy signal when it broke a double top at $18 in Wednesday's trading. The technical picture for FCX is positive as it is a 5 for 5'er and ranks third out of 14 names in the metals non-ferrous sector matrix. However, those interested in adding exposure should be aware that today's move puts FCX on the verge of heavily-overbought territory. Earnings are expected on 10/22. |
| IBM International Business Machines Corp. ($115.72) - Computers - Shares of IBM continued lower Wednesday after releasing earnings earlier this week to break a double bottom at $116, which also violated the bullish support line to place the stock back in an overall negative trend. This demotes IBM to a 0 for 5'er that has been on an RS sell signal against the market since 2013. Weekly momentum recently flipped negative as well, suggesting the potential for further downside from here. Long exposure should be avoided at this time, while short seekers should note that the stock carries a 5.12% yield and sits at support from June. Further support may be found at $112, with the potential for overhead resistance coming initially at $134. |
| JRVR James River Group Holdings ($52.71) - Insurance - JRVR shares moved higher today to break a double top at $52 to return to a buy signal and now sits one box away from reaching a new all-time high. This 4 for 5'er has been in a positive trend since May and in a column of Xs on its RS chart versus the market since June. JRVR is actionable at current levels with a weekly overbought/oversold reading of 47%. From here, support can be found at $42. Note that earnings are expected on 10/28 and JRVR offers a 2.39% yield. |
| LNT Alliant Energy Corporation ($55.64) - Utilities/Electricity - LNT broke a double top at $56 on Wednesday, marking the stock’s third consecutive buy signal. LNT is a 4 for 5’er within the utilities/electricity sector that has maintained a market RS buy signal since February 2016. Additionally, weekly momentum has been positive for two weeks, suggesting the potential for higher prices. From here, support sits at $49. LNT expects earnings on 11/4 and offers investors a yield of 2.78%. |
| TER Teradyne, Inc. ($92.44) - Semiconductors - TER continued higher Wednesday after their earnings release to break a double top at $89 before matching its multi-year high at $93 intraday. This 4 for 5'er moved to a positive trend earlier this month and ranks in the top half of the semiconductors sector RS matrix. Weekly momentum also recently flipped positive, suggesting the potential for further price appreciation from here. The overall weight of the evidence is positive here and improving. Long exposure may be considered at current levels, with initial support offered at $85. |
| WEX WEX Inc. ($144.19) - Business Products - Shares of WEX fell Wednesday to break a double bottom at $144. This 1 for 5'er moved to an RS sell signal against the market in mid-March and ranks in the bottom half of the business products sector RS matrix. The overall technical picture is weak here. Further support can be found at $142, the current location of the bullish support line, and from $138-136. Initial overhead resistance may come at $152. Earnings are expected on 10/29. |
| WTFC Wintrust Financial Corporation ($50.34) - Banks - WTFC shares moved higher today to break a double top at $50 to mark its second consecutive buy signal. This 4 for 5'er recently entered a positive trend earlier this month and has been on an RS buy signal versus the market since April. WTFC is actionable at current levels with a weekly overbought/oversold reading of 46%. From here, support can be found at $46. WTFC offers a yield of 2.36%. |
| Name | Option Symbol | Action | Stop Loss |
|---|---|---|---|
| Electronic Arts Inc. - $127.65 | EA2115A120 | Buy the January 120.00 calls at 13.85 | 122.00 |
| Name | Option | Action |
|---|---|---|
| Astrazeneca Group PLC Ads (United Kingdom) ADR ( AZN) | Jan. 55.00 Calls | Stopped at 51.00 (CP: 51.81) |
| D.R. Horton, Inc. ( DHI) | Feb. 70.00 Calls | Stopped at 74.00 (CP: 73.82) |
| Name | Option Symbol | Action | Stop Loss |
|---|---|---|---|
| Tyson Foods, Inc. - $59.17 | TSN2115M65 | Buy the January 65.00 puts at 8.45 | 62.00 |
| Name | Option | Action |
|---|---|---|
|
|
||
| Name | Option Sym. | Call to Sell | Call Price | Investment for 500 Shares | Annual Called Rtn. | Annual Static Rtn. | Downside Protection |
|---|---|---|---|---|---|---|---|
| General Motors $35.60 | GM2115A37 | Jan. 37.00 | 2.64 | $16,757.05 | 39.62% | 28.57% | 6.31% |
| Name | Action |
|---|---|
| Dynatrace, Inc. (DT) - 43.16 | Sell the December 45.00 Calls. |
| The Chemours Company (CC) - 22.59 | Sell the January 23.00 Calls. |
| Synchrony Financial (SYF) - 27.61 | Sell the January 28.00 Calls. |
| Twitter, Inc (TWTR) - 46.35 | Sell the January 47.00 Calls. |
| L Brands Inc. (LB) - 33.06 | Sell the January 35.00 Calls. |
| Builders FirstSource, Inc. (BLDR) - 33.67 | Sell the January 34.00 Calls. |
| Dow, Inc. (DOW) - 49.34 | Sell the January 50.00 Calls. |
| Williams Companies Inc. (WMB) - 19.69 | Sell the January 20.00 Calls. |
| Phillips-Van Heusen Corporation (PVH) - 61.59 | Sell the January 65.00 Calls. |
| Fifth Third Bancorp (FITB) - 23.75 | Sell the February 24.00 Calls. |
| LyondellBasell Industries NV (LYB) - 77.83 | Sell the January 80.00 Calls. |
| Name | Covered Write |
|---|---|
| D.R. Horton, Inc. ( DHI - 76.52 ) | January 80.00 covered write. |
Daily Equity & Market Analysis
Loading, Please Wait...
