
We are excited to announce a new addition to our lineup of guided of models, the NDW Tactical + Ladders Fixed Income Model (LADDERS).
We are excited to announce a new addition to our lineup of guided models, the NDW Tactical + Ladders Fixed Income Model LADDERS. The LADDERS model combines the State Street Fixed Income Model SSFIXED.TR with two “ladders” composed of BulletShares target maturity ETFs, one investment-grade CORPLADDER, the other high yield HYLADDER. The model weighting is 30% SSFIXED.TR, 30% HYLADDER, 40% CORPLADDER.
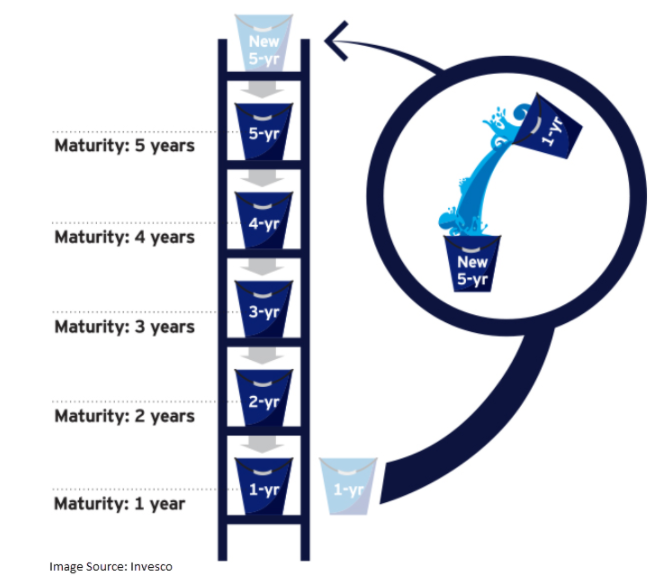
The ladders’ role in the portfolio is to provide stability and a steady stream of income. The target maturity funds that make up the ladders hold individual bonds that each mature or are expected to be called in the same year. Each ladder has five equally weighted “rungs,” i.e. holds five ETFs with target maturities from one to five years. The ETFs in the ladders are held until maturity at which point the proceeds from the maturing fund are reinvested out to the furthest rung on the ladder. The model is rebalanced once per year when the current year’s BulletShares funds mature. Because one-fifth of each ladder matures every year they produce a series of known cash flows, which can be a useful tool for investors, like retirees, that need to make regular withdrawals from their portfolio. Target maturity funds also protect against capital losses due to rising interest rates. As long as the ETFs are held to maturity, investors receive their share of the par value of the underlying bonds (after fees and expenses and excepting for any defaults). The ladder structure also has the effect of increasing the yield of the portfolio over time. All else being equal, five-year bonds have a higher yield than one-year bonds and after five years, the entire portfolio will be made up of bonds that were purchased when they had five years until maturity. Therefore, assuming rates remain constant, the yield of the “seasoned” portfolio should be higher than it was at inception. The individual funds within each ladder are not rebalanced as the goal is to hold them to maturity thereby mitigating the interest rate risk of the portfolio.
The role of the State Street Fixed Income Model is generating alpha. SSFIXED has an inventory of over 20 ETFs covering virtually every area of the fixed income market from convertible bonds to emerging market bonds to long-term Treasuries. The model utilizes a relative strength matrix to evaluate the inventory, identify areas or strength, and avoid areas of weakness in the market. Because of its highly differentiated inventory and tactical nature SSFIXED’s yield can vary greatly depending on which funds are in the model portfolio at any given and can exhibit higher volatility than more vanilla fixed income portfolios, which can be problematic for some investors. However, by combining SSFIXED with the laddered portfolios we can achieve a relatively consistent yield and dampen the overall portfolio volatility while retaining the opportunity for outperformance via SSFIXED’s tactical rotation.

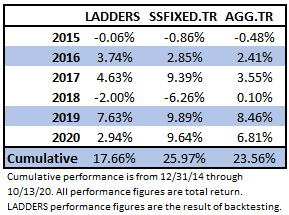
Over the trailing three years (which includes backtested history for the LADDERS model) SSFIXED has had a standard deviation of 6.17%, while LADDERS had a standard deviation of 4.43%. Below is the annual total return performance for the LADDERS model (backtested), SSFIXED, and the iShares US Core Bond ETF AGG.TR. LADDERS has underperformed SSFIXED on a cumulative basis, which is in-line with what we would expect to see. However, in its worst year (2018), LADDERS was down -2.0%, while SSFIXED was down more than 6%. Since 2015, LADDERS has also underperformed AGG. This is at least partially because we have been in a falling interest rate for most of the last five years, which benefits funds with a relatively long duration like AGG. We can also see that year-to-date LADDERS has trailed both SSFIXED and AGG, this is partially due to the model’s high yield component. High yield spreads widened dramatically during the volatility in Q1, and while they have narrowed considerably, they remain elevated relative to 2019 levels. Even though the underlying bonds in the high yield funds are expected to be held to maturity, they are exchange-traded, and therefore the market value and NAV of the funds are still affected by changes in interest rates/credit spreads. However, ultimately, as the bonds near maturity, any price impairment due to wider credit spreads should disappear, the NAV of the funds will move toward the par value of their holdings and, excepting for any defaults, the fund will receive and distribute par value for its bonds.
As mentioned above, the LADDERS model is made up of SSFIXED, CORPLADDER, and HYLADDER, in a 30-40-30 allocation. However, this may not be the optimal weighting scheme for everyone. If you want to combine in them in different weights, leave out a piece, or even use a different tactical fixed income model, you can, using the underlying model symbols.
