
Silver, Crude Oil, and Gold have all seen increased demand and rising prices.
There were a couple of notable breakouts amongst commodities on Tuesday, furthering the recent uptrend for several assets in the space. There are multiple possible factors that could be contributing to this trend – low treasury yields making other stores of wealth more attractive, concerns about heightened inflation resulting from monetary and fiscal stimulus, or desire for diversification. Whatever the cause, the result has been increased demand and rising prices.
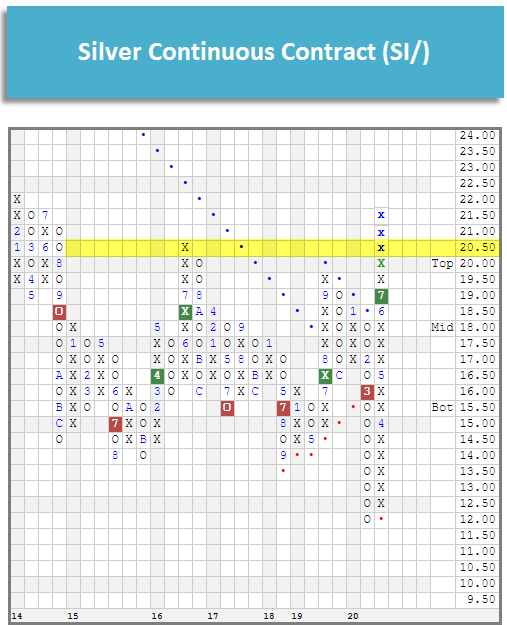
Silver
Silver SI/ reached a new multi-year high on Tuesday when it eclipsed its 2016 peak and advanced to $21.50, a level last reached in 2014. SI/ bottomed at $12 on March 24th before rallying sharply. Since that point (through 7/20), silver has gained 42.35% and returned to a positive trend in trading earlier this month. Recent flips to positive weekly and monthly momentum are additional positive signs for silver. ETFs offer us a way to can direct exposure to silver via the iShares Silver Trust SLV or indirectly via the Global X Silver Miners ETF SIL, which holds the stocks of companies engaged in silver mining.
The improvement from silver has also been displayed across funds that track the commodity, such as the iShares Silver Trust SLV. This fund is meant to provide a cost-effective way to invest in physical silver through exposure to the daily price movement in silver bullion (source: ishares.com). SLV has rallied significantly since reaching its lowest level in over a decade this past March at $11, climbing to break through its bearish resistance line while giving two consecutive buy signals, most recently occurring at $17.25 just last week. The fund has continued to move higher over the past week, culminating with an intraday gain in excess of 5% on Tuesday that takes the default chart to a new multi-year high of $19.25, its highest level since early-2014. This strength has also been displayed in the 5.61 fund score posting of SLV, which bests the average precious metals fund of 4.65 and is paired with a positive score direction of 3.59. Weekly and monthly momentum recently flipped positive, suggesting the potential for further upside from here. Those looking to add exposure towards SLV may look to wait for a pullback or normalization of the trading band, as the recent price improvement has left the fund in heavily overbought territory. Initial support is offered on the default chart at $16.

Another way to play the silver commodity is through investment in a fund of silver miners, such as the Global X Silver Miners ETF SIL. This fund has seen similar action to SLV in its descent from a February high of $33.50 to a multi-year low of $16 in March. Since that time, however, SIL has shown drastic improvement, rising to recently give three consecutive buy signals since mid-June before reaching $43 on Monday. This has led the fund to a remarkable year-to-date return of over 30% through July 20th, surpassing the 13.6% return of SI/ over the same timeframe. In a similar fashion to the silver commodity, SIL continued to move higher in trading Tuesday, notching an intraday gain of over 3.50% to print a new multi-year chart high of $45.50. The near-perfect 5.91 recent fund score posting of SIL (through 7/20) speaks to the technical strength of the fund, which is furthered by an intensely positive score direction of 5.41. Weekly momentum also recently flipped positive for SIL, indicating the potential for further price appreciation from here. While the weight of the evidence for SIL is positive, the fund has moved into heavily overbought territory so those looking to add exposure would be best served to wait for a pullback/normalization of the trading band. Initial support can be found at $38 with further support offered at $34.50, $33, and $32.
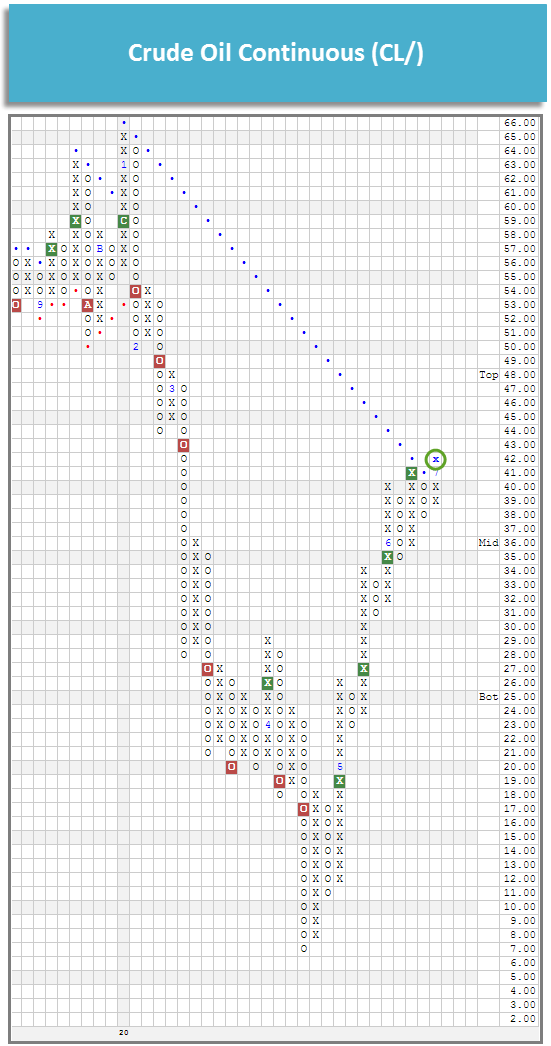
Crude Oil
Crude oil CL/ reached $42 in Tuesday’s trading, returning it to a positive overall trend for the first time since January. Saying that 2020 has been a volatile year for oil would be an understatement as it reached an all-time low and the front-month WTI crude contract actually fell below $0. With Tuesday’s action, CL/ has now given five consecutive buy signals since bottoming in April.
While the United States Oil Fund USO remains in a negative overall trend and has an unfavorable 1.70 fund score, it does have a positive 1.67 fund score direction, speaking to its improvement over the recent term. Since the bottom in April, the fund has gone from $17 to $30 on its default chart and given three consecutive buy signals in the process, most recently completing a triple top break at $29.50 in last week’s trading. USO has most recently found support at $27, with further support afforded at $25.50 and $24.50.
USO’s target portfolio can be seen below. As you can see the target portfolio currently does not have any exposure to the front-month WTI crude oil contract (August). This is an important factor to be aware of as it means that the fund’s performance may not match the performance of the front-month contract, which is most often cited when discussing the price of oil. It is also worth noting that crude currently remains in contango, meaning it has a negative roll yield, as can be seen on the CLCONTANGO chart. Having a negative roll yield or being in contango means that the price of futures contracts is higher than the (expected) spot price and the contracts “roll down” the curve toward the spot price, resulting in a negative “yield.” This is not to say that the overall return will be negative as the price return is usually a much larger factor.

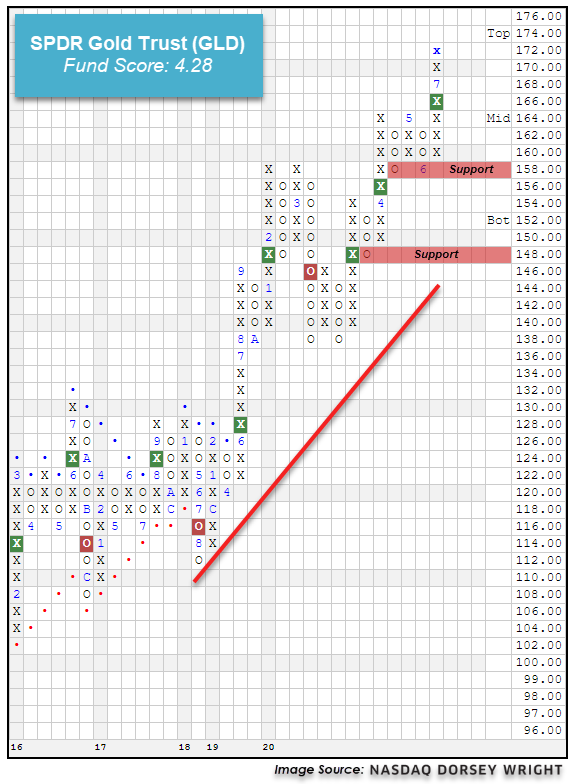
Gold
Earlier this month, gold GC/ breached the $1,800 level for the first time since 2011. In Tuesday’s trading, gold moved higher, reaching $1,840, now within striking distance of its all-time high of $1,920. Year-to-date (through 7/20) gold is up just under 20%. Similar to silver, investors can gain direct exposure to gold via the SPDR Gold Trust GLD or through the VanEck Vectors Gold Miners ETF GDX, which is composed of gold mining stocks.
Similar to silver, the continued strength from Gold Continuous has been felt across various fund representatives, such as the SPDR Gold Trust GLD. This fund seeks to track the performance of the price of gold bullion through investment in physical assets of the commodity (source: ssga.com). GLD has demonstrated notable improvement since its near-term bottom of $138 in March, rising to give three consecutive buy signals before advancing Tuesday to $172, its highest level since 2012. GLD has maintained its positive trend since June of 2019 and the fund carries a favorable 4.28 recent fund score posting. Weekly momentum also recently flipped positive, suggesting the potential for higher prices. Exposure may be considered at current levels, or on a pullback as GLD may be entering overbought territory. Initial support can be found at $158 with further support offered at $148. The bullish support line is also currently found at $144.
Gold miners have also shown notable upside participation, as shown through the VanEck Vectors Gold Miners ETF GDX. This fund continued higher off its multi-year low of $16.25 seen in March to most recently reach $41.50 in intraday trading Tuesday, marking a peak-to-trough gain of over 157%! GDX also carries a 4.76 fund score, which bests the average precious metals fund (4.65), and a strongly positive 4.06 score direction, indicative of its impressive ascent. Weekly momentum also recently flipped positive, suggesting the potential for additional price improvement. The technical picture is sound, however, those considering adding exposure should note that GDX has entered overbought territory. Initial support can be found at $37, with further support offered at $31.50.
