Nordic countries have shown recent improvement and are worth monitoring as potential places to look towards for strength in international markets.
Broad emerging markets have continued to lead most of the relative rankings across the NDW platform as global equity markets have rallied off their COVID-19 lows, which makes sense given their outperformance compared to developed markets. The iShares MSCI Emerging Markets ETF EEM has outpaced the iShares MSCI EAFE ETF EFA over the past 30 days, with respective returns of 3.17% compared to -0.48%, bringing the emerging market fund into the black on the year with a gain of 2.36%, while EFA continues to lag with a loss of -6.65% over the same timeframe. Much of this outperformance has stemmed from the overweight of China and Taiwan within EEM, which combine to make up over 54% of the fund’s allocation. These two countries also rank highly in our country index relative strength comparison, with China ranking fifth out of the 43 countries examined and Taiwan placing a bit higher at second overall. However, the remaining nine spots in the top quartile of these rankings are developed market countries, based on the relative strength rankings through trading Monday.

Denmark has held onto the top position in this matrix since the end of September, although we see that four other countries from the Nordic region are also found in the top quartile. This includes the Netherlands, Sweden, Finland, and Switzerland. Today, we will take a closer look at the recent movement from representative funds from some of these areas as potential places to look towards for continued strengthening in international markets.
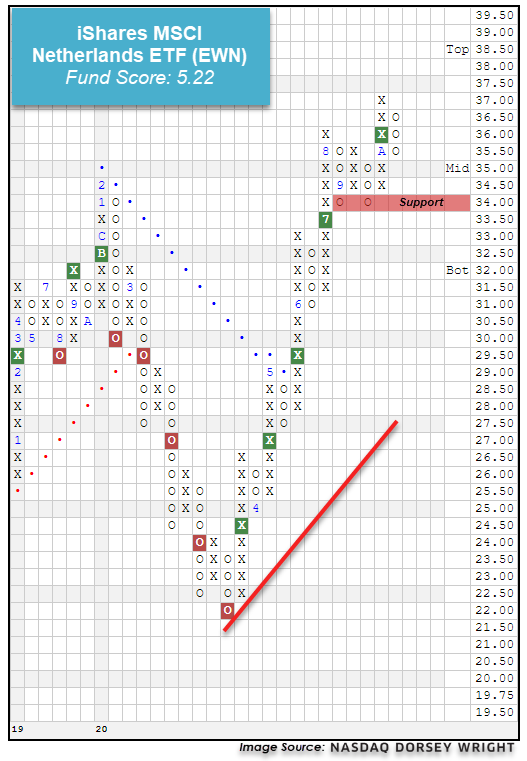
The iShares MSCI Netherlands ETF EWN has shown significant strength over the past few months, as the fund moved to break through to a positive trend in May and give its fifth consecutive buy signal earlier this month at $36, before moving to a new all-time high at $37 last week. The 5.22 recent fund score posting of the fund bests the average non-US equity score of 3.47 as well as the average Europe fund of 2.73 and is paired with a strongly positive score direction of 3.44. Weekly momentum also recently flipped positive, which suggests the potential for further upside from here. EWN recently pulled back from its all-time high to a current chart position of $35.50 and is suitable for long-exposure consideration at this time. Initial support may be found at $34, with further support offered at $31.
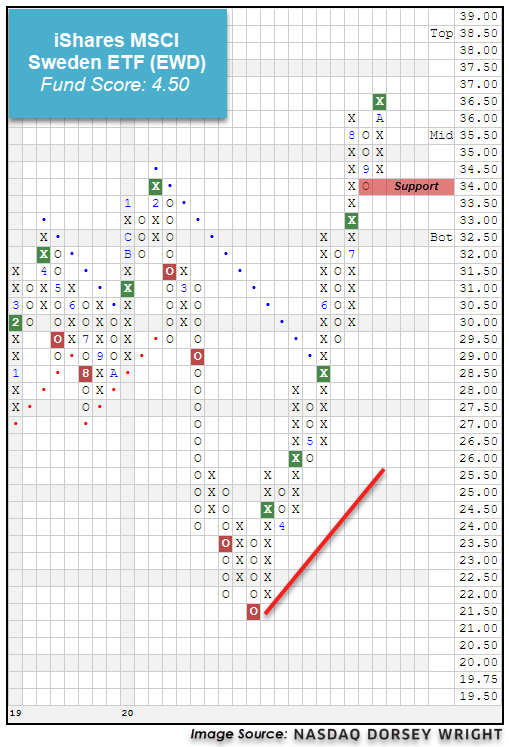
Another fund that has shown consistent strength is the iShares MSCI Sweden ETF EWD, which also gave its fifth consecutive buy signal earlier this month at $36.50, matching a multi-year high from early-2018. This fund moved back to a positive trend in May and shows a recent fund score of 4.50, which bests the average non-US fund (3.47) and average Europe fund (2.73). The recent improvement of EWD has also been displayed through the positive 2.97 score direction, and the fund still sits at a current chart level of $36.50 in the normalized trading territory. Long exposure may be considered here, with initial support offered at $34.
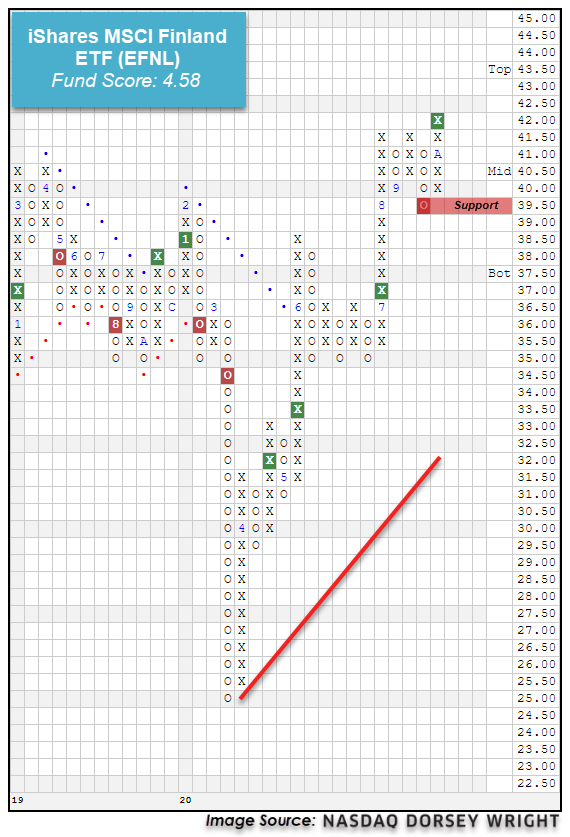
The final fund we will examine today is the iShares MSCI Finland ETF EFNL, which most recently completed a shakeout pattern with a triple top break at $42 to mark a new multi-year high. This fund has improved significantly off its multi-year low of $25 seen in March, moving back to a positive trend in June before rising to current levels at $42. Similar to the other Nordic representatives, EFNL possesses a favorable fund score of 4.58 and an intensely positive score direction of 3.98, indicative of the fund's drastic score improvement over the past six months. Those looking to add exposure may consider the fund at current levels, with initial support offered at $39.50. Note that EFNL also carries a yield of 3.29%.