
EEM is now testing its multi-year high at $46.
Portfolio View - Major Market ETFs
| Symbol | Name | Price | Yield | PnF Trend | RS Signal | RS Col. | Fund Score | 200 Day MA | Weekly Mom |
|---|---|---|---|---|---|---|---|---|---|
| DIA | SPDR Dow Jones Industrial Average ETF Trust | 282.95 | 2.07 | Positive | O | 4.13 | 262.74 | +1W | |
| EEM | iShares MSCI Emerging Markets ETF | 45.93 | 1.94 | Positive | Sell | O | 4.98 | 41.04 | +2W |
| EFA | iShares MSCI EAFE ETF | 64.82 | 2.52 | Positive | Sell | O | 2.76 | 61.86 | -7W |
| FM | iShares MSCI Frontier 100 ETF | 26.89 | 2.95 | Negative | Sell | O | 2.56 | 25.10 | +3W |
| IJH | iShares S&P MidCap 400 Index Fund | 197.73 | 1.61 | Positive | Buy | O | 3.26 | 180.41 | +2W |
| IJR | iShares S&P SmallCap 600 Index Fund | 75.51 | 1.57 | Positive | Buy | O | 3.03 | 69.88 | +2W |
| QQQ | Invesco QQQ Trust | 284.41 | 0.58 | Positive | Buy | X | 5.75 | 239.72 | +2W |
| RSP | Invesco S&P 500 Equal Weight ETF | 112.50 | 1.89 | Positive | Buy | X | 4.07 | 103.96 | +2W |
| SPY | SPDR S&P 500 ETF Trust | 343.38 | 1.65 | Positive | O | 4.28 | 312.00 | +1W | |
| XLG | Invesco S&P 500 Top 50 ETF | 266.08 | 1.33 | Positive | O | 5.55 | 238.08 | +1W |
Additional Comments:
Generally speaking, it was a negative week across the board for the ten major market funds covered in this report as nine finished in the red while just one fund, the iShares MSCI Frontier 100 ETF FM, managed to finish in the black with a gain of 0.56%. The Invesco QQQ Trust QQQ lagged the group with a loss of -3.43%, followed by the Invesco S&P 500 Top 50 ETF XLG, down -2.71%. On a year-to-date basis, there are now just four major market funds sitting in positive territory, including the QQQ, the XLG, the SPDR S&P 500 ETF Trust SPY, and the iShares MSCI Emerging Markets ETF EEM. Today, we'll examine the EEM's recent price action and technical health of this emerging market proxy; but first, in the table below, we've provided updated support levels for all major market funds covered in this report.
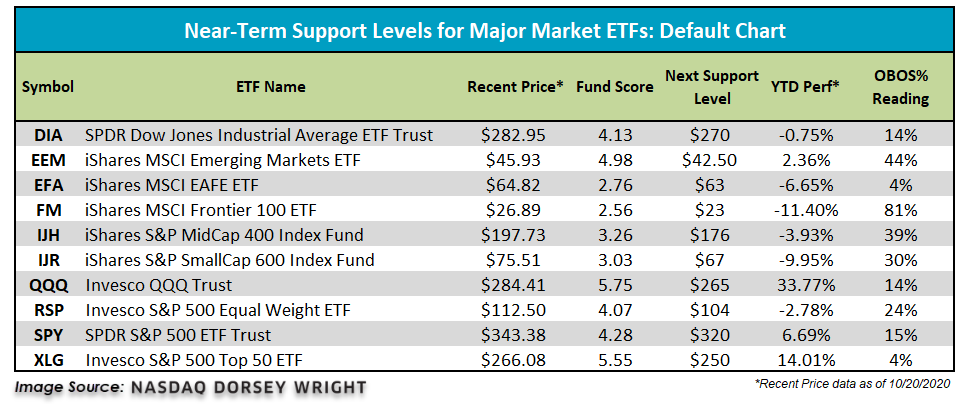
Recall that in January, EEM printed a multi-year high at $46 before moving to a sell signal in February where it broke a triple bottom at $41.50. Shares of EEM then tumbled more than 33% from its January high, moving as low as $30.50 in March following a series of five consecutive sell signals. Later, in March, EEM returned to a buy signal at $33 and gave a total of four consecutive buy signals before moving to a sell signal in September. With recent market action, EEM returned to a Point & Figure buy signal at $45.50 before moving higher to $46, where the fund is now testing its January high. From current levels, a move to $46.50 would mark a new multi-year high. EEM's positive price action since printing its March lows has caused the fund to strengthen significantly from both an absolute and relative perspective. Currently, EEM has a solid fund score of 4.98 with a strongly positive score direction of 4.27, speaking to the fund's improvement over the last six months. This current score beats the average emerging market equity fund by 0.96 score points, the average non-US fund by 1.52 score points, and the average all global and international fund by 1.47 score points. Additionally, EEM has experienced three months of positive monthly momentum and two months of positive weekly momentum, adding to the fund’s healthy technical picture. With an OBOS% reading of 43%, EEM is actionable at current levels with initial support offered at $42.50. Year-to-date, EEM is up 2.36% and is outperforming its developed market counterpart, the iShares MSCI EAFE ETF EFA, by over 9%, making emerging markets the favored international space at this time.

