
Emerging market equities have continued to outperform in the falling dollar environment.
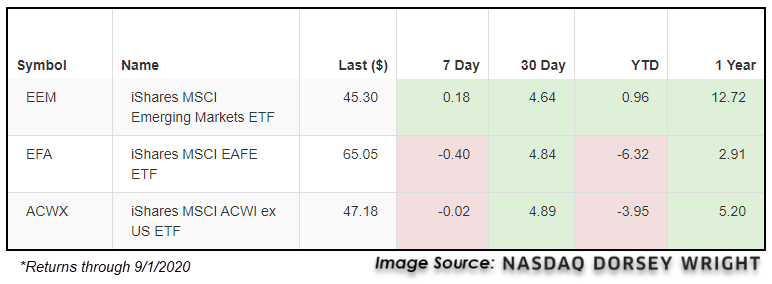
The continued decline of the US Dollar DX/Y has led the broader market to now be in a falling dollar environment, as we cover in most of the research articles in today’s Daily Equity Report. While this has many potential tailwind effects across global markets, one of the most significant observations we note is that international equities tend to perform very well during those periods of sustained declines for the US dollar. This is especially true for emerging market economies, as they tend to fare better than their developed market counterparts. Following this theme, emerging market equities have continued to outperform the broader international equity space over the past week, furthering a trend that has been maintained throughout much of the past year. In looking at a performance breakdown from benchmarks in emerging markets (EEM), developed markets (EFA), and broad international equities (ACWX), we can see that EEM is the only representative in the black on a one-week trailing return basis, and is also the only representative to show positive year-to-date returns. Taking this a step further, this recent outperformance has led EEM to vastly outperform both EFA and ACWX on a twelve-month rolling performance basis as well, with its 12.72% gain besting the 2.91% and 5.20% returns of EFA and ACWX, respectively.
This improvement of emerging markets is also displayed through the Asset Class Group Scores (ACGS) page, as we have seen the emerging markets diversified group move back above the 4.00 score threshold for the first time since May of 2018. In the last occurrence, we saw the average score of the group move north of 4.00 in May of 2017, and remain at elevated levels for about a year. While the global & international diversified and global developed market groups also showed improvement during that time period, neither group was able to surpass the emerging markets group score while it was above 4.00. In looking at the most recent score movement, we see a similar story beginning to unfold. Emerging markets diversified has advanced significantly from its recent score low of 1.54 in late-May, to reach its current level of 4.02. The other global & international diversified and global developed markets groups have seen steady score improvement to push above 3.00, but have trailed the rapid rise seen in emerging markets.

While we continue to focus on the 4.00 score threshold as a line of demarcation, many investors that utilize theses scores may be unsure of exactly how important it is to maintain exposure to groups in the high score territory. In order to help answer this question, we pulled the score history for the emerging markets diversified space along with historical returns for EEM dating back to 11/18/2003, which marked the origin of the emerging markets group score history. We then ran a portfolio growth of investing $100 in EEM only when the average group score for emerging markets diversified moved above 4.00, compared to a baseline of buying and holding EEM throughout the entire testing history. This revealed that even though the emerging markets group remained below the 4.00 score line for about a seven-year period from 2010 to 2017, the portfolio that only invested in emerging markets while the group score was above 4.00 vastly outperformed the baseline test with a cumulative return of 318% compared to the 176% growth of the baseline. While it may not be realistic for you to simply sell out of all emerging market equity exposure when the group score moves below 4.00, this does demonstrate the importance of maintaining exposure to the space when it rises in strength from a group score perspective.

