
Most Requested Symbols

Over the course of the past week, we did see a change within the asset class ranking of DALI, with fixed income passing cash to take over the number one position by one signal following trading on Tuesday.
The iShares MSCI EAFE ETF (EFA) and iShares MSCI Emerging Markets ETF (EEM) have each moved back into overall positive trends.
The average distribution reading is 37.88% overbought.
Today's featured stock is CyrusOne Inc (CONE).
ADNT, AQUA, BC, CACC, EOG, GPN, GSHD, HEI, ITGR, & JACK.
Call: Best Buy (BBY), Put: Altria (MO), Covered Write: Hess (HES)
ESS Webinar Series Replays: We are excited to bring you replays of each of the Enhanced Security Selection (ESS) package webinars that we have conducted over the past four weeks. These webinars provide some background information on the tools you get with the ESS package and offer potential implementation ideas to put these tools to work. Each webinar is approximately an hour long. Please see the breakdown of topics and their respective video replays listed below.
Market Webinar Replay: We also have a video replay and slides available from our lastest Market Update Webinar from Monday, June 1st:
Zoom-ing Higher: As far as historic disruptions to social and economic ways of life, very few in the modern era have been as immediate and as widespread as the COVID-19 outbreak and fallout. In business, however, one company’s (or industry’s) folly is another’s fortune. Perhaps the single best example of a company that has benefited from the current environment lies with Zoom Inc. ZM, which provides teleconference software to individuals and businesses. While Zoom is certainly not the first in this space, its success has been meteoric and has captured the attention of investors seeking the “next big thing” in an era of IPO flops and broken unicorn dreams. Since ZM first began trading on April 17th, 2019, the stock has returned a whopping 478% relative to the S&P 500’s SPX 6.22% during the same period (as of 6/2/20). While the first year of trading was choppy, 2020 has proven much more fruitful as the software provider has rocketed 205.82% on a year-to-date basis. On yesterday’s earnings call, Zoom reported an increase in monthly active mobile app users from 14 million on March 4th to 173 million monthly users as of May 27th, placing an exclamation mark on just how integral of a product Zoom has become during the current market environment (source: CNBC). In fact, after today’s close, ZM’s market cap is higher than that of the 5 largest U.S. airlines that have undoubtedly been impacted by travel restrictions and lockdowns (source: Factset). Despite the success for this strong 5 for 5’er, ZM is heavily overbought at current levels and does not find near-term support until $150 on its default chart.


Each week the analysts at DWA review and comment on all major asset classes in the global markets. Shown below is the summary or snapshot of the primary technical indicators we follow for multiple areas. Should there be changes mid-week we will certainly bring these to your attention via the report.
| Universe | BP Col & Level (actual) | BP Rev Level | PT Col & Level (actual) | PT Rev Level | HiLo Col & Level (actual) | HiLo Rev Level | 10 Week Col & Level (actual) | 10 Week Rev Level | 30 Week Col & Level (actual) | 30 Week Rev Level |
|---|---|---|---|---|---|---|---|---|---|---|
| ALL |
|
50% |
|
32% |
|
78% |
|
78% |
|
30% |
| NYSE |
|
60% |
|
36% |
|
76% |
|
84% |
|
22% |
| OTC |
|
46% |
|
30% |
|
80% |
|
74% |
|
34% |
| World |
|
46% |
|
30% |
|
|
|
70% |
|
26% |
Over the course of the past week, we did see a change within the asset class ranking of DALI, with fixed income passing cash to take over the number one position by one signal following trading on Tuesday. The equity markets continued higher over the past week (5/27/2020 – 6/2/2020), and we did actually see the tally reading for fixed income and cash drop. Fixed Income lost six signals since this time a week ago and cash dropped ten signals. Domestic equity added one while international equity and commodity rose by eight signals and 13 signals, respectively.

One thing that has been extremely difficult in this market has been the speed and velocity with which the market corrected and subsequently recovered, as well as the narrowness of the leadership. To put the speed of this pullback into perspective, it took the market just 22 days to fall 20% from the February 19th peak. This was the fastest correction of 20% we have ever seen (excluding the 1930s). In 2008, it took nine months for the market to correct 20% off the October 2007 high (October 2007 to July 2008). In 2002, it took 6 months to hit 20% down (January 2002 to July 2002).
This correction also came off a rather strong move higher in equity after the December 2018 low. The S&P 500 up 44% from 12/24/18 to 2/19/20, also during the run First Trust Focus 5 FV was up 45% and the Invesco DWA Momentum Portfolio PDP was up 55%. That explosive move higher, while great for the 2019 calendar year, left a number of relative strength charts up on stems; therefore, in order to generate sell signals they needed to fall more than 20%. Not unlike 2018, which was a benefit to the portfolios, although this time around it was not. This brings us to the “why hasn’t domestic equity moved back up in DALI” question. Well for very similar, yet completely opposite reasons. As quick as the move down was off the Feb peak, the rally back has been equally as explosive to the upside leaving relative strength charts, in some case, far away from buy signals upon the initial reversals up. The best-case scenario would have been to get some back and forth action off the bottom to set up a buy signal from a much lower level, however, that didn’t happen for many charts. This “V-shaped” recovery the market has experienced is a very difficult environment for relative strength or trend following of any kind and is not the common bottoming process for the market. The 2002 bottom and the 2008/09 bottom you got quite a bit of back and forth at the bottom so those bottoms were more of a process than an event like this year.
It took the S&P 500 just 16 days to rally 20% off the March 23rd low! If we go back and look at all the major bottoms in the market the average length of time before rallying 20% is 84 days or nearly three months. This move off the bottom has been equally as explosive as the 20+% rally from November 2008 to January 2009, as well as the move off of the March 2009 low.

With all that being said, as we stand today (or at least thru June 2nd) there are 47 buy signals separating domestic equity from the number two asset class. There are 14 domestic equity charts within DALI that are within 5% of returning to buy signals. A number of those are small caps and a number of signals would come at the expense of fixed income. So, if those were to happen that gap could get cut in half pretty quickly. This doesn’t account for the number of international equity and commodity charts that are close to moving back to buy signals against fixed income and cash. The combination of the speed of the sell-off and the speed of the recovery is the primary reason domestic equity hasn’t climbed higher and faster in DALI in this market environment. The initial move down was the fastest we have ever seen and the move off of the low is among the fastest the market has ever seen, taking just 20% of the duration of the average recovery period. The “averages” have been thrown out the window with this market on many different fronts, but in case you were wondering, the average return before hitting a peak during the previously mentioned recovery periods is 108% and the average duration from the low to the high is 937 days. The largest came off of the 1987 low when the market rallied 582% before peaking in March 2000 and the second largest was the 400% move off the March 2009 low. If the market continues it’s recovery, then we will see domestic equity return to one of the top-ranked asset classes. On the other hand, if this rally stalls out and pushes back lower then we are likely to see many of the individual relative strength charts reverse down which would then set up alternate potential buy signals. If you missed last week’s “Weekly DALI and US Equity Update” be sure to click here to review some more details on this subject as well as some specific relative strength chart examples.

| Symbol | Name | Price | Yield | PnF Trend | RS Signal | RS Col. | Fund Score | 200 Day MA | Weekly Mom |
|---|---|---|---|---|---|---|---|---|---|
| DIA | SPDR Dow Jones Industrial Average ETF Trust | 257.85 | 2.28 | Positive | X | 3.33 | 263.08 | +8W | |
| EEM | iShares MSCI Emerging Markets ETF | 39.52 | 2.46 | Positive | Sell | O | 1.98 | 40.54 | +8W |
| EFA | iShares MSCI EAFE ETF | 61.54 | 3.50 | Positive | Sell | O | 2.06 | 63.26 | +8W |
| FM | iShares MSCI Frontier 100 ETF | 23.93 | 3.96 | Negative | Sell | O | 0.32 | 27.04 | +8W |
| IJH | iShares S&P MidCap 400 Index Fund | 179.95 | 1.92 | Positive | Buy | O | 2.43 | 184.95 | +8W |
| IJR | iShares S&P SmallCap 600 Index Fund | 67.63 | 1.77 | Positive | Buy | O | 1.11 | 73.83 | +8W |
| QQQ | Invesco QQQ Trust | 235.63 | 0.70 | Positive | Buy | X | 5.89 | 205.39 | +8W |
| RSP | Invesco S&P 500 Equal Weight ETF | 103.18 | 2.14 | Positive | Buy | X | 2.27 | 105.02 | +8W |
| SPY | SPDR S&P 500 ETF Trust | 308.08 | 1.88 | Positive | O | 3.87 | 300.00 | +8W | |
| XLG | Invesco S&P 500 Top 50 ETF | 233.05 | 1.59 | Positive | O | 5.23 | 220.52 | +8W |
It was another exceptionally strong week for the 10 major market funds covered in this report as all managed to finish in positive territory. The top two performing funds this week both came from the international camp – the iShares MSCI Emerging Markets ETF EEM posted an impressive gain of 6.15% while the iShares MSCI EAFE ETF EFA gained 5.05%. Conversely, the iShares SmallCap 600 Index Fund IJR lagged the pack despite finishing in positive territory with a gain of 1.87%. In the table below, we have updated initial support levels for all 10 major market funds covered in this report. Additionally, we want to highlight two notable intraday buy signals that happened today (6/3). Be sure to read today's International Equity Overview which discusses the positive trend changes we saw on the charts of the EEM and EFA.

Last Wednesday, we brought to your attention the fact that the iShares SmallCap 600 Index Fund IJR had moved through its bearish resistance line at $68 with the day’s price action. As a result, IJR’s default chart moved back into a positive trend for the first time since flipping negative in late February. Over the last seven days, the small-cap fund managed to push higher to $69 before experiencing a slight pullback to $66 which triggered a three-box reversal into Os on the chart. However, with today’s market action, IJR has reversed back up into Xs where it broke a double top at $70, marking the second consecutive buy signal on the chart. From current levels, initial support is now offered at $66 and the fund will face the next level of overhead resistance at $76. This follow-through is undoubtedly a positive sign for IJR however the fund remains technically weak with a score of 1.11, well below the acceptable 3-threshold. Year-to-date, IJR is down -19.34%, underperforming the S&P 500 Index SPX by 14.70%.

Like its small-cap counterpart, today the default chart of the iShares S&P MidCap 400 Index Fund IJH broke a double top at $182 before moving higher to $184. This breakout marks the second consecutive buy signal on the chart, confirming that demand is in control. Currently, IJH has a relatively weak fund score of 2.43 and its year-to-date loss of -12.57% continues to lag the SPX by 7.93%. However, if we continue to see IJH’s technical picture improve from here, we can expect to see the score push higher. Be sure to set a score alert under “Set Alert” so that you can be notified when IJH moves above the 3-threshold. From current levels, IJH has support at $174 and faces resistance at $190.

SECTOR BULLISH PERCENT CHANGES
| Reversed to X | Reversed to O |
|---|---|
| 5 (BPFOOD | 52), (BPMETA | 50), (BPOILS | 42), (BPSAVI | 40), (BPSOFT | 66), |
1 (BPPREC | 48), |
| To Xs | To Os |
|---|
Average Level
58.72
| Sector |
|---|
| None |
| Sector |
|---|
| Banks (50%) - Bull Alert |
| Computers (48%) - Bull Confirmed |
| Metals Non Ferrous (50%) - Bull Confirmed |
| Oil (46%) - Bear Correction |
| Oil Service (42%) - Bull Confirmed |
| Savings & Loans (40%) - Bull Alert |
| Telephone (48%) - Bull Confirmed |
| Waste Management (42%) - Bull Alert |
| Sector |
|---|
SECTOR INDICATOR CHART CHANGES
PT is the percentage of stocks within a sector that are trading above their bullish support lines. RSX is the percentage of stocks within a sector whose relative strength charts are in a column of Xs. RSP is the percentage of stocks within a sector whose relative strength charts are on a buy signal. The strongest sectors, i.e. market leaders, will have most of these indicators positive and moving higher in a column of Xs.
|
There were only rising sector PT charts this week, with 34 rising and none moving lower. The following sector charts rose: Aerospace Airline [^PTAERO], Autos and Parts [^PTAUTO], Banks [^PTBANK]-Rev. , Building [^PTBUIL], Business Products [^PTBUSI], Chemicals [^PTCHEM], Computers [^PTCOMP], Drugs [^PTDRUG], Electronics [^PTELEC], Utilities/Electricity [^PTEUTI], Finance [^PTFINA], Food Beverages/Soap [^PTFOOD], Forest Prods/Paper [^PTFORE], Gaming [^PTGAME], Gas Utilities [^PTGUTI], Healthcare [^PTHEAL], Household Goods [^PTHOUS], Internet [^PTINET], Insurance [^PTINSU]-Rev. , Leisure [^PTLEIS], Machinery and Tools [^PTMACH], Metals Non Ferrous [^PTMETA], Oil [^PTOIL], Oil Service [^PTOILS]-Rev. , Protection Safety Equipment [^PTPROT]-Rev. , Real Estate [^PTREAL], Restaurants [^PTREST], Retailing [^PTRETA], Savings & Loans [^PTSAVI]-Rev. , Software [^PTSOFT], Steel/Iron [^PTSTEE]-Rev. , Telephone [^PTTELE], Textiles/Apparel [^PTTEXT], Transports/Non Air [^PTTRAN]-Rev. . There were 7 that reversed to X. |
|
| ^PT Charts Reversing Up - | ^PT Charts Reversing Down - |
|
|
|
| ^PT Charts Moving Higher - | ^PT Charts Moving Lower - |
|
|
|
There were mostly falling sector RSX charts this week, with 14 falling and 13 rising. The following sector charts rose: Aerospace Airline [^RSXAERO], Autos and Parts [^RSXAUTO]-Rev. , Building [^RSXBUIL], Chemicals [^RSXCHEM], Gaming [^RSXGAME], Household Goods [^RSXHOUS], Leisure [^RSXLEIS], Protection Safety Equipment [^RSXPROT]-Rev. , Real Estate [^RSXREAL]-Rev. , Restaurants [^RSXREST]-Rev. , Retailing [^RSXRETA]-Rev. , Steel/Iron [^RSXSTEE], Textiles/Apparel [^RSXTEXT]-Rev. . The following sector charts fell: Biomedics/Genetics [^RSXBIOM], Computers [^RSXCOMP], Drugs [^RSXDRUG], Electronics [^RSXELEC], Utilities/Electricity [^RSXEUTI], Food Beverages/Soap [^RSXFOOD], Healthcare [^RSXHEAL], Internet [^RSXINET], Insurance [^RSXINSU], Oil [^RSXOIL], Precious Metals [^RSXPREC], Semiconductors [^RSXSEMI]-Rev. , Telephone [^RSXTELE], Wall Street [^RSXWALL]. There were 0 that moved to buy signals and 3 that moved to sell signals. The following were buy signals: . The following were sell signals: Biomedics/Genetics [^RSXBIOM],Electronics [^RSXELEC],Internet [^RSXINET]. |
|
| ^RSX Charts Reversing Up - | ^RSX Charts Reversing Down - |
|
|
| ^RSX Charts Moving Higher - | ^RSX Charts Moving Lower - |
|
|
|
There were only rising sector RSP charts this week, with 17 rising and none moving lower. The following sector charts rose: Autos and Parts [^RSPAUTO], Biomedics/Genetics [^RSPBIOM], Building [^RSPBUIL], Business Products [^RSPBUSI], Chemicals [^RSPCHEM], Drugs [^RSPDRUG], Electronics [^RSPELEC], Finance [^RSPFINA], Forest Prods/Paper [^RSPFORE], Gaming [^RSPGAME], Internet [^RSPINET], Leisure [^RSPLEIS], Media [^RSPMEDI], Metals Non Ferrous [^RSPMETA], Protection Safety Equipment [^RSPPROT], Retailing [^RSPRETA], Textiles/Apparel [^RSPTEXT]. No charts reversed in column. |
|
| ^RSP Charts Reversing Up - | ^RSP Charts Reversing Down - |
|
|
|
| ^RSP Charts Moving Higher - | ^RSP Charts Moving Lower - |
|
|
FAVORED SECTOR STATUS CHANGES
A sector is considered to be Favored if it has 3 or 4 of the sector indicators (Relative Strength, RSX, RSP, & PT) positive, Average if it has 2 of the 4 indicators positive, & Unfavored if it has 0 or 1 of the indicators positive. The table below contains those sectors that have experienced a Favored Sector Status change over the past week. It is best to focus on sectors that are about 50% or lower on their Bullish Percent charts & are in Xs. Note: If a sector moves from Favored to Average, it doesn't necessarily mean that the sector in question has to be sold - it just means you need to evaluate your individual positions with exposure to that sector.
| Changes since 05/27/2020 | Full Report |
|
|
|
|
|||||||||||||
|
|
|
|
|
|
|||||||||||
|
|
|
|
|
|||||||||||
|
|
|
|
|
|
|||||||||||

The broader international equities asset class remains out of favor across most of our relative strength rankings, including the Dynamic Asset Level Investing (DALI) tool which has the asset class in the last ranked position out of the six spaces examined. With that said, we have seen some near-term improvement from certain areas around the world, which has led the international equities asset class to gain 11 buy signals over the past week – the most out of any asset class. The space is still 22 buy signals from the fifth-ranked commodities, but it is certainly significant to see this recent strength. As a whole, the more offensively-minded asset classes of domestic equities, commodities, and international equities have each continued to gain signals during the past five trading days, which is a further positive indication for “risk-on” investments such as those in foreign equity markets.
As we mentioned last week, the iShares MSCI EAFE ETF EFA moved higher to transition back to an overall positive trend with movement to $60 last week. The developed markets representative has seen further demand come in over the past five trading days, with EFA advancing intraday Wednesday to notch another X at $62. While this improvement is certainly a positive sign, it should also be noted that the recent rally has left the fund in overbought territory.

This week, we have also seen a further movement to the upside in our broad emerging markets representative, the iShares MSCI Emerging Markets ETF EEM. This fund broke a double top at $38 in trading on Monday, marking its third consecutive buy signal which also surpassed its bearish resistance line to move EEM back to an overall positive trend. The past two days have seen continued advancement, with EEM moving past further resistance and reaching $40 in trading Wednesday. In a similar vein to EFA, the emerging markets fund has seen a strong rally off its recent multi-year low of $30.50 but is now in overbought territory as well.

While there are a variety of factors that play into the price movement for foreign stocks, one of the more significant influencers is the strength of the US Dollar, which we track using the NYCE U.S. Dollar Index Spot DX/Y. Interestingly enough, DX/Y has shown deterioration over the past week, as the chart fell to give a triple bottom break on May 28th before continuing lower to $98 on Thursday, which moved the index back to an overall negative trend. DX/Y has fallen further this week to a recent level of $97.50 through trading on Tuesday.
Taking a look at the recent performance comparison of EFA, EEM and DX/Y reveal that the emerging and developed market representatives have each gained over 11% over the past 30 days, while the US Dollar index has fallen by -1.37% (through 6/2). We can also see that both EFA and EEM have had about half of their recent improvement occur over the past seven days, with respective gains of 5.05% and 6.15%, while DX/Y has seen almost all of its recent decline come over the same timeframe, posting a loss of -1.30%. These developments are certainly at their initial stages, making them a place to continue to monitor as we head towards the halfway point of 2020.


Remember, these are technical comments only. Just as you must be aware of fundamental data for the stocks we recommend based on technical criteria in the report, so too must you be aware of important data regarding delivery, market moving government releases, and other factors that may influence commodity pricing. We try to limit our technical comments to the most actively traded contracts in advance of delivery, but some contracts trade actively right up to delivery while others taper off well in advance. Be sure you check your dates before trading these contracts. For questions regarding this section or additional coverage of commodities email james.west@dorseywright.com.
Data represented in the table below is through 06/03/2020:
Broad Market Commodities Report
| Symbol | Name | Price | PnF Trend | RS Signal | RS Col. | 200 Day MA | Weekly Mom |
|---|---|---|---|---|---|---|---|
| CL/ | Crude Oil Continuous | 36.87 | Negative | Buy | X | 46.48 | +6W |
| DBLCIX | Deutsche Bank Liquid Commodities Index | 249.39 | Negative | Sell | O | 291.63 | +8W |
| DWACOMMOD | DWA Continuous Commodity Index | 449.43 | Negative | Buy | O | 460.35 | +7W |
| GC/ | Gold Continuous | 1733.20 | Positive | Buy | X | 1572.56 | -4W |
| HG/ | Copper Continuous | 2.50 | Negative | Buy | O | 2.56 | +7W |
| ZG/ | Corn (Electronic Day Session) Continuous | 324.00 | Negative | Buy | O | 362.72 | +5W |
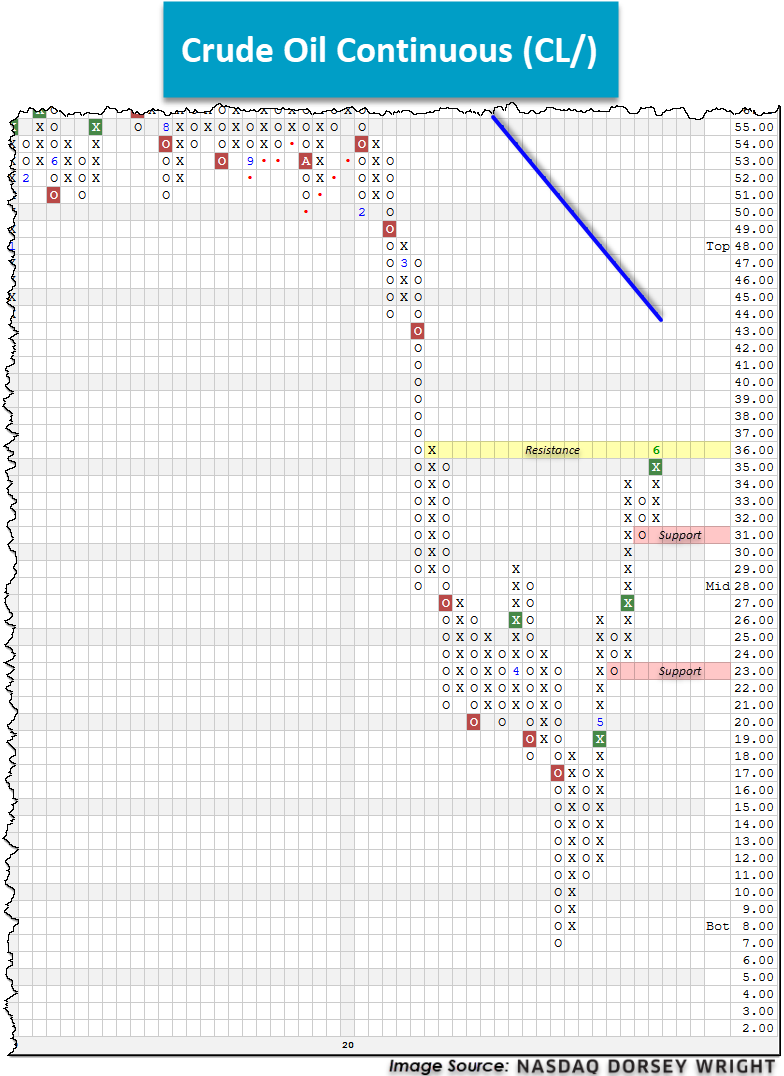
As the localities and municipalities around the globe begin to loosen lockdown restrictions, the appetite for commodities such as crude oil has begun to reemerge. Additionally, the potential for additional crude oil production, as measured by assessing the Baker Hughes US Crude Oil rotary rig count, is at its lowest level since 2010 with 222 operating rigs (source: WSJ). These converging factors have created explosive price action as net new demand has entered the crude oil market in recent months. After hitting a revised bottom (excluding temporary negative price action) of $7 on the chart in late April, Crude Oil Continuous CL/ has since rallied to mark three consecutive buy signals, ultimately culminating with yesterday’s chart reading of $36 in Xs. Despite this major move off of the bottom, CL/ is still down nearly 40% on the year and remains in a negative trend since January. Further, while the technical strength for the commodity is evident in the near-term, crude tests resistance at its current chart level of $36. A move to $37 would provide additional confirmation of this near-term rally and eliminate all resistance before the bearish resistance line comes into play at $44. From here, support is offered at $31.
Average Level
37.88
| AGG | iShares US Core Bond ETF |
| USO | United States Oil Fund |
| DIA | SPDR Dow Jones Industrial Average ETF |
| DVY | iShares Dow Jones Select Dividend Index ETF |
| DX/Y | NYCE U.S.Dollar Index Spot |
| EFA | iShares MSCI EAFE ETF |
| FXE | Invesco CurrencyShares Euro Trust |
| GLD | SPDR Gold Trust |
| GSG | iShares S&P GSCI Commodity-Indexed Trust |
| HYG | iShares iBoxx $ High Yield Corporate Bond ETF |
| ICF | iShares Cohen & Steers Realty ETF |
| IEF | iShares Barclays 7-10 Yr. Tres. Bond ETF |
| LQD | iShares iBoxx $ Investment Grade Corp. Bond ETF |
| IJH | iShares S&P 400 MidCap Index Fund |
| ONEQ | Fidelity Nasdaq Composite Index Track |
| QQQ | Invesco QQQ Trust |
| RSP | Invesco S&P 500 Equal Weight ETF |
| IWM | iShares Russell 2000 Index ETF |
| SHY | iShares Barclays 1-3 Year Tres. Bond ETF |
| IJR | iShares S&P 600 SmallCap Index Fund |
| SPY | SPDR S&P 500 Index ETF Trust |
| TLT | iShares Barclays 20+ Year Treasury Bond ETF |
| GCC | WisdomTree Continuous Commodity Index Fund |
| VOOG | Vanguard S&P 500 Growth ETF |
| VOOV | Vanguard S&P 500 Value ETF |
| EEM | iShares MSCI Emerging Markets ETF |
| XLG | Invesco S&P 500 Top 50 ETF |
Relative strength is a measure of how a stock is performing when compared to something else, in this case the S&P 500 Equal Weighted Index (SPXEWI). Each day the stock's closing price is divided by that of the SPXEWI, the resulting numbers decimal is moved two places and then plotted on a Point & Figure chart. Whenever the relative strength chart shows a double top buy signal (e.g. RS Buy or Positive Relative Strength), it suggests the stock is likely to outperform the market for the foreseeable future. Conversely, whenever the relative strength chart gives a double bottom sell signal (e.g. RS Sell or Negative Relative Strength) it suggests the stock will under-perform the market. Relative strength signals tend to last roughly 18 to 24 months on average. Consequently, changes from buy signals to sell signals (and vice versa) are important to be aware of as they are longer-term implications of a stock's likely performance versus the indices. Using the Point & Figure chart along with the relative strength chart will allow you to better ascertain risk-reward and other trade management tools, but we always want to over-weight our portfolios toward those stocks that are on RS buy signals, giving us the best chance of outperforming the broader market.
In the Optionable Universe, this week we saw 49 relative strength buy signals compared to 89 last week. On the sell side, there were 14 relative strength sell signals compared to 13 last week.
| Symbol | Company | Sector | Price | RS vs Market Signal | RS vs Market Column | RS vs Peer Signal | RS vs Peer Column | Tech Attrib |
|---|---|---|---|---|---|---|---|---|
| AA | Alcoa Inc. | Basic Resources | 9.920 | Buy | X | Sell | X | 3 |
| AMSC | American Superconductor Corp | Industrial Goods & Svcs | 7.910 | Buy | X | Sell | X | 3 |
| EPR | EPR Properties | Equity REITs | 34.410 | Buy | X | Buy | X | 4 |
| GES | Guess Inc. | Cyclical Goods and Services | 10.560 | Buy | X | Sell | X | 3 |
| GOL | Gol Intelligent Airlines Inc. (Brazil) ADR | Cyclical Goods and Services | 5.840 | Buy | X | Sell | X | 3 |
| GPS | The Gap, Inc. | Retail | 10.650 | Buy | X | Sell | X | 3 |
| HSC | Harsco Corp | Industrial Goods & Svcs | 12.010 | Buy | X | Sell | X | 3 |
| DBI | Designer Brands Inc. | Retail | 6.660 | Buy | X | Sell | X | 3 |
| DFS | Discover Financial Services | Financial Services | 52.390 | Buy | X | Sell | X | 3 |
| LEN | Lennar Corporation | Cyclical Goods and Services | 60.210 | Buy | X | Buy | X | 5 |
| MOD | Modine Manufacturing Company | Automobiles | 5.470 | Buy | X | Sell | X | 3 |
| NBR | Nabors Industries, Inc. | Oil Drilling, Equipment Svcs | 38.920 | Buy | X | Sell | X | 3 |
| NTP | Nam Tai Property Inc. | Real Estate Investment & Services | 7.560 | Buy | X | Buy | X | 4 |
| CPRI | Capri Holdings Ltd | Cyclical Goods and Services | 17.460 | Buy | X | Buy | X | 3 |
| QUIK | QuickLogic Corporation | Semiconductors | 5.520 | Buy | X | Buy | X | 4 |
| RCL | Royal Caribbean Cruises Ltd. | Cyclical Goods and Services | 56.000 | Buy | X | Sell | X | 3 |
| RGR | Sturm Ruger & Company, Inc. | Industrial Goods & Svcs | 71.170 | Buy | X | Buy | X | 5 |
| SKYW | Skywest Inc | Cyclical Goods and Services | 34.060 | Buy | X | Sell | X | 3 |
| SMTC | Semtech Corporation | Semiconductors | 52.770 | Buy | X | Sell | X | 4 |
| TBBK | Bancorp, Inc. | Banks | 8.420 | Buy | X | Sell | X | 4 |
| TGI | Triumph Group Inc | Industrial Goods & Svcs | 8.530 | Buy | X | Buy | X | 4 |
| WCC | WESCO International, Inc. | Industrial Goods & Svcs | 36.060 | Buy | X | Sell | X | 3 |
| LB | L Brands Inc. | Retail | 16.800 | Buy | X | Sell | X | 4 |
| GEOS | Geospace Technologies Corporation | Oil Drilling, Equipment Svcs | 7.820 | Buy | X | Sell | X | 3 |
| SEAS | SeaWorld Entertainment, Inc. | Cyclical Goods and Services | 17.290 | Buy | X | Sell | X | 3 |
| FOXF | Fox Factory Holding Corp | Automobiles | 73.940 | Buy | X | Buy | X | 5 |
| NVGS | Navigator Holdings Ltd | Industrial Goods & Svcs | 8.270 | Buy | X | Buy | X | 5 |
| VRTV | VERITIV CORPORATION | Noncyclical Goods and Svcs | 11.960 | Buy | X | Buy | X | 5 |
| OEC | Orion Engineered Carbons SA | Chemicals | 11.250 | Buy | X | Sell | X | 3 |
| NK | Nantkwest Inc | Biotechnology | 7.490 | Buy | X | Buy | X | 5 |
| CLDR | Cloudera, Inc. | Software | 11.240 | Buy | X | Sell | X | 3 |
| YEXT | Yext Inc | Software | 16.540 | Buy | X | Sell | X | 4 |
| ALTR | Altair Engineering Inc. Class A | Software | 39.820 | Buy | X | Sell | X | 3 |
| DLPH | Delphi Technologies Plc | Automobiles | 13.710 | Buy | X | Sell | X | 3 |
| USX | US Xpress Enterprises, Inc. Class A | Industrial Goods & Svcs | 5.300 | Buy | X | Buy | X | 4 |
| MAXR | Maxar Technologies Ltd. | Industrial Goods & Svcs | 16.140 | Buy | X | Buy | X | 5 |
| AA.TR | Alcoa Inc. TR | Basic Resources | 9.920 | Buy | X | Sell | X | 3 |
| CFG.TR | Citizens Financial Group Inc TR | Banks | 26.341 | Buy | X | Buy | X | 4 |
| RCL.TR | Royal Caribbean Cruises Ltd. TR | Cyclical Goods and Services | 57.299 | Buy | X | Sell | X | 3 |
| SKYW.TR | Skywest Inc TR | Cyclical Goods and Services | 34.370 | Buy | X | Sell | X | 3 |
| WAL.TR | Western Alliance Bancorporation TR | Banks | 38.682 | Buy | X | Sell | X | 3 |
| WCC.TR | WESCO International, Inc. TR | Industrial Goods & Svcs | 36.133 | Buy | X | Sell | X | 3 |
| CLF.TR | Cleveland-Cliffs Inc. TR | Basic Resources | 5.816 | Buy | X | Sell | X | 4 |
| CPRI.TR | Capri Holdings Ltd TR | Cyclical Goods and Services | 17.460 | Buy | X | Buy | X | 3 |
| DFS.TR | Discover Financial Services TR | Financial Services | 53.866 | Buy | X | Sell | X | 3 |
| GES.TR | Guess Inc. TR | Cyclical Goods and Services | 10.687 | Buy | X | Sell | X | 3 |
| GPS.TR | The Gap, Inc. TR | Retail | 10.953 | Buy | X | Sell | X | 3 |
| LEN.TR | Lennar Corporation TR | Cyclical Goods and Services | 60.540 | Buy | X | Buy | X | 5 |
| PK.TR | PARK HOTELS & RESORTS INC TR | 11.151 | Buy | X | N/A | X | 3 |
| Symbol | Company | Sector | Price | RS vs Market Signal | RS vs Market Column | RS vs Peer Signal | RS vs Peer Column | Tech Attrib |
|---|---|---|---|---|---|---|---|---|
| CVM | Cel-Sci Corp | Biotechnology | 14.420 | Sell | O | Sell | O | 0 |
| EGHT | 8*8, Inc. | Technology Services | 14.290 | Sell | O | Sell | O | 0 |
| FCN | FTI Consulting, Inc. | Industrial Goods & Svcs | 120.720 | Sell | O | Sell | O | 1 |
| HLIT | Harmonic Inc | Communications Technology | 5.350 | Sell | O | Sell | O | 0 |
| OXY | Occidental Petroleum Corporation | Oil Companies Secondary | 14.750 | Sell | O | Sell | O | 0 |
| MSI | Motorola Solutions Inc. | Communications Technology | 139.660 | Sell | O | Buy | O | 1 |
| RYCE | Amira Nature Foods Ltd | Food and Beverage | 11.990 | Sell | O | Buy | O | 2 |
| GTT | GTT Communications Inc. | Technology Services | 7.890 | Sell | O | Sell | O | 0 |
| MGNX | Macrogenics Inc | Biotechnology | 21.960 | Sell | O | Buy | O | 2 |
| CBMG | Cellular Biomedicine Group, Inc | Biotechnology | 13.210 | Sell | O | Sell | O | 0 |
| TDOC | Teladoc Health Inc. | Healthcare Providers | 169.870 | Sell | O | Buy | O | 2 |
| JBGS | JBG SMITH Properties | Real Estate Investment & Services | 31.050 | Sell | O | N/A | O | |
| SMPL | Simply Good Foods Co | Noncyclical Goods and Svcs | 16.790 | Sell | O | Sell | O | 0 |
| MSI.TR | Motorola Solutions Inc. TR | Communications Technology | 141.261 | Sell | O | Buy | O | 1 |
| Symbol | Company | Sector | Current Price | Action Price | Target | Stop | Notes |
|---|---|---|---|---|---|---|---|
| ICE | IntercontinentalExchange Inc. | Wall Street | $96.35 | 90s | 125 | 77 | 5 for 5'er, top 25% of WALL sector matrix, LT pos mkt RS, multi consec buy signals, 1.3% yield |
| DGX | Quest Diagnostics Incorporated | Healthcare | $122.61 | mid $110s to $130s | $132 | $92 | 4 for 5'er, pullback from AT high, consec buy signals, top 25% of favored healthcare sector, 2.02% yield |
| VRSK | Verisk Analytics, Inc. | Business Products | $170.96 | high 150s to 170s | $184 | $126 | 5 for 5'er, LT market & peer RS buy, consec buy signals, LT pos trend |
| BGS | B&G Foods, Inc. | Food Beverages/Soap | $24.06 | 22 - 24 | 28.50 | 18 | 5 for 5'er, #3 of 70 names in favored FOOD sector matrix, bullish catapult, 8.6% yield, pot. cov write |
| INTC | Intel Corporation | Semiconductors | $62.12 | hi 50s - mid 60s | 73 | 51 | 4 for 5'er, favored SEMI sector matrix, spread triple top, 2.1% yield, pot. covered write |
| CMCSA | Comcast Corporation | Media | $40.78 | hi 30s - low 40s | 48 | 32 | 4 for 5'er, LT mkt RS buy signal, spread quad top breakout, 2.3% yield |
| COP | ConocoPhillips | Oil | $44.20 | low-to-mid 40s | 60 | 35 | 4 for 5'er, top half of favored oil sector matrix, quad top breakout, pos trend flip, 4% yield, R-R>2.0 |
| MDLZ | Mondelez International Inc. | Food Beverages/Soap | $52.22 | 50s | $70 | $41 | 4 for 5'er, consec buy signals, fav DWAFOOD, pos weekly mom flip, 2.19% yield |
| CVX | Chevron Corporation | Oil | $94.69 | uppers 90s | 112 | 77 | 4 for 5'er, favored OIL sector matrix, multiple recent breakouts, 5.6% yield, pot. covered write |
| CONE | CyrusOne Inc | Real Estate | $75.42 | mid-to-upper 70s | 99 | 61 | 5 for 5'er, top 25% of favored REAL sector matrix, spread triple top, pos monthly mom flip, 2.7% yield |
| Symbol | Company | Sector | Current Price | Action Price | Target | Stop | Notes |
|---|---|---|---|---|---|---|---|
| HSBC | HSBC Holding PLC (United Kingdom) ADR | Banks | $24.15 | (26 - 23) | 17 | 28 | 0 for 5'er, bottom third of unfavored BANK sector matrix, LT neg mkt RS, multi sell signals, lower tops and lower bottoms |
| Symbol | Company | Sector | Current Price | Action Price | Target | Stop | Notes |
|---|---|---|---|---|---|---|---|
| KKR | KKR & Co. L.P | Finance | $29.34 | mid-to-upper 20s | 44.50 | 21 | See follow up comment below. |
| Comment |
|---|
| REGN Regeneron Pharmaceuticals, Inc. R ($600.38) - Biomedics/Genetics - We will now raise our stop to $504, the second potential sell signal on REGN's default chart. |
CONE CyrusOne Inc R ($74.43) - Real Estate - CONE is a 5 for 5'er that ranks in the top quartile of the favored real estate sector matrix. In Monday's (6/1) trading the stock broke a spread triple top at $75, marking a sixth consecutive buy signal. The stock now sits at $76 on its default chart, matching its 52-week high and recent flip to positive monthly momentum is a positive sign for its prospects for additional upside. CONE comes with a 2.65% yield. Long exposure may be added in the mid-to-upper $70s and we will set out initial stop at $61, which would take out four levels of support on CONE's default chart. We use the bullish price objective of $99 as our target price.
| 20 | |||||||||||||||||||||||||||||||||||||||||||||||||||||
| 79.00 | X | • | 79.00 | ||||||||||||||||||||||||||||||||||||||||||||||||||
| 78.00 | X | O | • | 78.00 | |||||||||||||||||||||||||||||||||||||||||||||||||
| 77.00 | X | O | • | 77.00 | |||||||||||||||||||||||||||||||||||||||||||||||||
| 76.00 | X | A | • | X | x | 76.00 | |||||||||||||||||||||||||||||||||||||||||||||||
| 75.00 | X | X | O | • | X | O | 6 | 75.00 | |||||||||||||||||||||||||||||||||||||||||||||
| 74.00 | X | O | 9 | O | • | X | O | X | X | X | 74.00 | ||||||||||||||||||||||||||||||||||||||||||
| 73.00 | X | O | X | O | • | X | O | X | O | X | X | O | X | 73.00 | |||||||||||||||||||||||||||||||||||||||
| 72.00 | X | O | X | O | X | • | X | O | 5 | O | X | O | X | O | X | 72.00 | |||||||||||||||||||||||||||||||||||||
| 71.00 | X | O | X | O | X | O | • | • | X | O | X | O | X | O | X | O | 71.00 | ||||||||||||||||||||||||||||||||||||
| 70.00 | X | O | X | O | X | O | • | X | X | • | X | O | X | O | X | O | X | 70.00 | |||||||||||||||||||||||||||||||||||
| 69.00 | X | O | O | B | O | • | X | O | X | O | • | X | O | O | O | 69.00 | |||||||||||||||||||||||||||||||||||||
| 68.00 | X | O | X | O | X | O | X | O | • | X | X | Mid | 68.00 | ||||||||||||||||||||||||||||||||||||||||
| 67.00 | X | O | X | O | X | X | O | X | O | • | X | O | X | 67.00 | |||||||||||||||||||||||||||||||||||||||
| 66.00 | X | O | O | 1 | O | X | O | X | O | • | X | O | X | 66.00 | |||||||||||||||||||||||||||||||||||||||
| 65.00 | X | O | X | X | X | O | X | X | O | O | X | • | X | X | O | X | 65.00 | ||||||||||||||||||||||||||||||||||||
| 64.00 | X | X | X | O | X | O | X | O | X | O | X | O | 2 | O | X | O | • | X | O | X | O | X | 64.00 | ||||||||||||||||||||||||||||||
| 63.00 | X | O | X | O | X | O | X | O | X | O | X | O | X | O | X | • | O | 3 | O | • | X | O | X | O | 63.00 | ||||||||||||||||||||||||||||
| 62.00 | X | O | X | X | O | X | • | C | O | X | O | X | O | O | X | • | O | X | O | • | X | X | O | 62.00 | |||||||||||||||||||||||||||||
| 61.00 | X | O | X | O | X | O | • | O | O | O | • | O | X | O | X | O | X | 61.00 | |||||||||||||||||||||||||||||||||||
| 60.00 | X | O | X | O | 7 | X | • | • | O | O | X | O | X | 60.00 | |||||||||||||||||||||||||||||||||||||||
| 59.00 | • | X | O | X | O | X | O | 8 | • | O | X | X | 4 | X | 59.00 | ||||||||||||||||||||||||||||||||||||||
| 58.00 | X | • | 5 | 6 | X | O | X | O | X | • | O | X | O | X | O | • | 58.00 | ||||||||||||||||||||||||||||||||||||
| 57.00 | X | O | X | O | O | O | X | • | O | X | O | X | X | • | 57.00 | ||||||||||||||||||||||||||||||||||||||
| 56.00 | X | O | X | O | • | O | O | X | O | X | • | 56.00 | |||||||||||||||||||||||||||||||||||||||||
| 55.00 | X | O | • | • | O | X | O | X | • | 55.00 | |||||||||||||||||||||||||||||||||||||||||||
| 54.00 | X | • | O | X | O | X | • | 54.00 | |||||||||||||||||||||||||||||||||||||||||||||
| 53.00 | 4 | • | O | X | O | X | • | 53.00 | |||||||||||||||||||||||||||||||||||||||||||||
| 52.00 | X | • | O | X | O | X | • | 52.00 | |||||||||||||||||||||||||||||||||||||||||||||
| 51.00 | X | • | O | X | O | X | • | Bot | 51.00 | ||||||||||||||||||||||||||||||||||||||||||||
| 50.00 | X | • | O | X | O | X | • | 50.00 | |||||||||||||||||||||||||||||||||||||||||||||
| 49.00 | • | O | O | X | X | • | 49.00 | ||||||||||||||||||||||||||||||||||||||||||||||
| 48.00 | O | X | O | X | • | 48.00 | |||||||||||||||||||||||||||||||||||||||||||||||
| 47.00 | O | X | O | X | • | 47.00 | |||||||||||||||||||||||||||||||||||||||||||||||
| 46.00 | O | X | O | X | • | 46.00 | |||||||||||||||||||||||||||||||||||||||||||||||
| 45.00 | O | O | X | • | 45.00 | ||||||||||||||||||||||||||||||||||||||||||||||||
| 44.00 | O | • | 44.00 | ||||||||||||||||||||||||||||||||||||||||||||||||||
| 20 |
| ADNT Adient plc ($19.59) - Autos and Parts - Adient shares broke a double top at $19 today, marking a sixth consecutive buy signal before continuing further to $19.50. Today's break also marks a positive trend reversal for ADNT and promotes it to a 5 for 5'er. ADNT ranks 2nd of 49 names included in the favored autos and parts sector RS matrix and returned to a market RS buy signal in late April, confirming long-term strength against the broader market. The weight of the evidence is positive.and demand is in control. Okay to add long exposure here or on a pullback as ADNT is approaching heavily overbought levels. Note that support is offered at $16.50. |
| AQUA Evoqua Water Technologies Corp ($19.77) - Utilities/Electricity - Evoqua Water Technologies broke a double top at $20 to mark a fourth consecutive buy signal during today's action. This 3 for 5'er returned to a positive trend in mid-May and ranks 2nd of 48 names included in the utilities/electricity sector RS matrix. Demand is in control and long exposure may be added here or on a pullback, as AQUA is approaching overbought levels here. Note that initial support is offered at $18. |
| BC Brunswick Corporation ($61.38) - Leisure - Brunswich Corporation shares completed a bullish catapult with a break at $60 today to mark a fifth consecutive buy signal before advancing further to $61. BC is a 4 for 5'er that returned to a positive trend in mid-May and ranks 7th of 48 names included in the leisure sector RS matrix. Additionally, BC is one box away from returning to a buy signal on its market RS chart. Overall, the weight of the evidence is positive here. Those considering long exposure may be well served to wait for a pullback, though, as BC is heavily overbought with today's move. Note that initial support is offered at $55 and that BC carries a yield of 1.67%. |
| CACC Credit Acceptance Corp MI ($412.03) - Finance - Credit Acceptance Corp shares reversed up today to complete a bullish triangle at $400, marking a second consecutive buy signal before advancing further past resistance to $416. This 4 for 5'er returned to a positive trend in mid-May and has maintained a market RS buy signal since February of 2015, confirming long-term strength. Additionally, CACC ranks 10th of 70 names included in the favored finance sector RS matrix. Demand is in control. Okay to add long exposure here with support offered at $384. |
| EOG EOG Resources, Inc. ($54.55) - Oil - EOG continued higher Wednesday to mark its fifth consecutive buy signal at $55 before continuing higher to $56 intraday, breaking through its bearish resistance line. This moves the stock back to an overall positive trend, which now gives EOG 4 out of 5 potential technical attributes. The stock also ranks in the top half of the favored oil sector RS matrix. Exposure may be considered on this breakout, with initial support found at $50 and further support offered at $46. The potential for overhead resistance may come initially at $65. Note that EOG also carries a 2.74% yield. |
| GPN Global Payments Inc. ($187.89) - Business Products - Global Payments shares returned to a buy signal with a double top break at $184 today before advancing past resistance to $188. This 5 for 5'er returned to a positive trend in late April and has maintained a market RS buy signal since August of 2015, confirming long-term strength against the broader market. Additionally, GPN ranks in the top third of the favored business products sector RS matrix. Okay to add here on the breakout as demand is in control. Note that initial support is offered at $174. |
| GSHD Goosehead Insurance, Inc. Class A ($65.88) - Insurance - Goosehead Insurance shares broke a double top at $63 today, marking a fifth consecutive buy signal before advancing further past resistance to a new all-time high of $66. This strong 5 for 5'er moved to a positive trend in April and a market RS buy signal in May. Additionally, GSHD ranks 9th of 67 names included in the insurance sector RS matrix. Although demand is in control, GSHD is heavily overbought with today's move. Those considering long exposure may be best served to wait for a pullback to the mid to low $60s, noting that support is offered at $56. |
| HEI Heico Corporation ($110.07) - Aerospace Airline - Heico shares reversed up today to break a double top at $110 and mark a fourth consecutive buy signal. This strong 5 for 5'er returned to a positive trend in May but has maintained a market RS buy signal since 2003, confirming long-term strength. Additionally, HEI ranks in the top quartile of the favored aerospace airline sector RS matrix and is a holding in the DWA Aerospace & Airlines Sector Portfolio. Demand is in control and long exposure may be added here on a pullback as HEI is approaching overbought levels. Note that initial support is offered at $102. |
| ITGR Greatbatch Technologies, Inc. ($84.19) - Electronics - Greatbatch Technologies returned to a buy signal with a spread quadruple top break (that resembles a shakeout pattern) at $84 during today's action. This strong 5 for 5'er returned to a positive trend in May but has maintained a market RS buy signal since 2018, confirming long-term strength. Additionally, ITGR ranks in the top third of the favored electronics sector RS matrix. Okay to add here on the breakout as the technical picture is sound. Note that support is offered at $76. |
| JACK Jack in the Box, Inc. ($69.67) - Restaurants - Jack in the Box shares broke a double top at $70 today to mark a seventh consecutive buy signal before advancing further past resistance to $71. JACK is a 4 for 5'er that returned to a positive trend in May and moved to a market RS buy signal in April. Additionally, the stock ranks 3rd of 26 names included in the favored restaurants sector RS matrix. Demand is in control and long exposure may be added here individually or through the DWA Restaurants Sector Portfolio, of which JACK is a holding. Note that support is offered at $61. |
| Name | Option Symbol | Action | Stop Loss |
|---|---|---|---|
| Best Buy Co., Inc. - $82.32 | BBY2018I75 | Buy the September 75.00 calls at 12.90 | 75.00 |
| Name | Option | Action |
|---|---|---|
| The Blackstone Group Inc ( BX) | Sep. 50.00 Calls | Raise the option stop loss to 8.85 (CP: 10.85) |
| Electronic Arts Inc. ( EA) | Sep. 115.00 Calls | Stopped at 14.45 (CP: 12.65) |
| Electronic Arts Inc. ( EA) | Sep. 110.00 Calls | Stopped at 12.60 (CP: 12.65) |
| Square Inc ( SQ) | Sep. 80.00 Calls | Raise the option stop loss to 15.65 (CP: 17.65) |
| Name | Option Symbol | Action | Stop Loss |
|---|---|---|---|
| Altria Group Inc. - $40.35 | MO2018U45 | Buy the September 45.00 puts at 6.80 | 43.00 |
| Name | Option | Action |
|---|---|---|
| FedEx Corporation (FDX) | Jun. 165.00 Puts | Stopped at 136.00 (CP: 138.09) |
| Exelon Corporation (EXC) | Oct. 38.00 Puts | Stopped at 40.00 (CP: 39.87) |
| Newell Brands Inc. (NWL) | Sep. 15.00 Puts | Stopped at 15.00 (CP: 15.08) |
| Lumentum Holdings Inc (LITE) | Sep. 75.00 Puts | Stopped at 77.00 (CP: 78.31) |
| Xerox Corporation (XRX) | Oct. 20.00 Puts | Raise the stock price stop loss to 18.50 (CP: 18.25) |
| Name | Option Sym. | Call to Sell | Call Price | Investment for 500 Shares | Annual Called Rtn. | Annual Static Rtn. | Downside Protection |
|---|---|---|---|---|---|---|---|
| Hess Corporation $51.74 | HES2021H55 | Aug. 55.00 | 3.95 | $24,375.45 | 54.28% | 32.12% | 6.50% |
| Name | Action |
|---|---|
| Micron Technology, Inc. (MU) - 46.82 | Sell the October 50.00 Calls. |
| Intel Corporation (INTC) - 62.12 | Sell the September 65.00 Calls. |
| Live Nation Entertainment Inc. (LYV) - 50.53 | Sell the October 55.00 Calls. |
| Phillips 66 (PSX) - 81.57 | Sell the August 82.50 Calls. |
| Name | Covered Write |
|---|---|
| Chevron Corporation ( CVX - 94.69 ) | September 95.00 covered write. |
| The Walt Disney Company ( DIS - 118.75 ) | September 120.00 covered write. |
| The PNC Financial Services Group Inc. ( PNC - 114.86 ) | August 115.00 covered write. |
Daily Equity & Market Analysis
Loading, Please Wait...
