
Most Requested Symbols

Although Taiwan has not seen as much focus recently, its equity market has certainly demonstrated notable technical improvement, as we highlight through the iShares MSCI Taiwan ETF (EWT).
We discuss recent changes in the fund structure of the United States Oil Fund (USO).
Today's featured stock is Comcast Corporation (CMCSA).
ICPT, FFIN, BHF, ADC, BLK, PCTY, PSX, SRE, HON, & MBUU
Call: Williams Companies (WMB), Put: Loews Corp (L), Covered Write: JP Morgan (JPM)
Team Builder Webinar: Want to learn more about how to effectively use the Team Builder tool? Join us on Thursday, May 28th at 1 pm as we navigate through Team Builder and discuss use cases. Register here.
Replay for FSM Models Webinar: We have a replay available for our latest webinar on Applying the Fund Score Method through FSM Models, which took place on Thursday, May 21st. This webinar featured an overview of the various FSM strategies and offered potential implementation ideas. Click here to view the replay.
Market Webinar Replay: We also have a video replay and slides available from our lastest Market Update Webinar from Tuesday, May 26th:
Core Solutions: Late last year, AdvisorShares launched two ETFs that are based on FSM models available on the research platform: the FSM Core Solution US Core 2S PR4050 and FSM CoreSolution All Cap World 2S PR4050. The respective products, the AdvisorShares Dorsey Wright FSM U.S. Core ETF DWUS and the AdvisorShares Dorsey Wright FSM All Cap World ETF DWAW, follow the same inventory guidelines in which the fund score is used to determine the first and second-ranked ETFs from a list of highly liquid, core-based funds. As the names suggest, the U.S. Core model derives its holdings from a purely large-cap domestic equity constituency, whereas All Cap World draws from a wider list that includes size and style ETF constituents, as well as international core products should relative strength lean in that direction. However, the manner in which the ETFs will raise cash is different. DWUS and DWAW are updated on a seasonal quarter basis, but instead of reviewing the PR4050 offense/defense indicator that is evaluated for specific FSM models on a monthly basis, the strategies review the indicator weekly. If triggered, the strategies incrementally increase or decrease cash exposure by scaling into a defensive or offensive allocation (source: AdvisorShares). Both strategies serve well as core-equity exposure foundations that allow for tactical leaning toward stylistic changes within the core while maintaining the integrity of broad-market, multi-sector, and beta-like exposure.
On the year, both models and model-based ETFs have outperformed their respective model benchmarks, as shown below. Additionally, each respective fund scores above the sought-after optimal 4.00 fund score threshold, suggesting both absolute and relative strength. For more information on each fund, please visit the AdivosrShares website for DWUS and DWAW.


Each week the analysts at DWA review and comment on all major asset classes in the global markets. Shown below is the summary or snapshot of the primary technical indicators we follow for multiple areas. Should there be changes mid-week we will certainly bring these to your attention via the report.
| Universe | BP Col & Level (actual) | BP Rev Level | PT Col & Level (actual) | PT Rev Level | HiLo Col & Level (actual) | HiLo Rev Level | 10 Week Col & Level (actual) | 10 Week Rev Level | 30 Week Col & Level (actual) | 30 Week Rev Level |
|---|---|---|---|---|---|---|---|---|---|---|
| ALL |
|
44% |
|
28% |
|
62% |
|
74% |
|
24% |
| NYSE |
|
52% |
|
30% |
|
58% |
|
78% |
|
16% |
| OTC |
|
42% |
|
28% |
|
64% |
|
72% |
|
28% |
| World |
|
50% |
|
26% |
|
|
|
64% |
|
22% |
Over the course of the past few months, we have been through the wringer with respect to the market. On February 19th, 2020, the S&P 500 was at an all-time high of 3390, and just over a month later the S&P 500 was down at 2200 in what felt like the blink of an eye. It was the fastest fall of more than 20% off a market high. In the middle of all that, the nearly four-year reign of Domestic Equity came to an end as the number one ranked asset class in DALI. On March 13th, Domestic Equity slipped out of the top two spots and ultimately fell to number four. As the market has recovered back to the 3000 level, Domestic Equity has improved back to number three but is taking aim back at one of the top two spots. What will it take for that to happen?
The DALI tool is meant to be a big picture, long-term view of where we see relative strength in the global marketplace, with the key term in this evaluation being the relative strength nature of the comparison. DALI is built using underlying relative strength comparisons of various funds from each asset class in a large relative strength matrix, which we then aggregate into the broad rankings you see displayed on the page. Each asset class has an equal amount of broad representative ETFs that we use in the underlying matrix, which is meant to embody the significant aspects of the six broad asset classes. As an example, we have compiled an example matrix below that uses three representatives from each asset class in a matrix, showing how each of the buy signals from each representative asset class is added together to get the tally signal count for the asset class as a whole. Keep in mind that the actual matrix underlying the DALI tool is much larger, looking at almost 1100 total signals, and will, therefore, vary from the example we have provided below.

The aggregate signal count of the DALI tool causes it to be something that does not change very often, leading to significant shifts when we do see a change. These changes are also not undone easily, as the signal changes that led to the movement of the asset classes need to be reversed before we can see an asset class rise in the rankings.
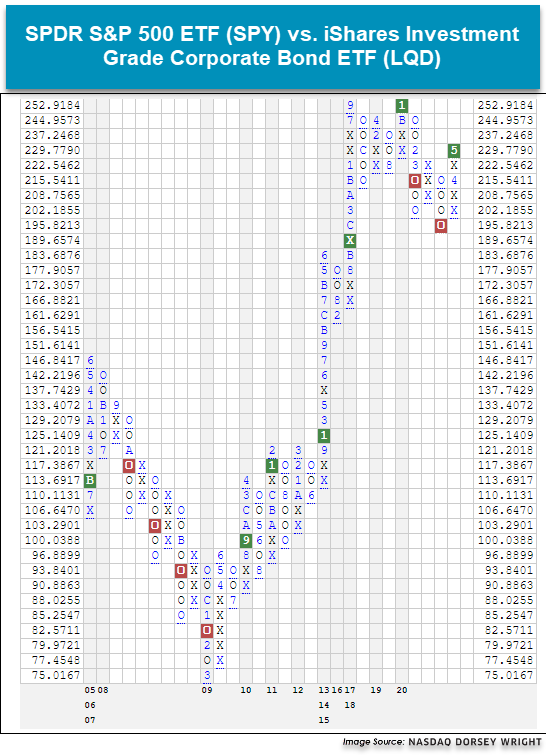
There are currently 61 signals separating the number two ranked asset class (Fixed Income) from Domestic Equity. At it’s widest margin, that number was 107, meaning there were 107 buy signals separating Fixed Income from Domestic Equity. We have seen a meaningful closing of the gap but still have some work to do. There are a number of RS charts that have returned to buy signals for US Equity, like the chart of the S&P 500 ETF SPY versus iShares Investment Grade Corporate Bond LQD.
The reality is, as we stand now, there are also a number of RS charts that did not experience the back and forth action due to the speed and velocity of the sell-off in Feb/March and the speed of the recovery since late March. So, there are some charts that look like the S&P 500 SPX versus iShares Aggregate Bond ETF AGG that are still a number of boxes away from returning to buy signals if this market continues to go up from here. On the other hand, reversals back down on these RS charts would setup potential buy signals from a lower level.

While the SPX versus AGG is the “scary” example of what it would take to see Domestic Equity return to the number one or two position, the fate of DALI doesn’t hinge on one specific chart. As we outlined above, it is the culmination of all of the Domestic Equity representatives versus all of the representatives from all of the other asset classes. One way to think about this is college football. Remember what that is? It has been since we’ve been able to actually watch a live sporting event that it seems like a foreign concept, but think about college football for a minute. There are a number of different conferences, and within those conferences, there are a number of different teams. Here, the conferences are like the asset classes in DALI. If the Clemson football team, who’s in the ACC, goes out and beats Alabama who’s in the SEC, does that mean that the ACC overall is a better conference than the SEC? Not necessarily. It would mean that Clemson was the better team. We would need to set up a tournament where all of the teams from the ACC played all of the teams from the SEC and tally up the win-loss record. The conference with the highest number of collective wins would be deemed the better conference.
This is how we view DALI. With that said, through Tuesday’s (5/26) close, there were about 30 RS relationships within 10% of returning to buy signals for Domestic Equity, and about half of those are within 5%. So, this means that if we see dispersions of another 10% between these Domestic Equity components, Domestic Equity has the ability to pick up another 30 signals and a number of those would come at the expense of Fixed Income. Such action would narrow the gap substantially. This doesn’t necessarily mean that the market has to go up another 10% as it’s the dispersion between the two things that is important. So, the market could go up 5% and the other side could go down 5%, or any combination to get to a 10% difference. Another thing that we will continue to watch is some of the weaker asset classes “stealing” signals from the more defensive asset class. As a result of Tuesday’s market action, International Equity picked up 8 new buy signals, and most of those came at the expense of Cash and Fixed Income. There are another 26 RS charts that are close to returning to RS buy signals and a number of those are against Fixed Income representatives.
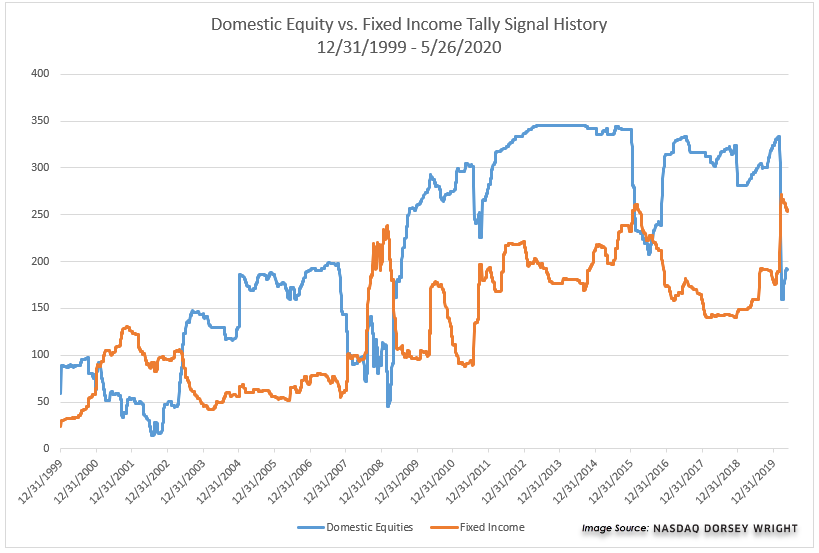
Below is a chart of the historical tally signals for Domestic Equity and Fixed Income. This current period is just the fourth time where the tally signal count for Fixed Income is higher than Domestic Equity. The previous time periods were February 2001 to June 2003, July 2008 to May 2009, and February 2016 to August 2016.

| Symbol | Name | Price | Yield | PnF Trend | RS Signal | RS Col. | Fund Score | 200 Day MA | Weekly Mom |
|---|---|---|---|---|---|---|---|---|---|
| DIA | SPDR Dow Jones Industrial Average ETF Trust | 250.25 | 2.35 | Positive | X | 3.28 | 263.18 | +7W | |
| EEM | iShares MSCI Emerging Markets ETF | 37.23 | 2.62 | Negative | Sell | O | 0.93 | 40.57 | +7W |
| EFA | iShares MSCI EAFE ETF | 58.58 | 3.67 | Negative | Sell | O | 1.95 | 63.31 | +7W |
| FM | iShares MSCI Frontier 100 ETF | 23.43 | 4.05 | Negative | Sell | O | 0.40 | 27.18 | +7W |
| IJH | iShares S&P MidCap 400 Index Fund | 175.19 | 1.97 | Positive | Buy | O | 2.42 | 185.16 | +7W |
| IJR | iShares S&P SmallCap 600 Index Fund | 66.39 | 1.81 | Negative | Buy | O | 1.14 | 74.03 | +7W |
| QQQ | Invesco QQQ Trust | 229.04 | 0.72 | Positive | Buy | X | 5.80 | 204.19 | +7W |
| RSP | Invesco S&P 500 Equal Weight ETF | 99.42 | 2.22 | Positive | Buy | X | 2.20 | 105.08 | +7W |
| SPY | SPDR S&P 500 ETF Trust | 299.08 | 1.94 | Positive | O | 3.59 | 299.59 | +7W | |
| XLG | Invesco S&P 500 Top 50 ETF | 228.29 | 1.62 | Positive | O | 5.24 | 219.92 | +7W |
It was a strong week across the board for the 10 major market funds covered in this report as all finished in positive territory. The leader of the week was the iShares S&P SmallCap 600 Index Fund IJR, up 7.92%, while the iShares MSCI Emerging Markets ETF EEM lagged the group despite returning 0.24%. In the table below, we have updated initial support levels for all 10 major market funds covered in this report. Additionally, today we want to bring two notable trend changes to your attention from our major market ETF universe.

The first trend change occurred on the chart of the SPDR Dow Jones Industrial Average ETF Trust DIA as a result of Tuesday’s (5/26) intraday price action. Looking at DIA’s default chart below, we find that yesterday the fund broke a double top at $250, marking the third consecutive buy signal on the chart as demand has the upper hand. This move also broke through DIA’s bearish resistance line, turning the overall trend back to positive for the first time since flipping negative during the March sell-off. From current levels DIA faces resistance at the $270 and $295 level, the latter being DIA’s all-time high reached in late-February. Currently, DIA has a fund score of 3.28 and is outscoring the average all US fund by 0.33 score points as well as the average US large-cap value fund by 0.94 score points. DIA’s recent breakout has established support at $230, with further support offered at $210. Year-to-date DIA is down -12.22%, underperforming the S&P 500 Index SPX by 4.82% (through 5/26).

The second major market trend change materialized on the chart of the iShares S&P SmallCap 600 Index Fund IJR during Wednesday’s (5/27) trading session. As we mentioned above, we have seen the IJR rally nearly 8% following last week’s double top breakout at $64, outpacing all other major market funds for the week. On Wednesday, the IJR continued to push higher to $68, breaking through the small-cap fund’s bearish resistance line that had been in place since late-February. As a result, IJR, along with the other six US major market ETFs covered in this report, is now trading in an overall positive trend. Currently, IJR possesses a relatively weak fund score of 1.14. As a result, we will remain on the sidelines until IJR is able to demonstrate additional follow-through and improved relative strength, which would be reflected via a fund score over the 3-threshold. IJR has initial support offered at $55 while its first level of overhead resistance sits at $76. Even with its recent rally, IJR is down a whopping -20.82% year-to-date, underperforming the SPX by 13.42%.

SECTOR BULLISH PERCENT CHANGES
| Reversed to X | Reversed to O |
|---|---|
| 15 (BPBANK | 38), (BPBUSI | 54), (BPCOMP | 44), (BPELEC | 54), (BPEUTI | 44), (BPFINA | 46), (BPGUTI | 40), (BPINET | 60), (BPOIL | 42), (BPPROT | 48), (BPREAL | 44), (BPSEMI | 72), (BPTELE | 44), (BPTRAN | 48), (BPWALL | 62), |
0 |
| To Xs | To Os |
|---|---|
| Software ( 0.4 to 64 ) | Precious Metals ( 0.89 to 48 ) |
Average Level
51.88
| Sector |
|---|
| Savings & Loans (20%) - Bear Confirmed |
| Sector |
|---|
| Banks (38%) - Bull Alert |
| Computers (44%) - Bull Confirmed |
| Drugs (50%) - Bull Alert |
| Utilities / Electric (44%) - Bear Correction |
| Finance (46%) - Bull Confirmed |
| Utilities / Gas (40%) - Bear Correction |
| Healthcare (50%) - Bull Confirmed |
| Insurance (44%) - Bull Alert |
| Media (48%) - Bull Confirmed |
| Oil (42%) - Bear Correction |
| Protection Safety Eq (48%) - Bear Correction |
| Real Estate (44%) - Bull Alert |
| Steel/Iron (40%) - Bull Alert |
| Telephone (44%) - Bull Confirmed |
| Transports / Non Air (48%) - Bear Correction |
| Waste Management (40%) - Bull Alert |
| Sector |
|---|
| Software (58%) - Bull Correction |
SECTOR INDICATOR CHART CHANGES
PT is the percentage of stocks within a sector that are trading above their bullish support lines. RSX is the percentage of stocks within a sector whose relative strength charts are in a column of Xs. RSP is the percentage of stocks within a sector whose relative strength charts are on a buy signal. The strongest sectors, i.e. market leaders, will have most of these indicators positive and moving higher in a column of Xs.
|
There were only rising sector PT charts this week, with 27 rising and none moving lower. The following sector charts rose: Autos and Parts [^PTAUTO], Biomedics/Genetics [^PTBIOM], Building [^PTBUIL], Business Products [^PTBUSI], Chemicals [^PTCHEM], Drugs [^PTDRUG], Electronics [^PTELEC], Utilities/Electricity [^PTEUTI], Finance [^PTFINA], Forest Prods/Paper [^PTFORE]-Rev. , Gaming [^PTGAME], Gas Utilities [^PTGUTI]-Rev. , Healthcare [^PTHEAL], Household Goods [^PTHOUS], Internet [^PTINET], Leisure [^PTLEIS], Machinery and Tools [^PTMACH]-Rev. , Media [^PTMEDI], Metals Non Ferrous [^PTMETA], Oil [^PTOIL], Real Estate [^PTREAL], Restaurants [^PTREST], Retailing [^PTRETA], Semiconductors [^PTSEMI], Software [^PTSOFT], Textiles/Apparel [^PTTEXT], Wall Street [^PTWALL]. There were 3 that reversed to X. |
|
| ^PT Charts Reversing Up - | ^PT Charts Reversing Down - |
|
|
|
| ^PT Charts Moving Higher - | ^PT Charts Moving Lower - |
|
|
|
There were mostly falling sector RSX charts this week, with 11 falling and 6 rising. The following sector charts rose: Aerospace Airline [^RSXAERO]-Rev. , Building [^RSXBUIL], Gaming [^RSXGAME], Leisure [^RSXLEIS]-Rev. , Metals Non Ferrous [^RSXMETA]-Rev. , Savings & Loans [^RSXSAVI]. The following sector charts fell: Biomedics/Genetics [^RSXBIOM]-Rev. , Drugs [^RSXDRUG]-Rev. , Electronics [^RSXELEC]-Rev. , Utilities/Electricity [^RSXEUTI], Food Beverages/Soap [^RSXFOOD], Forest Prods/Paper [^RSXFORE], Internet [^RSXINET]-Rev. , Precious Metals [^RSXPREC]-Rev. , Restaurants [^RSXREST], Telephone [^RSXTELE], Wall Street [^RSXWALL]. Drugs [^RSXDRUG] was the only sector RSX chart that moved to a sell signal, while none moved to a buy signal. |
|
| ^RSX Charts Reversing Up - | ^RSX Charts Reversing Down - |
| ^RSX Charts Moving Higher - | ^RSX Charts Moving Lower - |
|
There were only rising sector RSP charts this week, with 16 rising and none moving lower. The following sector charts rose: Biomedics/Genetics [^RSPBIOM], Building [^RSPBUIL], Business Products [^RSPBUSI]-Rev. , Chemicals [^RSPCHEM], Food Beverages/Soap [^RSPFOOD], Gaming [^RSPGAME], Household Goods [^RSPHOUS], Internet [^RSPINET], Leisure [^RSPLEIS], Media [^RSPMEDI], Oil [^RSPOIL], Precious Metals [^RSPPREC], Retailing [^RSPRETA], Software [^RSPSOFT], Telephone [^RSPTELE], Textiles/Apparel [^RSPTEXT]. There were 1 that reversed to X. |
|
| ^RSP Charts Reversing Up - | ^RSP Charts Reversing Down - |
|
|
| ^RSP Charts Moving Higher - | ^RSP Charts Moving Lower - |
|
|
FAVORED SECTOR STATUS CHANGES
A sector is considered to be Favored if it has 3 or 4 of the sector indicators (Relative Strength, RSX, RSP, & PT) positive, Average if it has 2 of the 4 indicators positive, & Unfavored if it has 0 or 1 of the indicators positive. The table below contains those sectors that have experienced a Favored Sector Status change over the past week. It is best to focus on sectors that are about 50% or lower on their Bullish Percent charts & are in Xs. Note: If a sector moves from Favored to Average, it doesn't necessarily mean that the sector in question has to be sold - it just means you need to evaluate your individual positions with exposure to that sector.
| Changes since 05/20/2020 | Full Report |
|
|
|
|
|||||||||
|
|
|
|
|
|
|||||||
|
|
|
|
|
|||||||
|
|
|
|
|
|
|||||||

Broad international equities have largely continued higher over the past week, with the iShares MSCI EAFE ETF EFA moving higher to $59 in intraday trading Wednesday, placing the fund just one box shy of its longer-term bearish resistance line. The iShares MSCI Emerging Markets ETF EEM has shown muted gains, however, the fund still sits at a double top formation at $37.50. A movement to $38 would not only lead the fund to a third consecutive buy signal but would also break through EEM’s respective bearish resistance line to place the fund back in an overall positive trend. While we have seen continued improvement in the broader emerging markets space, there has been more improvement from some individual factors within international equities, namely momentum.
The Invesco DWA Emerging Markets Momentum Portfolio PIE has shown a substantial move to the upside, as the fund advanced off of its near-term low of $12 to recently give its third consecutive buy signal at $16.50, which also moved the fund back to an overall positive trend in mid-May before it continued higher to its current chart position of $16.75. PIE has also demonstrated strength from a fund score perspective, with a recent score posting of 3.23 besting the average emerging markets fund (1.72) as well as the average non-US fund (1.77), paired with a positive score direction of 1.67.

In order to review which areas this leadership-seeking strategy is positioned towards, we can take a look underneath the hood at the individual country allocation of the portfolio. In doing so, we see, perhaps unsurprisingly, that China represents the highest weighting of any country in the portfolio at over 43% of the allocation. China has maintained its positing as the highest-scoring international group on the Asset Class Group Scores (ACGS) page throughout this market turbulence, which has been a continued focus of our international equity research over the past few weeks. Interestingly enough, we see that Taiwan makes up a significant portion of the remaining portfolio allocation, at 36% of the fund. This puts almost 80% of PIE’s allocation in only two countries, China and Taiwan.

(Source: invesco.com)
Although Taiwan has not seen as much focus recently, its equity market has certainly demonstrated notable technical improvement, as we can see through the iShares MSCI Taiwan ETF EWT, which fell to give three consecutive sell signals earlier this year before moving to a new multi-year low at $29.50 in March. Since that time, however, EWT has improved drastically, returning to a buy signal at $34.50 in April before pushing further to $37.50 in trading on Tuesday, which broke through the fund’s bearish resistance line and places it back in an overall positive trend. EWT has also maintained a fund score north of 3.90 since the end of April, which outpaces the average Asia fund of 2.41. The near-term rally has left the fund on a rather large stem, however, near-term support can be found at $32.50. From current levels, overhead resistance may come initially around $39 from March of this year.

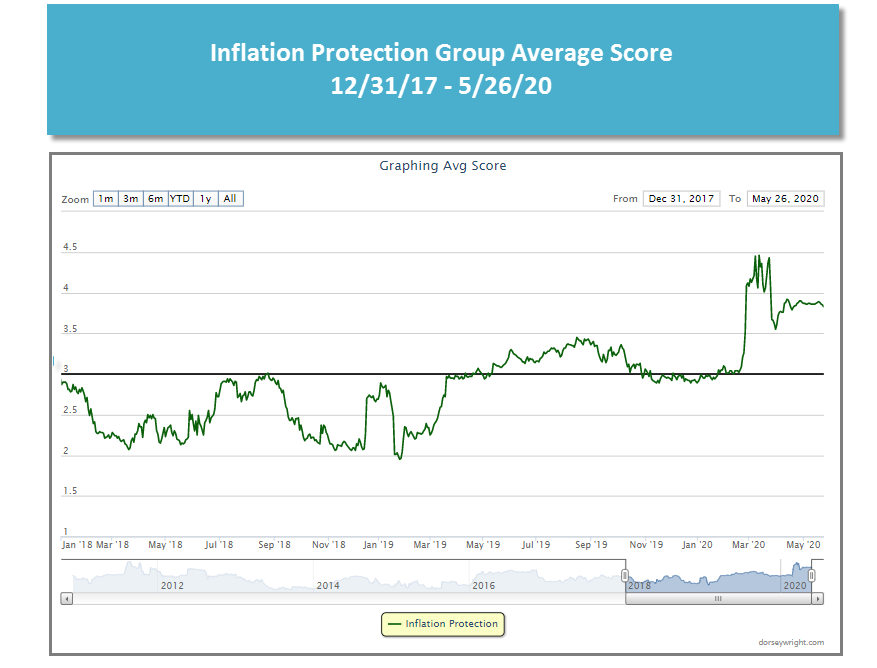
Some analysts and investors have expressed concerns that the fiscal and monetary stimulus efforts undertaken to combat the economic slowdown due to the COVID-19 could result in heightened inflation. As a general rule, inflation is good for borrowers and bad for lenders, and, of course, lenders include bondholders. If you are concerned about higher inflation, one way to hedge that risk is through the use of inflation protected securities. Within the Asset Class Group Scores system, we have seen the average score of the Inflation Protection group rise from around 3.0 at the beginning of February, to a peak north of 4.0 in March, and then pull back slightly to its current level of 3.83, which puts it in sixth place among all fixed income groups. The primary inflation protected securities for domestic investors are U.S. Treasury Inflation Protected Securities (TIPS), which are issued by the U.S. government.
One additional characteristic of TIPS funds that investors should be aware of is that they tend to have a relatively high duration (i.e. interest rate sensitivity). The iShares TIPS Bond ETF TIP for example has an effective duration of 7.83 years, which is actually greater than the effective duration of the iShares Core U.S. Aggregate Bond ETF AGG at 5.72 years. While longer duration is not bad per se, it does mean that the fund can be expected to lose (gain) value if interest rates rise (fall), and investors may be concerned about adding duration exposure given that interest rates are currently at historically low levels.
If you're concerned about inflation, but also concerned about the duration exposure of a TIPS fund, one alternative you can consider is the Index IQ Real Return ETF CPI. CPI is part of the IQ Alternative Allocation Model IQALT universe, which is itself designed to be an alternative to traditional fixed income without the same strong negative correlation to interest rates. CPI tracks an index that seeks to provide a "real return" or a return above the rate of inflation, thereby providing a hedge against the U.S. inflation rate, as represented by the Consumer Price Index. The fund holds a mix of fixed income, equities, and real assets. As of April 30th, its portfolio consisted of approximately 83% short-term bonds, 10% equities, and 7% real assets. (Source: New York Life Investment).
Remember, these are technical comments only. Just as you must be aware of fundamental data for the stocks we recommend based on technical criteria in the report, so too must you be aware of important data regarding delivery, market moving government releases, and other factors that may influence commodity pricing. We try to limit our technical comments to the most actively traded contracts in advance of delivery, but some contracts trade actively right up to delivery while others taper off well in advance. Be sure you check your dates before trading these contracts. For questions regarding this section or additional coverage of commodities email james.west@dorseywright.com.
Data represented in the table below is through 05/26/2020:
Broad Market Commodities Report
| Symbol | Name | Price | PnF Trend | RS Signal | RS Col. | 200 Day MA | Weekly Mom |
|---|---|---|---|---|---|---|---|
| CL/ | Crude Oil Continuous | 34.13 | Negative | Buy | X | 46.99 | +5W |
| DBLCIX | Deutsche Bank Liquid Commodities Index | 243.36 | Negative | Sell | O | 293.23 | +7W |
| DWACOMMOD | DWA Continuous Commodity Index | 446.25 | Negative | Buy | O | 460.57 | +6W |
| GC/ | Gold Continuous | 1727.10 | Positive | Buy | X | 1567.14 | -3W |
| HG/ | Copper Continuous | 2.43 | Negative | Buy | O | 2.56 | +6W |
| ZG/ | Corn (Electronic Day Session) Continuous | 319.50 | Negative | Buy | O | 364.02 | +4W |
While 2020 has been an especially volatile year for oil investors so far, it is worth pointing out that providers of oil funds have also experienced immense levels of uncertainty. Recall that in late April, Barclays liquidated its iPath Series B S&P GSCI Crude Oil Total Return Index ETN (OIL) after then front-month (May 20’) contracts plunged to negative prices and pushed the note’s underlying index below $0. The United States Oil Fund USO, which at the time sought to also track front-month commodity exposure, was fortunate in that its original portfolio methodology timed the roll to the next month's contract prior to the April 21st negative price prints and thus avoided a similar fate. In response to this, on April 27th, USO changed its underlying holding structure to a much more evenly-distributed position across the futures curve for West Texas Intermediate crude oil from the originally front-heavy structure that provided near-term commodity exposure and subsequent rolls (source: Marketwatch). Additionally, the fund underwent a 1 for 8 reverse split on April 28th.

This change in holdings is helpful for investors, in theory, for a few reasons. The first of which pertains to the potential for negative prices that were realized by now-closed OIL. The second helps to mitigate negative roll yield, which is experienced by commodities futures investors when the front-month futures contract is trading below the immediate forward month contract. Mechanically, this can be thought of as a step up in cost to maintain exposure to the same underlying commodity. For example, if July contracts are trading at $33 and August contracts are trading at $35, an investor would have to sell at $33 and buy at $35, which is destructive toward the initial capital position. This example is also visible in action by viewing USO in comparison to the United States 12 Month Oil Fund USL, which owns the 12-month forward contract for crude. Considering USO’s holding structure was front-heavy until late April, we notice a significant difference in the year-to-date performance divergence between the two as USO is down a whopping -74.96% while USL is down a less-remarkable -41.93%.
Another wrinkle in this oil-drama is the recent news that USO has been cut off by its broker, RBC Capital Markets, from buying futures. According to an SEC filing submitted last Thursday (5/21) "USO may be required to invest in other permitted investments including other oil-related interests and may hold larger amounts of Treasuries, cash and cash equivalents, which will further impair USO's ability to meet its investment objective…” USO’s parent provider, United States Commodity Funds, is seeking additional Futures Commission Merchants agreements with other brokers at this time but has yet to enter such an agreement. The fund is still trading and able to rebalance and roll its portfolio, according to USCF CEO John Love (source: MarketInsider). Despite the drama USO has grown from $1.17 billion in assets under management (AUM) from 12/31/19 to over $4.5 billion as of 5/26’s close (source: FactSet).
As always, it is important to know what you own before and in this case, while, you own it. USO remains technically-weak on a long-term basis with a fund score of 0.93 on the back of a negative score direction of -2.06. In the near-term, the fund trades on a buy signal in a column of Os at $24.50, with support offered at $18.50 and overhead resistance found at $27.
Average Level
30.73
| AGG | iShares US Core Bond ETF |
| USO | United States Oil Fund |
| DIA | SPDR Dow Jones Industrial Average ETF |
| DVY | iShares Dow Jones Select Dividend Index ETF |
| DX/Y | NYCE U.S.Dollar Index Spot |
| EFA | iShares MSCI EAFE ETF |
| FXE | Invesco CurrencyShares Euro Trust |
| GLD | SPDR Gold Trust |
| GSG | iShares S&P GSCI Commodity-Indexed Trust |
| HYG | iShares iBoxx $ High Yield Corporate Bond ETF |
| ICF | iShares Cohen & Steers Realty ETF |
| IEF | iShares Barclays 7-10 Yr. Tres. Bond ETF |
| LQD | iShares iBoxx $ Investment Grade Corp. Bond ETF |
| IJH | iShares S&P 400 MidCap Index Fund |
| ONEQ | Fidelity Nasdaq Composite Index Track |
| QQQ | Invesco QQQ Trust |
| RSP | Invesco S&P 500 Equal Weight ETF |
| IWM | iShares Russell 2000 Index ETF |
| SHY | iShares Barclays 1-3 Year Tres. Bond ETF |
| IJR | iShares S&P 600 SmallCap Index Fund |
| SPY | SPDR S&P 500 Index ETF Trust |
| TLT | iShares Barclays 20+ Year Treasury Bond ETF |
| GCC | WisdomTree Continuous Commodity Index Fund |
| VOOG | Vanguard S&P 500 Growth ETF |
| VOOV | Vanguard S&P 500 Value ETF |
| EEM | iShares MSCI Emerging Markets ETF |
| XLG | Invesco S&P 500 Top 50 ETF |
Relative strength is a measure of how a stock is performing when compared to something else, in this case the S&P 500 Equal Weighted Index (SPXEWI). Each day the stock's closing price is divided by that of the SPXEWI, the resulting numbers decimal is moved two places and then plotted on a Point & Figure chart. Whenever the relative strength chart shows a double top buy signal (e.g. RS Buy or Positive Relative Strength), it suggests the stock is likely to outperform the market for the foreseeable future. Conversely, whenever the relative strength chart gives a double bottom sell signal (e.g. RS Sell or Negative Relative Strength) it suggests the stock will under-perform the market. Relative strength signals tend to last roughly 18 to 24 months on average. Consequently, changes from buy signals to sell signals (and vice versa) are important to be aware of as they are longer-term implications of a stock's likely performance versus the indices. Using the Point & Figure chart along with the relative strength chart will allow you to better ascertain risk-reward and other trade management tools, but we always want to over-weight our portfolios toward those stocks that are on RS buy signals, giving us the best chance of outperforming the broader market.
In the Optionable Universe, this week we saw 54 relative strength buy signals compared to 45 last week. On the sell side, there were 9 relative strength sell signals compared to 30 last week.
| Symbol | Company | Sector | Price | RS vs Market Signal | RS vs Market Column | RS vs Peer Signal | RS vs Peer Column | Tech Attrib |
|---|---|---|---|---|---|---|---|---|
| ABG | Asbury Automotive Group Inc. | Retail | 77.390 | Buy | X | Buy | X | 3 |
| ABMD | Abiomed, Inc | Medical Products | 209.080 | Buy | X | Sell | X | 3 |
| RAMP | Liveramp Holdings Inc. | Industrial Goods & Svcs | 47.150 | Buy | X | Buy | X | 5 |
| BYD | Boyd Gaming Corp | Cyclical Goods and Services | 20.380 | Buy | X | Sell | X | 3 |
| CAR | Avis Budget Group, Inc. | Noncyclical Goods and Svcs | 18.610 | Buy | X | Sell | X | 3 |
| CIR | CIRCOR International, Inc. | Industrial Goods & Svcs | 16.390 | Buy | X | Buy | X | 4 |
| CVCO | Cavco Industries, Inc. | Construction | 202.450 | Buy | X | Buy | X | 5 |
| DCO | Ducommun Inc | Industrial Goods & Svcs | 31.590 | Buy | X | Sell | X | 3 |
| DECK | Deckers Outdoor Corporation | Cyclical Goods and Services | 180.050 | Buy | X | Buy | X | 5 |
| FUN | Cedar Fair L.P. | Cyclical Goods and Services | 34.860 | Buy | X | Buy | X | 3 |
| GPI | Group 1 Automotive, Inc. | Retail | 68.930 | Buy | X | Buy | X | 4 |
| HZO | Marinemax | Retail | 19.710 | Buy | X | Buy | X | 5 |
| CATM | Cardtronics PLC | Financial Services | 26.780 | Buy | X | Sell | X | 3 |
| ASPS | Altisource Portfolio Solutions SA (Luxembourg) ADR | Financial Services | 15.410 | Buy | X | Buy | X | 4 |
| ILMN | Illumina, Inc. | Biotechnology | 354.410 | Buy | X | Sell | X | 3 |
| KAI | Kadant, Inc. | Industrial Goods & Svcs | 100.360 | Buy | X | Buy | X | 5 |
| KIM | Kimco Realty Corporation | Equity REITs | 12.240 | Buy | X | Sell | X | 3 |
| MDC | M.D.C. Holdings, Inc. | Cyclical Goods and Services | 33.510 | Buy | X | Sell | X | 3 |
| MEOH | Methanex Corp | Chemicals | 17.550 | Buy | X | Sell | X | 3 |
| MSB | Mesabi Trust | Basic Resources | 17.120 | Buy | X | Buy | X | 5 |
| MTG | MGIC Investment Corporation | Insurance | 8.410 | Buy | X | Sell | X | 3 |
| MD | MEDNAX, Inc. | Healthcare Providers | 15.880 | Buy | X | Sell | X | 3 |
| TPC | Tutor Perini Corporation | Construction | 10.270 | Buy | X | Sell | X | 3 |
| TPX | Tempur Sealy International Inc. | Noncyclical Goods and Svcs | 63.310 | Buy | X | Sell | X | 3 |
| RICK | RCI Hospitality Holdings Inc. | Cyclical Goods and Services | 14.510 | Buy | X | Sell | X | 3 |
| WYND | Wyndham Destinations Inc. | Cyclical Goods and Services | 31.940 | Buy | X | Sell | X | 2 |
| TA | TravelCenters of America Inc | Cyclical Goods and Services | 12.400 | Buy | X | Sell | X | 2 |
| TCPC | BlackRock TCP Capital Corp | Financial Services | 9.910 | Buy | X | Buy | X | 4 |
| XONE | The ExOne Company | Industrial Goods & Svcs | 8.900 | Buy | X | Sell | X | 3 |
| AGIO | Agios Pharmaceuticals Inc. | Biotechnology | 52.450 | Buy | X | Sell | X | 4 |
| BLUE | Bluebird Bio | Biotechnology | 63.910 | Buy | X | Sell | X | 2 |
| ATRA | Atara Biotherapeutics | Biotechnology | 11.320 | Buy | O | Buy | O | 3 |
| VKTX | Viking Therapeutics | Pharmaceuticals | 7.740 | Buy | X | Sell | X | 3 |
| WBT | Manitowoc Foodservice Inc | Noncyclical Goods and Svcs | 6.410 | Buy | X | Sell | X | 3 |
| AGLE | Aeglea Biotherapeutics | Biotechnology | 9.060 | Buy | X | Buy | X | 5 |
| RRR | Red Rock Resorts Inc | Leisure Goods and Service | 13.440 | Buy | X | Sell | X | 2 |
| NTNX | Nutanix Inc | Software | 24.410 | Buy | X | Sell | X | 4 |
| ELF | Elf Beauty Inc | Noncyclical Goods and Svcs | 16.680 | Buy | X | Buy | X | 5 |
| HGV | Hilton Grand Vacations Inc | Cyclical Goods and Services | 21.500 | Buy | X | Sell | X | 4 |
| PK | PARK HOTELS & RESORTS INC | 10.190 | Buy | X | N/A | X | 3 |
|
| REVG | REV Group Inc | Automobiles | 5.800 | Buy | X | Sell | X | 2 |
| BHF | Brighthouse Financial Inc. | Insurance | 31.580 | Buy | X | Buy | X | 5 |
| CADE | Cadence Bancorporation Class A | Banks | 7.790 | Buy | X | Sell | X | 3 |
| LB.TR | L Brands Inc. TR | Retail | 19.417 | Buy | X | Sell | X | 4 |
| CGBD | TCG BDC, Inc. | Financial Services | 8.925 | Buy | X | Sell | X | 3 |
| FOCS | Focus Financial Partners, Inc. Class A | Financial Services | 28.200 | Buy | X | Buy | X | 5 |
| VFF | Village Farms International, Inc. | Chemicals | 5.870 | Buy | X | Buy | X | 4 |
| LPX.TR | Louisiana-Pacific Corporation TR | Basic Resources | 24.670 | Buy | X | Buy | X | 5 |
| WYND.TR | Wyndham Destinations Inc. TR | Cyclical Goods and Services | 33.245 | Buy | X | Buy | X | 3 |
| CAR.TR | Avis Budget Group, Inc. TR | Noncyclical Goods and Svcs | 18.610 | Buy | X | Sell | X | 3 |
| MTG.TR | MGIC Investment Corporation TR | Insurance | 8.592 | Buy | X | Sell | X | 3 |
| ABMD.TR | Abiomed,Inc. TR | Medical Products | 209.080 | Buy | X | Sell | X | 3 |
| EPR.TR | EPR Properties TR | Equity REITs | 33.443 | Buy | X | Buy | X | 4 |
| ARNC | Arconic Corp. | Basic Resources | 13.050 | Buy | X | Buy | X | 5 |
| Symbol | Company | Sector | Price | RS vs Market Signal | RS vs Market Column | RS vs Peer Signal | RS vs Peer Column | Tech Attrib |
|---|---|---|---|---|---|---|---|---|
| APT | Alpha Pro Tech Limited | Medical Products | 12.270 | Sell | O | Sell | O | 0 |
| GNMK | Genmark Diagnostics Inc | Medical Products | 9.570 | Sell | O | Sell | O | 1 |
| CLVS | Clovis Oncology Inc | Biotechnology | 6.880 | Sell | O | Sell | O | 1 |
| KMPR | Kemper Corporation | Insurance | 62.050 | Sell | O | Buy | O | 1 |
| HPE | Hewlett Packard Enterprise Company | Technology Services | 9.420 | Sell | O | Sell | O | 0 |
| ELAN | Elanco Animal Health, Inc. | Food and Beverage | 19.370 | Sell | O | N/A | O | 0 |
| AGR.TR | Avangrid Inc TR | Electric Utilities | 43.177 | Sell | O | Buy | O | 1 |
| HII.TR | Huntington Ingalls Industries Inc TR | Industrial Goods & Svcs | 195.964 | Sell | O | Buy | O | 2 |
| ELAN.TR | Elanco Animal Health Inc. TR | Food and Beverage | 19.370 | Sell | O | N/A | O | 0 |
| Symbol | Company | Sector | Current Price | Action Price | Target | Stop | Notes |
|---|---|---|---|---|---|---|---|
| HLI | Houlihan Lokey Inc | Banks | $58.97 | upper $50s - mid to upper 60s | $68 | $49 | 5 for 5'er, pullback from AT high, consec buy signals, top 25% of DWABANK, pos week mom, 2.09% yield |
| ATSG | Air Transport Services Group Inc. | Aerospace Airline | $20.94 | low 20s | 33.50 | 17.50 | 4 for 5'er, top third of favored AERO sector matrix, spread quad top, pot. covered write, R-R>3.0 |
| ABBV | AbbVie Inc. | Drugs | $90.71 | 82 - 89 | 100 | 71 | 3 for 5'er, favored DRUG sector, triple top breakout, 5.6% yield |
| KKR | KKR & Co. L.P | Finance | $28.56 | mid-to-upper 20s | 44.50 | 21 | 4 for 5'er, top half of FINA sector matrix, triple top, 2.2% yield, cov. write opp., R-R>4.0 |
| ICE | IntercontinentalExchange Inc. | Wall Street | $94.23 | 90s | 125 | 77 | 5 for 5'er, top 25% of WALL sector matrix, LT pos mkt RS, multi consec buy signals, 1.3% yield |
| DGX | Quest Diagnostics Incorporated | Healthcare | $112.75 | mid $110s to $130s | $132 | $92 | 4 for 5'er, pullback from AT high, consec buy signals, top 25% of favored healthcare sector, 2.02% yield |
| VRSK | Verisk Analytics, Inc. | Business Products | $160.46 | high 150s to 170s | $184 | $126 | 5 for 5'er, LT market & peer RS buy, consec buy signals, LT pos trend |
| BGS | B&G Foods, Inc. | Food Beverages/Soap | $22.82 | 22 - 24 | 28.50 | 18 | 5 for 5'er, #3 of 70 names in favored FOOD sector matrix, bullish catapult, 8.6% yield, pot. cov write |
| INTC | Intel Corporation | Semiconductors | $62.34 | hi 50s - mid 60s | 73 | 51 | 4 for 5'er, favored SEMI sector matrix, spread triple top, 2.1% yield, pot. covered write |
| CMCSA | Comcast Corporation | Media | $39.52 | hi 30s - low 40s | 48 | 32 | 4 for 5'er, LT mkt RS buy signal, spread quad top breakout, 2.3% yield |
| Symbol | Company | Sector | Current Price | Action Price | Target | Stop | Notes |
|---|---|---|---|---|---|---|---|
| HSBC | HSBC Holding PLC (United Kingdom) ADR | Banks | $23.81 | (26 - 23) | 17 | 28 | 1 for 5'er, bottom third of unfavored BANK sector matrix, LT neg mkt RS, multi sell signals, lower tops and lower bottoms |
| Comment |
|---|
| PODD Insulet Corporation R ($175.05) - Healthcare - PODD hit our $180 stop in Wednesday's trading. |
CMCSA Comcast Corporation R ($39.77) - Media - CMCSA is a 4 for 5'er that has been on a market RS buy signal since 2012. In Tuesday's trading, the stock gave a third consecutive buy signal when it broke a spread quad top at $40, taking out resistance that dated back to March. CMCSA also offers a 2.3% yield. Long exposure may be added in the upper $30s and lower $40s and we will set our initial stop at $32, the second potential sell signal on its default chart. We will use the bullish price objective of $48 as our target price.
| 10 | 11 | 12 | 15 | 16 | 17 | 18 | 19 | 20 | |||||||||||||||||||||||||||||||||||||||||||||
| 47.00 | X | X | X | • | • | 47.00 | |||||||||||||||||||||||||||||||||||||||||||||||
| 46.00 | X | O | X | O | 1 | O | 2 | • | 46.00 | ||||||||||||||||||||||||||||||||||||||||||||
| 45.00 | X | 9 | O | X | O | X | O | X | O | • | Top | 45.00 | |||||||||||||||||||||||||||||||||||||||||
| 44.00 | X | 7 | O | X | A | O | X | O | X | O | • | 44.00 | |||||||||||||||||||||||||||||||||||||||||
| 43.00 | X | O | X | O | X | C | O | O | X | • | 43.00 | ||||||||||||||||||||||||||||||||||||||||||
| 42.00 | 6 | 1 | O | X | 8 | X | O | 3 | O | • | 42.00 | ||||||||||||||||||||||||||||||||||||||||||
| 41.00 | 5 | O | X | 2 | 4 | O | O | X | O | • | 41.00 | ||||||||||||||||||||||||||||||||||||||||||
| 40.00 | X | O | X | O | X | O | X | O | • | • | X | 40.00 | |||||||||||||||||||||||||||||||||||||||||
| 39.00 | 4 | O | X | O | B | 3 | O | O | X | X | • | X | X | 39.00 | |||||||||||||||||||||||||||||||||||||||
| 38.00 | X | 9 | C | O | 9 | X | O | 2 | O | X | O | X | X | O | • | X | O | X | 38.00 | ||||||||||||||||||||||||||||||||||
| 37.00 | X | O | X | O | 8 | O | X | O | X | O | X | O | X | O | X | O | • | X | X | O | X | 37.00 | |||||||||||||||||||||||||||||||
| 36.00 | 1 | A | X | O | X | O | X | C | 1 | O | X | O | X | O | X | O | X | O | X | 5 | X | Mid | 36.00 | ||||||||||||||||||||||||||||||
| 35.00 | X | B | 3 | 7 | O | X | O | X | O | O | O | X | O | X | X | O | X | O | • | 35.00 | |||||||||||||||||||||||||||||||||
| 34.00 | X | B | O | 6 | A | O | X | O | • | O | X | O | X | 4 | X | • | 34.00 | ||||||||||||||||||||||||||||||||||||
| 33.00 | 7 | O | X | O | X | O | • | • | O | X | O | X | O | • | 33.00 | ||||||||||||||||||||||||||||||||||||||
| 32.00 | X | 6 | O | X | 4 | X | • | O | O | • | • | 32.00 | |||||||||||||||||||||||||||||||||||||||||
| 31.00 | 7 | O | X | 4 | A | 5 | • | • | 31.00 | ||||||||||||||||||||||||||||||||||||||||||||
| 30.00 | 3 | O | A | O | 3 | • | 30.00 | ||||||||||||||||||||||||||||||||||||||||||||||
| 29.00 | C | 8 | 9 | O | X | • | 29.00 | ||||||||||||||||||||||||||||||||||||||||||||||
| 28.00 | 7 | B | O | X | C | X | • | Bot | 28.00 | ||||||||||||||||||||||||||||||||||||||||||||
| 27.00 | 1 | 6 | O | X | O | X | 1 | • | 27.00 | ||||||||||||||||||||||||||||||||||||||||||||
| 26.00 | C | O | X | O | X | O | X | • | 26.00 | ||||||||||||||||||||||||||||||||||||||||||||
| 25.00 | B | O | X | A | O | • | 25.00 | ||||||||||||||||||||||||||||||||||||||||||||||
| 24.00 | A | 4 | • | 24.00 | |||||||||||||||||||||||||||||||||||||||||||||||||
| 23.00 | 8 | • | 23.00 | ||||||||||||||||||||||||||||||||||||||||||||||||||
| 22.00 | 7 | • | 22.00 | ||||||||||||||||||||||||||||||||||||||||||||||||||
| 21.00 | 2 | • | 21.00 | ||||||||||||||||||||||||||||||||||||||||||||||||||
| 20.00 | X | • | 20.00 | ||||||||||||||||||||||||||||||||||||||||||||||||||
| 19.50 | 1 | • | 19.50 | ||||||||||||||||||||||||||||||||||||||||||||||||||
| 19.00 | C | • | 19.00 | ||||||||||||||||||||||||||||||||||||||||||||||||||
| 18.50 | A | • | 18.50 | ||||||||||||||||||||||||||||||||||||||||||||||||||
| 18.00 | 9 | • | 18.00 | ||||||||||||||||||||||||||||||||||||||||||||||||||
| 17.50 | X | • | 17.50 | ||||||||||||||||||||||||||||||||||||||||||||||||||
| 17.00 | X | • | 17.00 | ||||||||||||||||||||||||||||||||||||||||||||||||||
| 16.50 | 8 | • | 16.50 | ||||||||||||||||||||||||||||||||||||||||||||||||||
| 16.00 | 7 | • | 16.00 | ||||||||||||||||||||||||||||||||||||||||||||||||||
| 15.50 | 6 | • | 15.50 | ||||||||||||||||||||||||||||||||||||||||||||||||||
| 15.00 | 3 | • | 15.00 | ||||||||||||||||||||||||||||||||||||||||||||||||||
| 14.50 | X | • | 14.50 | ||||||||||||||||||||||||||||||||||||||||||||||||||
| 14.00 | X | • | 14.00 | ||||||||||||||||||||||||||||||||||||||||||||||||||
| 13.50 | 5 | 2 | • | 13.50 | |||||||||||||||||||||||||||||||||||||||||||||||||
| 13.00 | 4 | O | X | • | 13.00 | ||||||||||||||||||||||||||||||||||||||||||||||||
| 12.50 | X | O | X | 1 | • | 12.50 | |||||||||||||||||||||||||||||||||||||||||||||||
| 12.00 | 2 | 6 | X | O | C | • | 12.00 | ||||||||||||||||||||||||||||||||||||||||||||||
| 11.50 | 1 | 8 | 9 | X | O | X | • | 11.50 | |||||||||||||||||||||||||||||||||||||||||||||
| 11.00 | C | O | X | O | X | B | X | • | 11.00 | ||||||||||||||||||||||||||||||||||||||||||||
| 10.50 | B | O | X | O | X | O | • | 10.50 | |||||||||||||||||||||||||||||||||||||||||||||
| 10.00 | X | A | O | A | • | • | 10.00 | ||||||||||||||||||||||||||||||||||||||||||||||
| 9.50 | 4 | O | X | • | 9.50 | ||||||||||||||||||||||||||||||||||||||||||||||||
| 9.00 | 3 | O | X | • | 9.00 | ||||||||||||||||||||||||||||||||||||||||||||||||
| 8.50 | C | 5 | • | 8.50 | |||||||||||||||||||||||||||||||||||||||||||||||||
| 8.00 | X | • | 8.00 | ||||||||||||||||||||||||||||||||||||||||||||||||||
| 7.50 | X | • | 7.50 | ||||||||||||||||||||||||||||||||||||||||||||||||||
| 10 | 11 | 12 | 15 | 16 | 17 | 18 | 19 | 20 |
| ADC Agree Realty Corporation ($64.71) - Real Estate - ADC returned to a buy signal on Wednesday at $66, which flipped the trend back to positive. As a result, ADC is now a 4 for 5’er within the favored real estate sector. This stock has maintained a long-term market RS buy signal since June 2016, confirming its superior strength versus the broader market. From here, initials support sits at $55. Note ADC offers a yield of 3.72%. |
| BHF Brighthouse Financial Inc. ($31.77) - Insurance - Shares of BHF gave a second consecutive buy signal on Wednesday with a double top break at $33 and later continued higher to $34. The 5 for 5’er ranks in the top decile of the insurance stocks sector matrix and recently reentered a positive trend on May 12th. Furthermore, BHF recently returned to an RS buy signal versus the market on May 26th and remains actionable from an Overbought / Oversold (OBOS) perspective. The weight of the evidence is positive here. The next level of resistance resides at $38 while initial support is offered at $24. |
| BLK BlackRock, Inc. ($533.00) - Wall Street - BLK broke a double top at $536 on Wednesday, marking the second consecutive buy signal on the chart. This stock is a strong 4 for 5’er that ranks within the top quartile of the Wall Street sector RS matrix. BLK’s breakout has now established support at the $504 level. Note this stock offers a yield of 2.72%. |
| FFIN First Financial Bankshares, Inc. ($31.15) - Banks - FFIN completed a bullish catapult on Wednesday with a double top break at $30, resulting in a second consecutive buy signal before advancing further to $31. The 4 for 5’er ranks 17th out of 120 names in the banks stock sector matrix and demonstrates positive long-term relative strength versus the market by remaining on an RS buy signal since June of 2008. In addition, FFIN is a holding in the DWA Bank Sector Portfolio and is actionable at current levels. Demand is in control. The next level of resistance can be found at $36, its all-time high, while initial support resides at $24. Note FFIN also offers a yield of 1.67%. |
| HON Honeywell International, Inc. ($147.85) - Aerospace Airline - HON returned to a buy signal on Wednesday with a spread triple top at $148 before moving higher to $150. As a result, HON is now trading in a positive trend with all 5 technical attributes in its favor. HON has maintained a long-term market RS buy signal since July 2007, confirming its superior strength versus the broader market. Demand is in control and the weight of the evidence is positive. From here, initial support is offered at $118 while overhead resistance sits at $160. Note HON offers a yield of 2.44%. |
| ICPT Intercept Pharmaceuticals Inc ($73.90) - Biomedics/Genetics - Shares of ICPT reversed down into a column of Os on Wednesday, resulting in a third consecutive sell signal with a double bottom break at $76 before continuing further past support in violation of its bullish support line to $73. The 2 for 5’er ranks in the bottom half of the biomedics/genetics stock sector matrix and demonstrates long-term weakness relative to the market, remaining on a relative strength sell signal since December of 2015. Furthermore, weekly and monthly momentum are both negative, adding to the weak picture. Supply is in control and long exposure should be avoided at this point. The next level of support can be found at $69 while resistance resides at $82. |
| MBUU Malibu Boats Inc. ($50.29) - Leisure - MBUU broke a double top at $50, marking the fourth consecutive buy signal on the chart. This leisure stock is a perfect 5 for 5’er that ranks in the top quartile of its sector RS matrix. In addition, monthly momentum just flipped positive, suggesting the potential for higher prices. From here, initial support sits at $45 while the stock faces overhead resistance at $52, MBUU’s recent high watermark from late February. |
| PCTY Paylocity Holding Corporation ($124.09) - Software - PCTY broke a spread triple top at $126 with the most recent action, marking the second consecutive buy signal on the chart. This stock is a solid 4 for 5’er that moved back into a positive trend in late-April. Additionally, PCTY has maintained a market RS buy signal since April 2018 and has a price target of $162. From here, initial support sits at $118. |
| PSX Phillips 66 ($81.73) - Oil - With the most recent action, PSX broke a double top at $80 before moving higher to $81. This marks the second consecutive buy signal on the chart for PSX and flips the trend back to positive for the first time since January. As a result, PSX is a 4 for 5’er within the favored oil sector. From here, initial support is offered at $76. Note PSX offers a yield of 4.41%. |
| SRE Sempra Energy ($124.39) - Gas Utilities - SRE returned to a buy signal on Wednesday with a double top breakout at $128. This gas utilities stock is a 4 for 5’er that moved back into a positive trend in late April. Additionally, SRE has maintained a long-term peer RS buy signal since December 2014 and yields 3.36%. From here, initial support is offered at $116, with additional support available at $102. |
| Name | Option Symbol | Action | Stop Loss |
|---|---|---|---|
| Williams Companies Inc. - $20.47 | WMB2021H17 | Buy the August 17.00 calls at 3.85 | 17.00 |
| Name | Option | Action |
|---|---|---|
| PACCAR Inc. ( PCAR) | Aug. 65.00 Calls | Initiate an option stop loss of 9.30 (CP: 11.30) |
| The Walt Disney Company ( DIS) | Sep. 105.00 Calls | Raise the option stop loss to 18.30 (CP: 20.30) |
| Franco-Nevada Corp. ( FNV) | Oct. 145.00 Calls | Stopped at 136.00 (CP: 138.73) |
| PulteGroup, Inc. ( PHM) | Oct. 30.00 Calls | Initiate an option stop loss of 6.10 (CP: 8.10) |
| Name | Option Symbol | Action | Stop Loss |
|---|---|---|---|
| Loews Corporation - $34.24 | L2018U40 | Buy the September 40.00 puts at 7.00 | 38.00 |
| Name | Option | Action |
|---|---|---|
| Realty Income Corporation (O) | Sep. 55.00 Puts | Stopped at 57.00 (CP: 54.93) |
| Johnson Controls International PLC (JCI) | Jul. 30.00 Puts | Stopped at 32.00 (CP: 31.69) |
| Comerica Incorporated (CMA) | Jul. 32.50 Puts | Stopped at 38.00 (CP: 38.81) |
| Bank of Nova Scotia (BNS) | Sep. 40.00 Puts | Stopped at 42.00 (CP: 42.08) |
| Toronto-Dominion Bank (TD) | Oct. 42.50 Puts | Stopped at 45.00 (CP: 45.15) |
| Las Vegas Sands Corp. (LVS) | Sep. 50.00 Puts | Stopped at 52.00 (CP: 50.77) |
| Name | Option Sym. | Call to Sell | Call Price | Investment for 500 Shares | Annual Called Rtn. | Annual Static Rtn. | Downside Protection |
|---|---|---|---|---|---|---|---|
| J.P. Morgan Chase & Co. $95.82 | JPM2018I105 | Sep. 105.00 | 6.35 | $48,048.60 | 26.28% | 17.57% | 5.20% |
| Name | Action |
|---|---|
| Micron Technology, Inc. (MU) - 45.80 | Sell the October 50.00 Calls. |
| Chevron Corporation (CVX) - 93.30 | Sell the September 95.00 Calls. |
| Intel Corporation (INTC) - 62.34 | Sell the September 65.00 Calls. |
| Name | Covered Write |
|---|---|
| B&G Foods, Inc. ( BGS - 22.82 ) | August 22.50 covered write. |
Daily Equity & Market Analysis
Loading, Please Wait...
