The iShares MSCI EAFE ETF (EFA) and iShares MSCI Emerging Markets ETF (EEM) have each moved back into overall positive trends.
The broader international equities asset class remains out of favor across most of our relative strength rankings, including the Dynamic Asset Level Investing (DALI) tool which has the asset class in the last ranked position out of the six spaces examined. With that said, we have seen some near-term improvement from certain areas around the world, which has led the international equities asset class to gain 11 buy signals over the past week – the most out of any asset class. The space is still 22 buy signals from the fifth-ranked commodities, but it is certainly significant to see this recent strength. As a whole, the more offensively-minded asset classes of domestic equities, commodities, and international equities have each continued to gain signals during the past five trading days, which is a further positive indication for “risk-on” investments such as those in foreign equity markets.
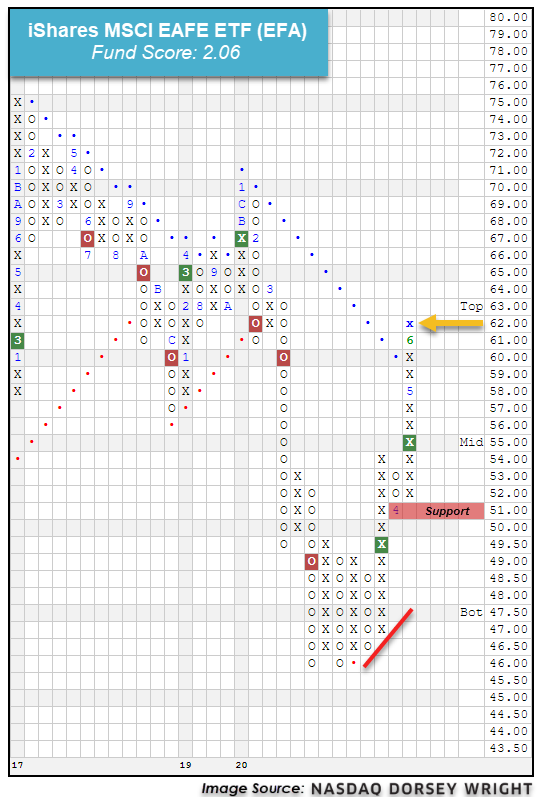
As we mentioned last week, the iShares MSCI EAFE ETF EFA moved higher to transition back to an overall positive trend with movement to $60 last week. The developed markets representative has seen further demand come in over the past five trading days, with EFA advancing intraday Wednesday to notch another X at $62. While this improvement is certainly a positive sign, it should also be noted that the recent rally has left the fund in overbought territory.

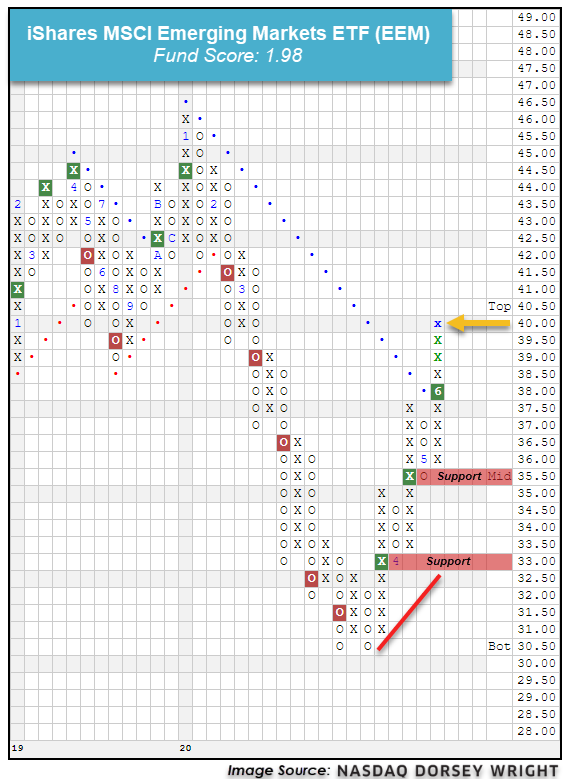
This week, we have also seen a further movement to the upside in our broad emerging markets representative, the iShares MSCI Emerging Markets ETF EEM. This fund broke a double top at $38 in trading on Monday, marking its third consecutive buy signal which also surpassed its bearish resistance line to move EEM back to an overall positive trend. The past two days have seen continued advancement, with EEM moving past further resistance and reaching $40 in trading Wednesday. In a similar vein to EFA, the emerging markets fund has seen a strong rally off its recent multi-year low of $30.50 but is now in overbought territory as well.

While there are a variety of factors that play into the price movement for foreign stocks, one of the more significant influencers is the strength of the US Dollar, which we track using the NYCE U.S. Dollar Index Spot DX/Y. Interestingly enough, DX/Y has shown deterioration over the past week, as the chart fell to give a triple bottom break on May 28th before continuing lower to $98 on Thursday, which moved the index back to an overall negative trend. DX/Y has fallen further this week to a recent level of $97.50 through trading on Tuesday.
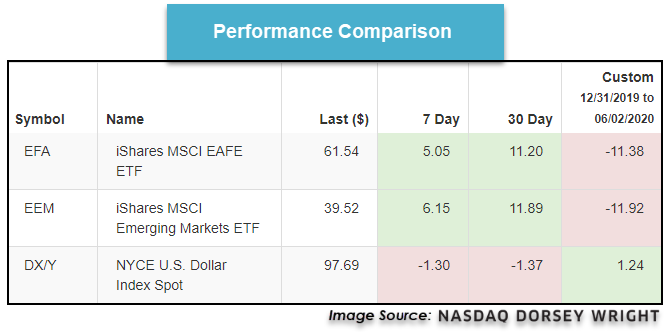
Taking a look at the recent performance comparison of EFA, EEM and DX/Y reveal that the emerging and developed market representatives have each gained over 11% over the past 30 days, while the US Dollar index has fallen by -1.37% (through 6/2). We can also see that both EFA and EEM have had about half of their recent improvement occur over the past seven days, with respective gains of 5.05% and 6.15%, while DX/Y has seen almost all of its recent decline come over the same timeframe, posting a loss of -1.30%. These developments are certainly at their initial stages, making them a place to continue to monitor as we head towards the halfway point of 2020.

