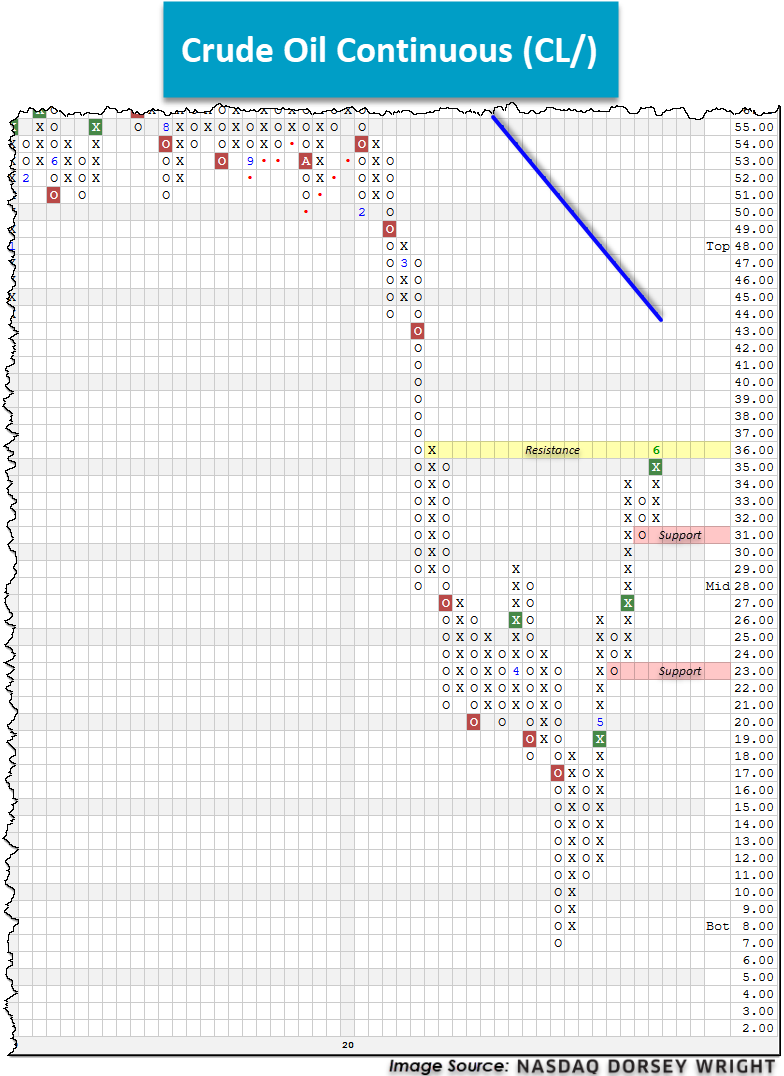
We provide an update regarding the technical picture for Crude Oil Continuous (CL/).
Remember, these are technical comments only. Just as you must be aware of fundamental data for the stocks we recommend based on technical criteria in the report, so too must you be aware of important data regarding delivery, market moving government releases, and other factors that may influence commodity pricing. We try to limit our technical comments to the most actively traded contracts in advance of delivery, but some contracts trade actively right up to delivery while others taper off well in advance. Be sure you check your dates before trading these contracts. For questions regarding this section or additional coverage of commodities email james.west@dorseywright.com.
Data represented in the table below is through 06/03/2020:
Broad Market Commodities Report
Portfolio View - Commodity Indices
| Symbol | Name | Price | PnF Trend | RS Signal | RS Col. | 200 Day MA | Weekly Mom |
|---|---|---|---|---|---|---|---|
| CL/ | Crude Oil Continuous | 36.87 | Negative | Buy | X | 46.48 | +6W |
| DBLCIX | Deutsche Bank Liquid Commodities Index | 249.39 | Negative | Sell | O | 291.63 | +8W |
| DWACOMMOD | DWA Continuous Commodity Index | 449.43 | Negative | Buy | O | 460.35 | +7W |
| GC/ | Gold Continuous | 1733.20 | Positive | Buy | X | 1572.56 | -4W |
| HG/ | Copper Continuous | 2.50 | Negative | Buy | O | 2.56 | +7W |
| ZG/ | Corn (Electronic Day Session) Continuous | 324.00 | Negative | Buy | O | 362.72 | +5W |
As the localities and municipalities around the globe begin to loosen lockdown restrictions, the appetite for commodities such as crude oil has begun to reemerge. Additionally, the potential for additional crude oil production, as measured by assessing the Baker Hughes US Crude Oil rotary rig count, is at its lowest level since 2010 with 222 operating rigs (source: WSJ). These converging factors have created explosive price action as net new demand has entered the crude oil market in recent months. After hitting a revised bottom (excluding temporary negative price action) of $7 on the chart in late April, Crude Oil Continuous CL/ has since rallied to mark three consecutive buy signals, ultimately culminating with yesterday’s chart reading of $36 in Xs. Despite this major move off of the bottom, CL/ is still down nearly 40% on the year and remains in a negative trend since January. Further, while the technical strength for the commodity is evident in the near-term, crude tests resistance at its current chart level of $36. A move to $37 would provide additional confirmation of this near-term rally and eliminate all resistance before the bearish resistance line comes into play at $44. From here, support is offered at $31.