
Intraday calculations on Thursday signified that over 95% of stocks in the S&P 500 traded above their ten-week moving averages, resulting in the highest reading for the TWSPX indicator ever. We take a look at returns for the S&P 500 with historically similar moves.
Replay for FSM Models Webinar: We have a replay available for our latest webinar on Applying the Fund Score Method through FSM Models, which took place on Thursday, May 21st. This webinar featured an overview of the various FSM strategies and offered potential implementation ideas. Click here to view the replay.
Market Webinar Replay: We also have a video replay and slides available from our lastest Market Update Webinar from Tuesday, May 26th:
Beginners Series Webinar - Join us on Friday, May 29th at 2 PM (ET) for our NDW Beginners Series Webinar. This week's topic is Individual Stock Idea Generation. Register here.
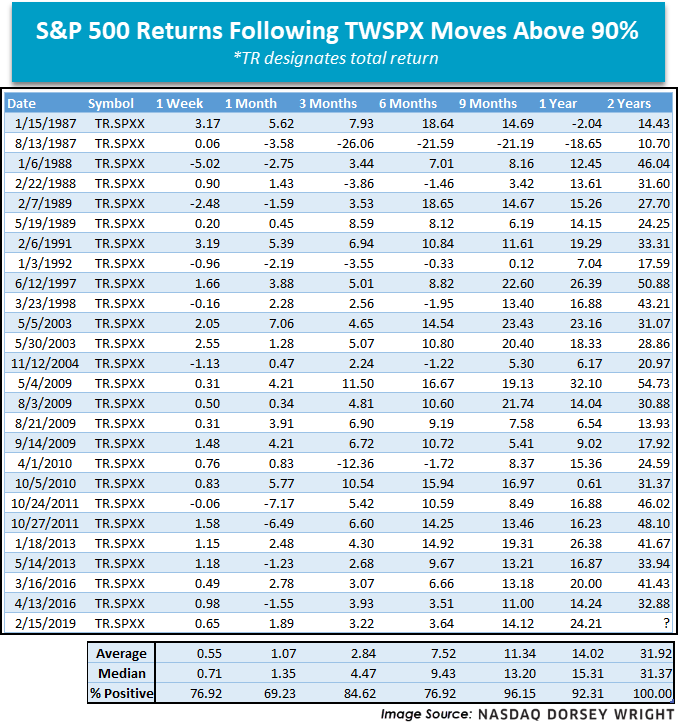
Since broad domestic equity indices posted a bottom on March 23rd, they have not looked back. In fact, the S&P 500 SPX, Nasdaq Composite NASD, and Dow Jones Industrial Average DJIA have each rebounded with price returns in excess of 30% (data beginning 3/23/20 through 5/27/20). As a result of this upward movement a number of indicators on the Nasdaq Dorsey Wright research platform have turned positive, yet perhaps none more so than the ten-week for the S&P 500 TWSPX. As a refresher, TWSPX measures the percentage of stocks in the S&P 500 that are currently trading above their 10-week (50 day) moving average. With an intraday calculation of 95.64% on Thursday (5/28) TWSPX posted its highest reading ever, signifying that over 95% of securities in the S&P 500 are trading above their 10-week moving average. While this may sound ominous to some, the data suggests otherwise as we note generally positive returns following TWSPX movements above the 90% threshold, with almost all observations rolling positive within nine months.
In a similar vein, when first highlighted several weeks ago as a developing story, SPX managed to get 10% above its 50-day moving average yesterday (5/27). This event is also rare, only occurring six times since 1955 (April 2009, November 1998, February 1991, September 1982, January 1975, and July 1955). Respective performance for the S&P 500 (as perhaps anticipated at this point) is also positive, with all returns in the black six months out.

While the events surrounding TWSPX and the 50-day moving average for the S&P 500 are certainly promising, they are not a silver bullet nor a guarantee of the past repeating itself. It is also worth noticing that events like these are infrequent, resulting in a small sample size to build from. However, the findings here do evidence that demand continues to reenter the equity markets, positively contributing to the weight of the evidence.
