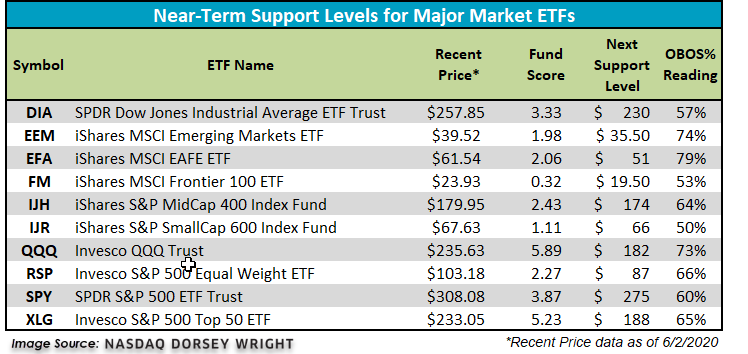
Today we provide updated support levels for the major market ETFs and highlight the buy signals on the charts of the iShares SmallCcap 600 Index Fund (IJR) and iShares MidCap 400 Index Fund (IJH).
Portfolio View - Major Market ETFs
| Symbol | Name | Price | Yield | PnF Trend | RS Signal | RS Col. | Fund Score | 200 Day MA | Weekly Mom |
|---|---|---|---|---|---|---|---|---|---|
| DIA | SPDR Dow Jones Industrial Average ETF Trust | 257.85 | 2.28 | Positive | X | 3.33 | 263.08 | +8W | |
| EEM | iShares MSCI Emerging Markets ETF | 39.52 | 2.46 | Positive | Sell | O | 1.98 | 40.54 | +8W |
| EFA | iShares MSCI EAFE ETF | 61.54 | 3.50 | Positive | Sell | O | 2.06 | 63.26 | +8W |
| FM | iShares MSCI Frontier 100 ETF | 23.93 | 3.96 | Negative | Sell | O | 0.32 | 27.04 | +8W |
| IJH | iShares S&P MidCap 400 Index Fund | 179.95 | 1.92 | Positive | Buy | O | 2.43 | 184.95 | +8W |
| IJR | iShares S&P SmallCap 600 Index Fund | 67.63 | 1.77 | Positive | Buy | O | 1.11 | 73.83 | +8W |
| QQQ | Invesco QQQ Trust | 235.63 | 0.70 | Positive | Buy | X | 5.89 | 205.39 | +8W |
| RSP | Invesco S&P 500 Equal Weight ETF | 103.18 | 2.14 | Positive | Buy | X | 2.27 | 105.02 | +8W |
| SPY | SPDR S&P 500 ETF Trust | 308.08 | 1.88 | Positive | O | 3.87 | 300.00 | +8W | |
| XLG | Invesco S&P 500 Top 50 ETF | 233.05 | 1.59 | Positive | O | 5.23 | 220.52 | +8W |
Additional Comments:
It was another exceptionally strong week for the 10 major market funds covered in this report as all managed to finish in positive territory. The top two performing funds this week both came from the international camp – the iShares MSCI Emerging Markets ETF EEM posted an impressive gain of 6.15% while the iShares MSCI EAFE ETF EFA gained 5.05%. Conversely, the iShares SmallCap 600 Index Fund IJR lagged the pack despite finishing in positive territory with a gain of 1.87%. In the table below, we have updated initial support levels for all 10 major market funds covered in this report. Additionally, we want to highlight two notable intraday buy signals that happened today (6/3). Be sure to read today's International Equity Overview which discusses the positive trend changes we saw on the charts of the EEM and EFA.

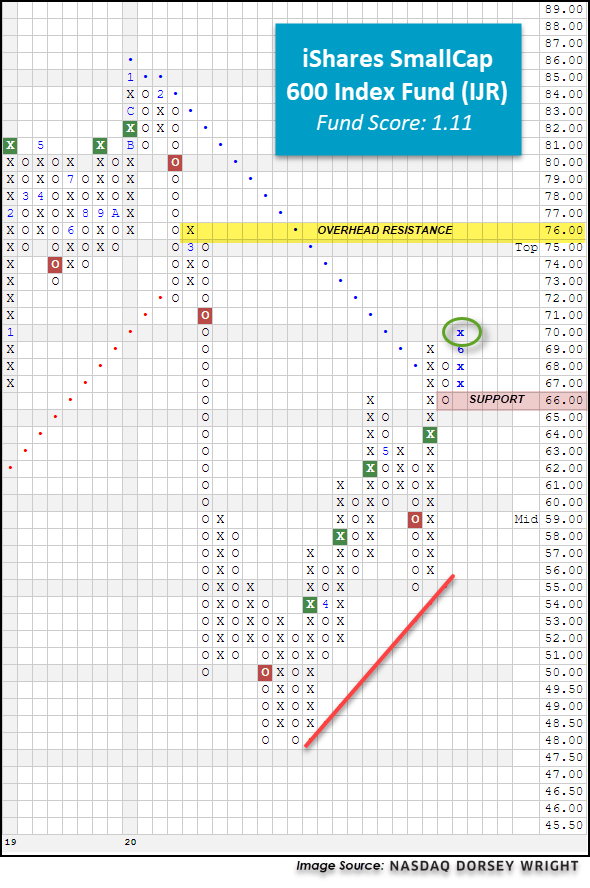
Last Wednesday, we brought to your attention the fact that the iShares SmallCap 600 Index Fund IJR had moved through its bearish resistance line at $68 with the day’s price action. As a result, IJR’s default chart moved back into a positive trend for the first time since flipping negative in late February. Over the last seven days, the small-cap fund managed to push higher to $69 before experiencing a slight pullback to $66 which triggered a three-box reversal into Os on the chart. However, with today’s market action, IJR has reversed back up into Xs where it broke a double top at $70, marking the second consecutive buy signal on the chart. From current levels, initial support is now offered at $66 and the fund will face the next level of overhead resistance at $76. This follow-through is undoubtedly a positive sign for IJR however the fund remains technically weak with a score of 1.11, well below the acceptable 3-threshold. Year-to-date, IJR is down -19.34%, underperforming the S&P 500 Index SPX by 14.70%.

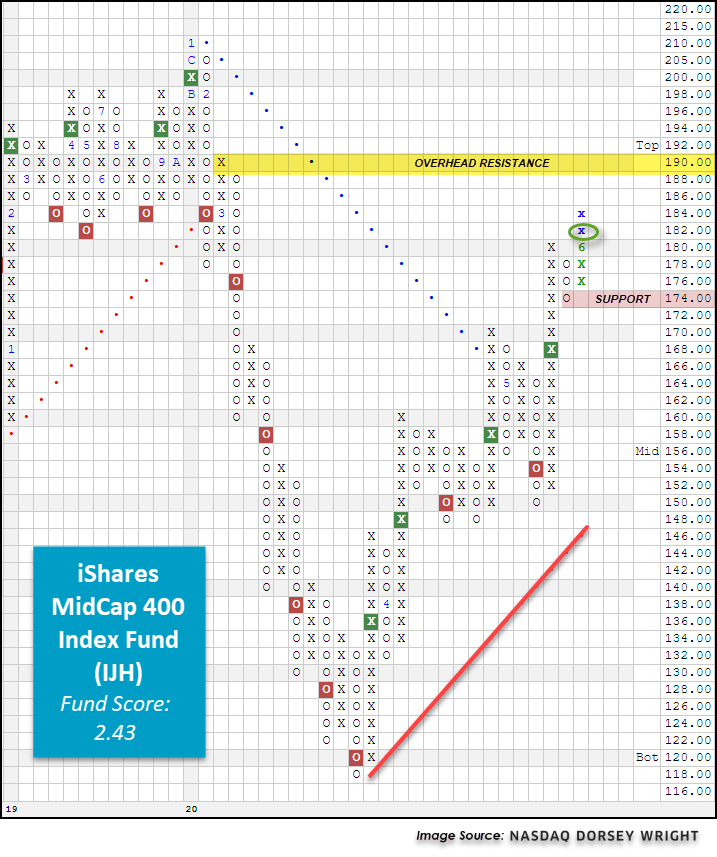
Like its small-cap counterpart, today the default chart of the iShares S&P MidCap 400 Index Fund IJH broke a double top at $182 before moving higher to $184. This breakout marks the second consecutive buy signal on the chart, confirming that demand is in control. Currently, IJH has a relatively weak fund score of 2.43 and its year-to-date loss of -12.57% continues to lag the SPX by 7.93%. However, if we continue to see IJH’s technical picture improve from here, we can expect to see the score push higher. Be sure to set a score alert under “Set Alert” so that you can be notified when IJH moves above the 3-threshold. From current levels, IJH has support at $174 and faces resistance at $190.

