Most Requested Symbols

At the beginning of April, we launched the Oppenheimer ETF Report and Oppenheimer US Revenue Model. This model seeks to provide overweight exposure to the strongest fund within an inventory of four Oppenheimer Revenue ETFs, which each provide broad exposure to one of the three size categories, as well as a dividend focused inventory, but do so with a weighting scheme based on top line revenue rather than market capitalization.
Join us to discuss the Oppenheimer US Revenue ETF line up, the benefits of the revenue weighting scheme, and how this model can be positioned within your portfolios.
Speakers:
Click here to register for the event. The password is: pnfpnf
Current Model Holdings:

Click here to register for the event. The password is: pnfpnf

Each week the analysts at DWA review and comment on all major asset classes in the global markets. Shown below is the summary or snapshot of the primary technical indicators we follow for multiple areas. Should there be changes mid-week we will certainly bring these to your attention via the report.
| Universe | BP Col & Level (actual) | BP Rev Level | PT Col & Level (actual) | PT Rev Level | HiLo Col & Level (actual) | HiLo Rev Level | 10 Week Col & Level (actual) | 10 Week Rev Level | 30 Week Col & Level (actual) | 30 Week Rev Level |
|---|---|---|---|---|---|---|---|---|---|---|
| ALL |
|
50% |
|
60% |
|
54% |
|
54% |
|
44% |
| NYSE |
|
44% |
|
62% |
|
50% |
|
58% |
|
44% |
| OTC |
|
52% |
|
58% |
|
60% |
|
52% |
|
44% |
| World |
|
46% |
|
52% |
|
|
|
42% |
|
44% |
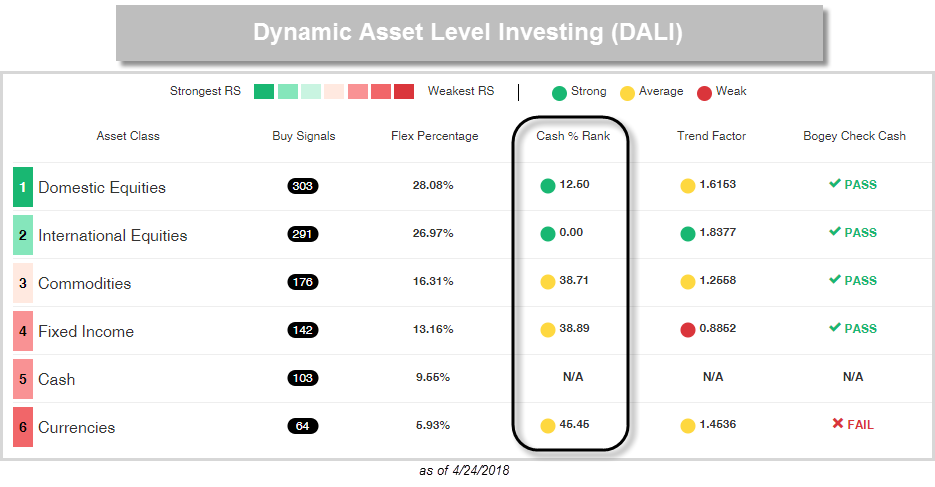
Our primary tool for understanding where things stand from a relative strength standpoint is the Dynamic Asset Level Investing Tool, or DALI for short. The tool will help us identify which asset classes are favored as well as unfavored. Not only does it do that for us, but DALI also provides metrics that help us identify whether the individual asset class may be weakening versus cash. The main metric we typically focus on to understand that relationship is called Cash Percentile Rank.
Cash Percentile Rank simply measures how a cash proxy (typically the DWA Money Market Proxy – 13 Week T-Bill MNYMKT) is doing relative to the proxies that make up a particular asset class within DALI. The Cash Percentile Rank, as seen in the image below, can be found on the DALI details page. At this time, the Cash Percentile Ranks for US and International Equities are 12.50% and 0%, respectively, which suggests that a majority of the asset class proxies are showing better relative strength than cash. Meanwhile, the majority of Commodities, Fixed Income, and even Currencies still rank better than cash. Although we do see that majority of our proxies in US and International are better than cash, it is always beneficial to know the lay of the land and also have a risk management tool that we can fall back on at any time. Today we wanted to take a closer look at the Cash Percentile Rank measure for International Equities.
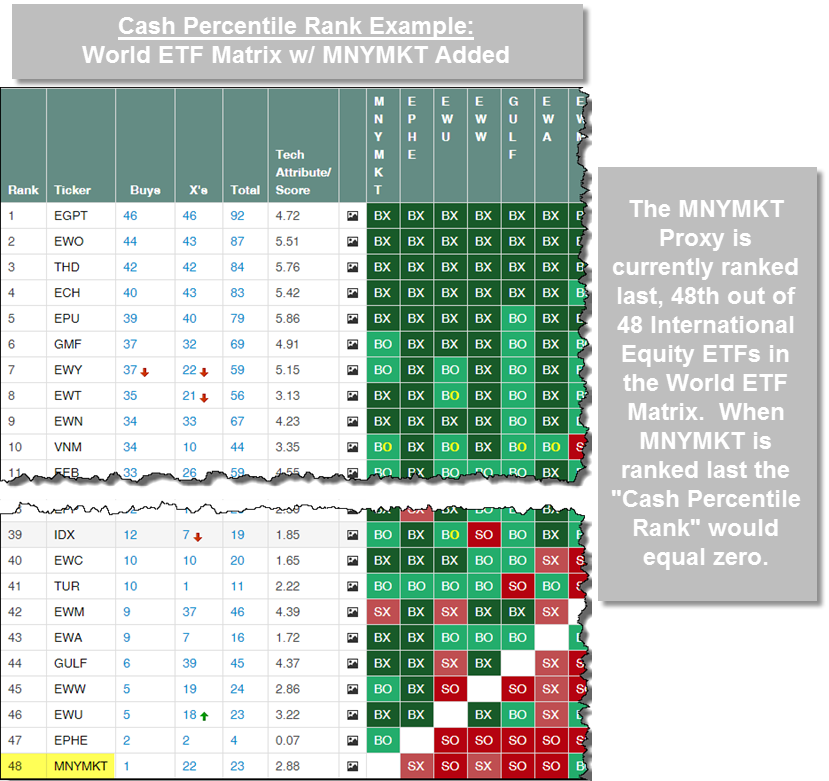
Like DALI, the Cash Percentile Rank concept is driven by DWA RS Matrix tool. In order to construct a Cash Percentile Rank reading for a group of stocks, ETFs, or mutual funds, we simply add the DWA Money Market Proxy – 13 Week T-Bill MNYMKT to the matrix universe and then calculate what percentile it ranks within the matrix. We evaluate these matrices on a daily basis to see where cash resides and then display the results in DALI, using a traffic light of sorts, assigning the specific asset class either a green, yellow, or red light. If cash resides in the bottom third of the matrix, this suggests poor RS for cash versus others in the matrix, so it gets a green light. As cash rises in the matrix and moves into the middle third, the light turns yellow. This would suggest that members of the asset class are starting to falter and that we should takes a more cautious approach or perhaps hedge our exposure to that asset class. If cash ascends to the top third of the matrix, the light will turn red, indicating that on an aggregate basis, the asset class has weakened enough to make cash as a better overall investment choice relative to that particular asset classes. In the image below we have shown an example of an already constructed matrix with International Equity ETFs and a cash proxy.
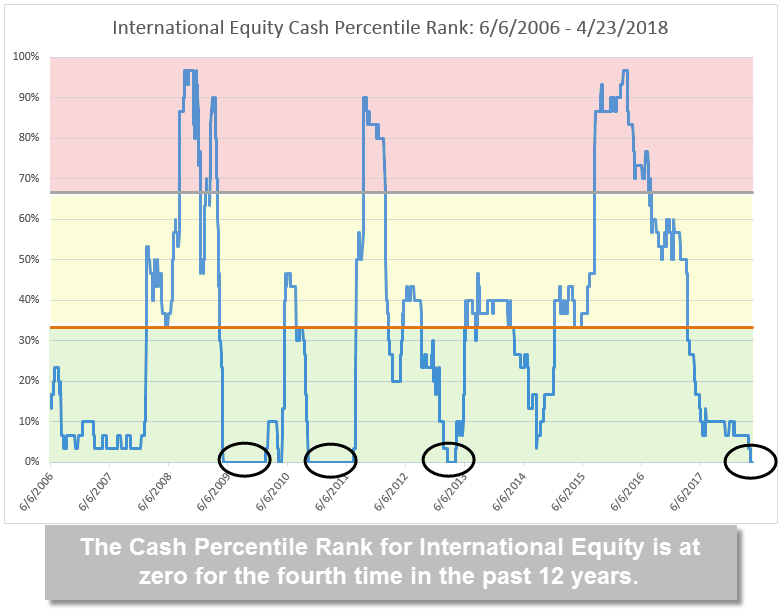
For perspective on how the Cash Percentile Rank fluctuates we have shown the Cash Percentile Rank history for International Equities going back to 2006. The higher the reading is, the higher our cash proxy ranks within the matrix. In other words, the International Equity proxies are weak relative to cash so it's better to take a more defensive approach to equity exposure. Notice that in the graph below, the Cash Percentile Rank value hit its high levels in the mid 2008 and 2016. During these times, the light we have made reference to in prior examples was red. Since 2016, the Cash Percentile Rank has steadily declined moving below 33% in March 2017 and just this month (April 9th) the Cash Percentile Rank for International Equity fell to 0%. This suggests that all of the International Equity proxies in the ranking are currently above the Money Market Proxy. This is the fourth time in the past 12 years that the International Equity Cash Percentile Ranking has been at 0%. The other time periods were late 2009 / early 2010, mid 2010 to mid 2011, and early 2013. This is all to say that despite the market volatility of late the International Equity markets continue to show a positive picture. Additionally, the fact that the Money Market Proxy sits in the last position suggests there is a wide breadth of strength in the International Markets. As we move forward the Cash Percentile Rank is another positive sign for International Equities, and as long as that number stays below 33%, will continue to be indicative of a healthy relative strength picture for the International Markets.

| Symbol | Name | Price | Yield | Trend | RS Signal | RS Col. | Score | 200 Day MA | Weekly Mom |
| DIA | SPDR Dow Jones Industrial Average ETF Trust | 240.09 | 2.04 | Positive | X | 3.38 | 236.54 | +1W | |
| EFA | iShares MSCI EAFE ETF | 70.67 | 2.55 | Positive | Sell | O | 2.73 | 69.39 | +3W |
| FRN | PowerShares Frontier Markets ETF | 15.82 | 3.40 | Positive | Sell | X | 4.25 | 15.12 | -5W |
| IJH | iShares S&P MidCap 400 Index Fund | 188.43 | 1.29 | Positive | Buy | X | 4.05 | 183.95 | +1W |
| IJR | iShares S&P SmallCap 600 Index Fund | 78.66 | 1.19 | Positive | Buy | X | 5.41 | 74.80 | +1W |
| QQQ | PowerShares QQQ Trust | 158.46 | 0.82 | Positive | Buy | X | 5.14 | 154.54 | -6W |
| RSP | PowerShares S&P 500 Equal Weight ETF | 99.45 | 1.63 | Positive | Buy | X | 4.55 | 98.23 | +1W |
| SPY | SPDR S&P 500 ETF Trust | 262.98 | 1.85 | Positive | O | 2.45 | 260.48 | +1W | |
| VWO | Vanguard FTSE Emerging Markets ETF | 45.62 | 2.36 | Positive | Sell | O | 4.64 | 45.47 | -6W |
| XLG | PowerShares S&P 500 Top 50 ETF | 185.68 | 1.89 | Positive | O | 2.26 | 185.31 | +1W |
Additional Comments:
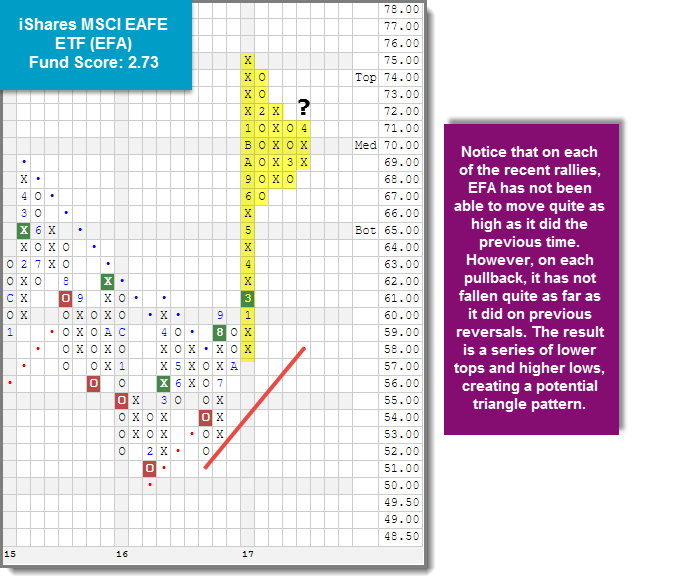
It was a negative week overall in terms of performance as each of the 10 major market ETFs covered in this report finished in the red, with four losing more than -3%. The biggest mover among the group was the PowerShares QQQ Trust QQQ, which dropped -4.60% from 4/17 – 4/24. The iShares MSCI EAFE ETF EFA fared the best, losing just -0.77%. Turning our attention to the chart of EFA below, we can see a familiar pattern forming on the chart. As a refresher, the triangle pattern is created when a chart makes a series of lower tops while at the same time making higher bottoms. This action creates what looks exactly like a triangle from geometry class. One case in point is the chart of the EFA below. Notice that on each of the recent rallies, it has not been able to move quite as high as it did the previous time. However, on each pullback, it has not fallen quite as far as it did on previous reversals. The result is a series of lower tops and higher bottoms, creating a potential triangle pattern. At this point, if the price continues to move higher from here, the triangle will be completed to the upside (a bullish triangle) with a move to $73. On the other hand, a move to $67 or below would complete a bearish triangle pattern. With a fund score of 2.73 coupled with a price target of $77; we will be keeping a watchful eye on this trend chart to see if the EFA is able to hold key support levels.
(The DWA Technical Indicator link, found under the Indicators menu, provides valuable insight into where positive relative strength readings and positive trend charts are concentrated. RSX is the percentage of stocks within a sector whose relative strength charts are in a column of Xs. RSP is the percentage of stocks within a sector whose relative strength charts are on a buy signal. PT is the percentage of stocks within a sector that are trading above their bullish support lines and the overall trend is positive. The strongest sectors, i.e. market leaders, will have most of these indicators positive and moving higher in a column of Xs.)
Over the past week of market action, 16 sector BP charts moved higher while three moved lower. 10 sector BP charts reversed up into Xs while three reversed down into Os. Currently, the Bullish Percent for the Internet sector is within 1% of a reversal down into Os. The average sector BP reading this week is 48.09%, down 0.22%. There were four shifts on the Favored Sector Spectrum this week, three of which were to the upside while one, the Drugs sector, moved lower. Leisure is now average up from unfavored, while both the Protection Safety Equipment and Oil sectors moved to favored. The Drugs sector remains unfavored.
| To Xs | To Os |
|---|---|
| None | Internet ( 0.8 to 44 ) |
The average Bullish Percent reading this week is 48.09% down 0.22% from the previous week
| 0-14 | 16-20 | 22-26 | 28-32 | 34-36 | 38-42 | 44-46 | 48-52 | 54-56 | 58-62 | 64-66 | 68-72 | 74-78 | 80-86 | 88-100 |
 |
||||||||||||||
| Sector |
|---|
| None |
| Sector |
|---|
| Autos & Parts (50%) - Bear Correction |
| Electronics (46%) - Bear Correction |
| Utilities / Electric (44%) - Bear Correction |
| Foods Beverages/Soap (48%) - Bear Correction |
| Utilities / Gas (46%) - Bear Correction |
| Internet (50%) - Bear Correction |
| Oil Service (40%) - Bull Alert |
| Precious Metals (30%) - Bull Alert |
| Protection Safety Eq (50%) - Bull Alert |
| Real Estate (44%) - Bear Correction |
| Retailing (50%) - Bear Correction |
| Software (50%) - Bear Correction |
| Transports / Non Air (42%) - Bear Correction |
| Waste Management (46%) - Bear Correction |
| Sector |
|---|
| Banks (66%) - Bear Confirmed |
| Business Products (52%) - Bear Confirmed |
| Leisure (50%) - Bear Confirmed |
| Savings & Loans (50%) - Bear Confirmed |
PERCENT RELATIVE STRENGTH & POSITIVE TREND UPDATE
(The DWA Technical Indicator link, found under the Database tab, provides valuable insight into where positive relative strength readings and positive trend charts are concentrated. RSX is the percentage of stocks within a sector whose relative strength charts are in a column of Xs. RSP is the percentage of stocks within a sector whose relative strength charts are on a buy signal. PT is the percentage of stocks within a sector that are trading above their bullish support lines and the overall trend is positive. The strongest sectors, i.e. market leaders, will have most of these indicators positive and moving higher in a column of Xs.)
|
|
| ^PT Charts Reversing Up - | ^PT Charts Reversing Down - |
|
|
| ^PT Charts Moving Higher - | ^PT Charts Moving Lower - |
|
|
|
|
| ^RSX Charts Reversing Up - | ^RSX Charts Reversing Down - |
| ^RSX Charts Moving Higher - | ^RSX Charts Moving Lower - |
|
|
|
|
| ^RSP Charts Reversing Up - | ^RSP Charts Reversing Down - |
|
|
| ^RSP Charts Moving Higher - | ^RSP Charts Moving Lower - |
|
|
FAVORED SECTORS LIST
Favored Sectors are those that have three of the four charts (Relative Strength, RSX, RSP, and PT) positive. The table below contains those sectors which changed their favored status over the past week. It is best to focus on those sectors that are about 50% or lower on their Bullish Percent Readings and in a column of Xs on the bullish percent chart. Should a sector move from Favored to Average, that doesn't mean the sector has to be sold.
| Changes since 04/18/2018 | Full Report |
|
|
|
|
||||||
|
|
|
|
|
|
||||
|
|
|
|
|
|
||||
|
|
|
|
|
|
||||

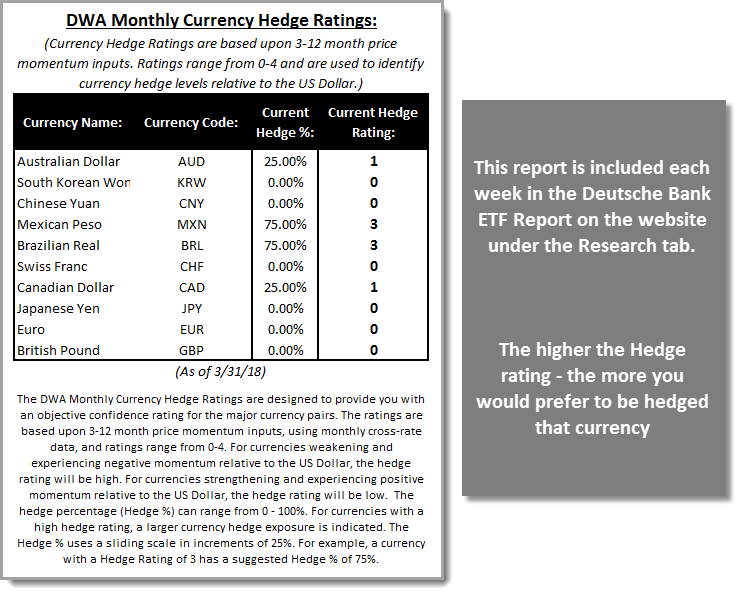
Each week (Tuesdays) we publish a Deutsche Bank ETF Report, which is located under the Research tab on the website. Included in that report is the exclusive DWA Monthly Currency Hedge Ratings. This report is designed to analyze 10 major currencies around the world and indicate whether or not you would rather be invested in pure equity exposure to that country or if you would be better off hedging your exposure. We use a scale from 0-4 to judge this relationship, a higher number indicates that a higher percentage of exposure to that currency should be hedged. These ratings are updated on a monthly basis and serve as a useful guide to those of you investing internationally. For example, the Brazilian Real (BRL) comes with a Hedge Rating of 3, suggesting that we should currently be hedging the majority of exposure to this currency.
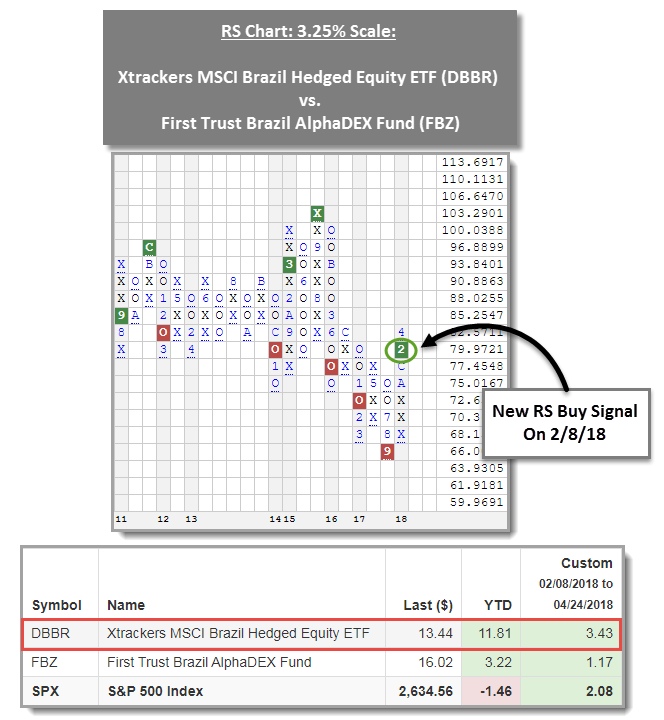
When we turn to relative strength to assist us with making the decision whether or not to be hedged or unhedged, we are presented with further confirmation of the hedge rating for Brazil shown above. Take for example the Xtrackers MSCI Brazil Hedged Equity ETF DBBR versus the First Trust Brazil AlphaDEX Fund FBZ. When plotting this relationship on a relative strength Point & Figure chart (shown below) we can see this chart gave a buy signal on February 8th this year favoring DBBR (since it is the numerator in the equation). This buy signal indicates we would rather be invested in DBBR versus FBZ. Since this relative strength buy signal, DBBR has gained 3.43% while FBZ is up 1.17%. On a year-to-date basis, DBBR’s lead has extended, as it has gained 11.81% compared to just 3.22% for FBZ. Those with exposure to Brazil may wish to consider allocating this part of the portfolio to a hedged solution like DBBR at this time. When we look at its trend chart, we can see it has given three consecutive buy signals, offers a fund score in excess of 4, and currently trades at a multi-year high.
As we noted in Monday’s “Were You Aware…?” the US Treasury 10YR Yield Index TNX broke a spread triple top on 4/20/18. In trading on Tuesday and Wednesday TNX continued higher, reaching and ultimately surpassing 3.0%, to hit its highest level since 2011. The US Treasury 5YR Yield Index FVX and the US Treasury 30YR Yield Index TYX have each also given fresh buy signals within the last week.
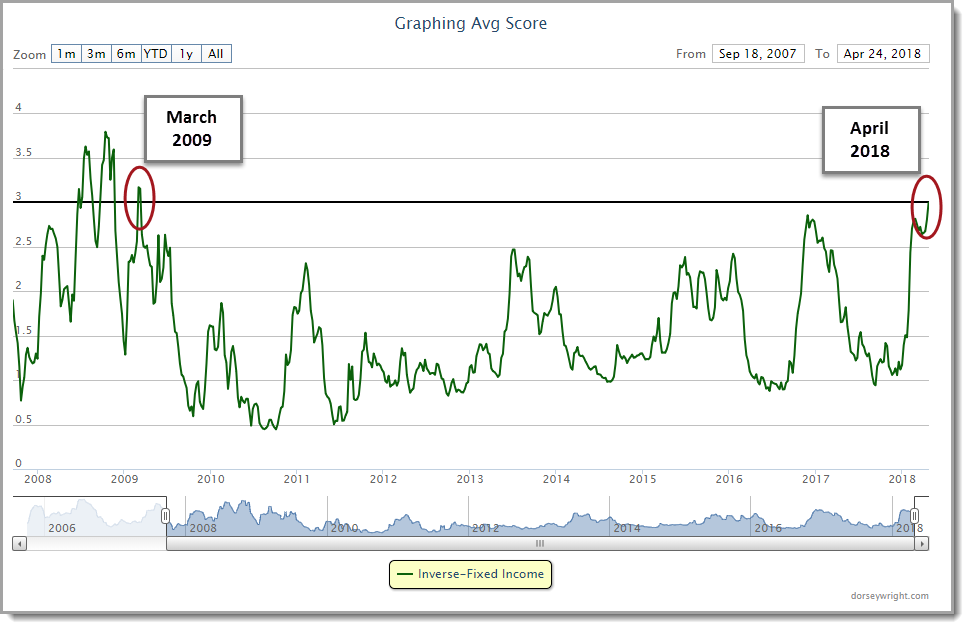
In what can be viewed as a related development, we have also seen the average group score for the Inverse Fixed Income group cross above the 3.0 score threshold for the first time since March 2009. The rise in rates has been accompanied by a general weakening across most segments of the fixed income market and currently, there are only two other fixed income groups – Floating Rate and Convertible Bonds – which rank above the 3.0 threshold.
While, TNX has reached its highest level in several years, the iShares US Core Bond ETF AGG, which is often used a general proxy for the U.S. bond market at-large, gave a fresh sell signal on its default chart on 4/20 and currently sits at its lowest level since December 2013.

With the weakness we are seeing across much of the fixed income market, you may wish to consider incorporating some less-rate-sensitive instruments in your clients’ fixed income allocations. Some potential segments to consider include: convertible bonds, floating rate bonds, high yield bonds, and target maturity ETFs, which can be used to create a held-to-maturity portfolio.
Remember, these are technical comments only. Just as you must be aware of fundamental data for the stocks we recommend based on technical criteria in the report, so too must you be aware of important data regarding delivery, market moving government releases, and other factors that may influence commodity pricing. We try to limit our technical comments to the most actively traded contracts in advance of delivery, but some contracts trade actively right up to delivery while others taper off well in advance. Be sure you check your dates before trading these contracts. For questions regarding this section or additional coverage of commodities email ben.jones@dorseywright.com.
Data represented in the table below is through 04/24/2018:
Broad Market Commodities Report
| Symbol | Name | Price | Trend | RS Signal | RS Col. | 200 Day MA | Weekly Mom |
| CL/ | Crude Oil Continuous | 67.85 | Positive | Buy | X | 56.47 | +3W |
| DBLCIX | Deutsche Bank Liquid Commodities Index | 361.05 | Negative | Sell | O | 333.01 | +6W |
| DWACOMMOD | DWA Continuous Commodity Index | 481.20 | Positive | Sell | O | 462.93 | +2W |
| GC/ | Gold Continuous | 1333.00 | Positive | Buy | X | 1302.56 | -1W |
| GN/Y | S&P GSCI Index Spot | 470.42 | Positive | Sell | X | 420.46 | +3W |
| HG/ | Copper Continuous | 3.14 | Positive | Buy | X | 3.05 | +2W |
| ZG/ | Corn (Electronic Day Session) Continuous | 381.25 | Positive | Sell | X | 358.82 | -3W |
US Dollar Update:
The Distribution Report below places Major Market ETFs and Indices into a bell curve style table based upon their current location on their 10-week trading band. The middle of the bell curve represents areas of the market that are "normally" distributed, with the far right being 100% overbought on a weekly distribution and the far left being 100% oversold on a weekly distribution. The weekly distribution ranges are calculated at the end of each week, while the placement within that range will fluctuate during the week. In addition to information regarding the statistical distribution of these market indexes, a symbol that is in UPPER CASE indicates that the RS chart is on a Buy Signal. If the symbol is dark Green then the stock is on a Point & Figure buy signal, and if the symbol is bright Red then it is on a Point & Figure sell signal.
The average Bullish Percent reading this week is 48.09% down 0.22% from the previous week
| <--100 | -100--80 | -80--60 | -60--40 | -40--20 | -20-0 | 0-20 | 20-40 | 40-60 | 60-80 | 80-100 | 100-> | |||
|
||||||||||||||
| Symbol | Name | Symbol | Name |
| AGG | iShares US Core Bond ETF | NASD | Nasdaq Composite |
| CL/ | Crude Oil Continuous | NDX | NASDAQ-100 Index |
| DJIA | Dow Jones Industrial Average | RSP | Guggenheim S&P 500 Equal Weight ETF |
| DVY | iShares Dow Jones Select Dividend Index | RUT | Russell 2000 Index |
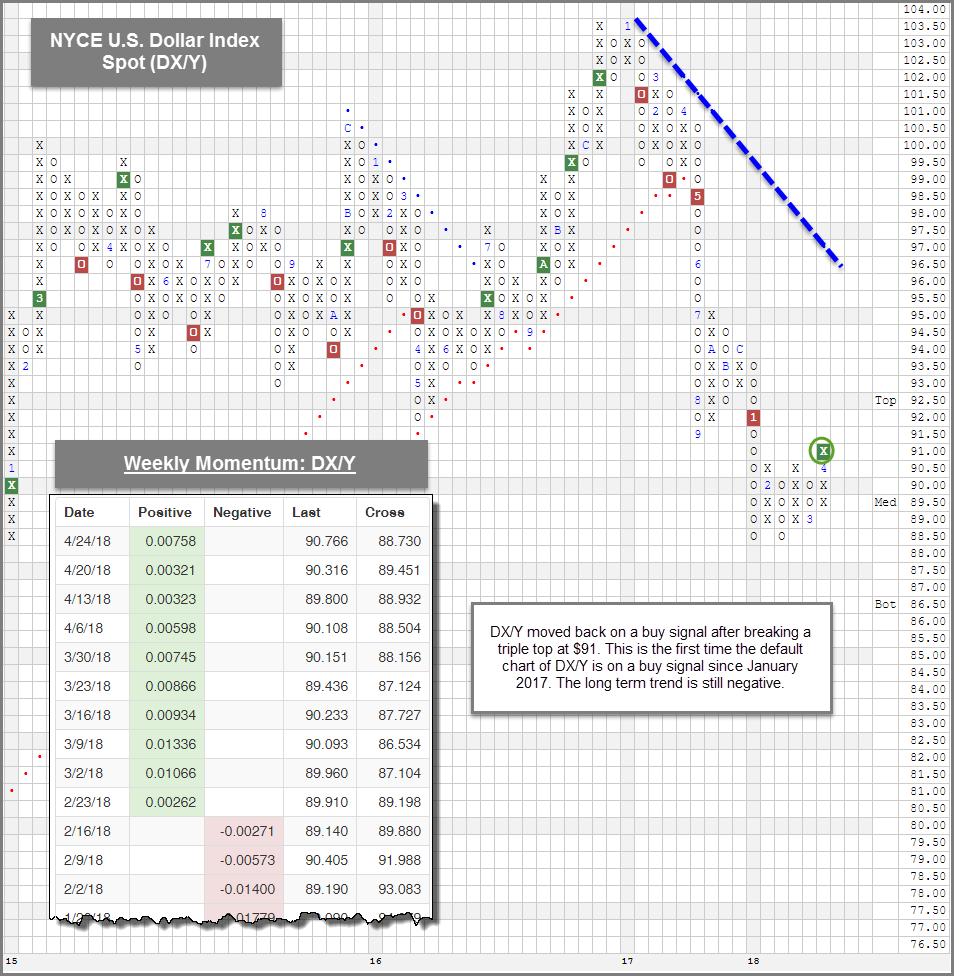
| DX/Y | NYCE U.S.Dollar Index Spot | SHY | iShares Barclays 1-3 Year Tres. Bond Fund |
| EFA | iSharesMSCI EAFE Index Fund | SML | S&P 600 Small Cap Index |
| FXE | CurrencyShares Euro Trust | SPX | S & P 500 Index |
| GC/ | Gold Continuous | TLT | iShares Barclays 20+ Year Treasury Bond Fund |
| GSG | iShares S&P GSCI Commodity-Indexed Trust | UV/Y | Continuous Commodity Index |
| HYG | iShares iBoxx $ High Yield Corporate Bond ETF | VOOG | Vanguard S&P 500 Growth ETF |
| ICF | iShares Cohen & Steers Realty Index | VOOV | Vanguard S&P 500 Value ETF |
| IEF | iShares Barclays 7-10 Yr. Tres. Bond Fund | VWO | Vanguard FTSE Emerging Markets ETF |
| LQD | iShares iBoxx $ Investment Grade Corp. | XLG | Guggenheim S&P 500 Top 50 ETF |
| MID | S&P 400 MidCap Index |
In the Optionable Universe, this week we saw 12 relative strength buy signals compared to 15 last week. On the sell side, there were 12 relative strength sell signals compared to 3 last week.
| Symbol | Company | Sector | Price | RS vs Market Signal | RS vs Market Column | RS vs Peer Signal | RS vs Peer Column | Trend |
|---|---|---|---|---|---|---|---|---|
| BGFV | Big 5 Sporting Goods Corp. | Retail | 9.000 | Buy | X | Sell | X | 3 |
| PDCE | PDC Energy Inc | Oil Drilling, Equipment Svcs | 54.730 | Buy | X | Sell | X | 4 |
| PFSW | Pfsweb Inc. | Industrial Goods & Svcs | 9.560 | Buy | X | Buy | X | 4 |
| MMYT | Makemytrip Limited | Cyclical Goods and Services | 34.750 | Buy | X | Sell | X | 4 |
| KORS | Michael Kors Holdings Limited | Cyclical Goods and Services | 67.690 | Buy | X | Buy | X | 5 |
| MTDR | Matador Resources Company | Oil Companies Secondary | 33.300 | Buy | X | Buy | X | 5 |
| RELL | Richardson Electronics LTD | Industrial Goods & Svcs | 9.170 | Buy | X | Sell | X | 3 |
| RIG | Transocean Ltd. | Oil Drilling, Equipment Svcs | 12.450 | Buy | X | Buy | X | 4 |
| ANDV | Andeavor | Oil Companies Secondary | 118.920 | Buy | X | Buy | X | 4 |
| SPWR | Sunpower Corporation | Industrial Goods & Svcs | 8.930 | Buy | X | Sell | X | 3 |
| TCS | The Container Store Group, Inc. | Retail | 6.130 | Buy | X | Sell | X | 3 |
| REI | Ring Energy, Inc. | Oil Companies Major | 15.980 | Buy | X | Buy | X | 5 |
| Symbol | Company | Sector | Price | RS vs Market Signal | RS vs Market Column | RS vs Peer Signal | RS vs Peer Column | Trend |
|---|---|---|---|---|---|---|---|---|
| JNP | Juniper Pharmaceuticals Inc. | Pharmaceuticals | 8.000 | Sell | O | Buy | O | 2 |
| HUBB | Hubbell Inc | Industrial Goods & Svcs | 109.350 | Sell | O | Buy | O | 1 |
| CLVS | Clovis Oncology Inc | Biotechnology | 46.260 | Sell | O | Sell | O | 0 |
| LAMR | Lamar Advertising Company | Media | 62.510 | Sell | O | Buy | O | 1 |
| NTES | Netease.com Inc. (China) ADR | Technology Services | 254.100 | Sell | O | Sell | O | 0 |
| MWA | Mueller Water Products, Inc. | Industrial Goods & Svcs | 10.010 | Sell | O | Sell | O | 1 |
| PZN | Pzena Investment Management, Inc. | Financial Services | 9.140 | Sell | O | Sell | O | 0 |
| SNBR | Sleep Number Corp. | Cyclical Goods and Services | 29.240 | Sell | O | Buy | O | 1 |
| VNET | 21Vianet Group Inc | Technology Services | 5.770 | Sell | O | Sell | O | 0 |
| TSRO | TESARO Inc. | Pharmaceuticals | 53.020 | Sell | O | Buy | O | 1 |
| CTRE | CareTrust REIT Inc | Equity REITs | 12.880 | Sell | O | Buy | O | 2 |
| PM.TR | Philip Morris International Inc. TR | Noncyclical Goods and Svcs | 84.213 | Sell | O | Buy | O | 1 |
| Comments |
|---|
| EFSC Enterprise Financial ($50.65) - Banks - EFSC broke a triple top at $50, which marks a new all-time high. The stock just flipped to positive weekly momentum and boasts 5 for 5'er status so those interested may initiate positions on this breakout. Support is offered in the mid and lower $40's from here. |
| ENB Enbridge Inc. ($29.27) - Gas Utilities - ENB broke a double bottom at $29 with the most recent action, marking the fourth consecutive sell signal on the chart. This stock is now trading at new 52 week lows and is a weak 0 for 5’er within the unfavored Gas Utilities sector. Avoid as supply is in control and the technical picture is weak. |
| EW Edwards Lifesciences Corporation ($129.52) - Healthcare - EW broke a triple bottom at $132 and continued lower intraday to $124 before rebounding to roughly $129 by market close. Traders may exit positions here, while investors may look to a trend violation as a stop since the weight of technical evidence is still strong otherwise. No new positions here. |
| GD General Dynamics Corporation ($214.53) - Aerospace Airline - GD broke a double bottom at $212 and continued lower intraday to $208 following its earnings release. This is the first sell signal in a strong uptrend so we will give the stock the benefit of the doubt here. Those long may continue to hold the 4 for 5'er. No new positions are advised at this time. Those long may look to further support at $204 and $196. |
| GOL Gol Intelligent Airlines Inc. (Brazil) ADR ($10.97) - Aerospace Airline - GOL broke a double bottom at $11.50 and continued lower intraday to $11. The stock continues to offer all five positive technical attributes and ranks in the top decile of the Aerospace Airline sector matrix so those long may continue to hold here. Traders may sell on this breakdown or a subsequent reversal back into X's from here. No new positions at this time. The next level of support is visible at $10. |
| LBRDA Liberty Broadband Corp ($81.11) - Media - LBRDA broke a double bottom at $80, completing a bearish catapult on the chart. This move also broke a spread quintuple bottom, taking out support dating back to May 2017. This stock is a weak 0 for 5’er as it does not have any positive trending or RS characteristics in its favor at this time. Additionally, the price objective is $68, adding to the negative technical picture. Avoid. |
| LMT Lockheed Martin Corporation ($329.50) - Aerospace Airline - LMT broke a spread quadruple bottom at $324, taking out support from the February pullback. The stock is still trading sideways in a range bound pattern so those long may trim here if wanted, but we would wait for another sell signal or an indication that supply is getting stronger before removing all exposure. The stock continues to offer 4 positive technical attributes and ranks in the top half of the Aerospace Airline sector matrix at this time. No new positions here. |
| OSTK Overstock.Com, Inc. ($34.45) - Internet - OSTK broke a double bottom at $35 and moved lower to $34 with Wednesday’s trading session. This stock is a weak 0 for 5’er within the Internet sector that does not have any positive trending or RS characteristics in its favor at this time. Monthly momentum has been negative for two months, suggesting the potential for lower prices. Avoid. From here, earnings are slated for 5/2. |
| SOHU Sohu.com Inc. ($27.28) - Internet - After a negative reaction to earnings, SOHU broke a double bottom at $29 and moved lower to $27, marking a new multi-year low on the chart. This is the fourth consecutive sell signal on the chart for this 0 for 5’er within the Internet sector. Monthly momentum has been negative for 5 months, suggesting the potential for lower prices. Avoid as there are stronger names in this space. |
| YY YY Inc ($91.89) - Software - YY broke a triple bottom at $90 and moved lower to $89 with Wednesday’s market action. This stock is a weak 2 for 5’er that moved into a negative trend in March of this year. Monthly momentum has been negative for two months, suggesting the potential for lower prices. This recent break marks the sixth consecutive sell signal on the chart since March. Avoid as supply is in control and the technical picture is deteriorating. Note earnings are expected 5/8. |
| Name | Option Symbol | Action | Stop Loss |
|---|---|---|---|
| Cadence Design Systems, Inc. - $39.56 | O:CDNS 18H35.00D17 | Buy the August 35.00 calls at 5.80 | 35.00 |
| Name | Option | Action |
|---|---|---|
| American Express Company ( AXP) | Jun. 92.50 Calls | Stopped at 8.45 (CP: 7.10) |
| ConocoPhillips ( COP) | Aug. 52.50 Calls | Stopped at 12.35 (CP: 11.80) |
| Teradyne, Inc. ( TER) | Oct. 43.00 Calls | Stopped at 40.00 (CP: 34.56) |
| Name | Option Symbol | Action | Stop Loss |
|---|---|---|---|
| Nordstrom, Inc. - $48.73 | O:JWN 18S52.50D20 | Buy the July 52.50 puts at 5.60 | 51.00 |
| Name | Option | Action |
|---|---|---|
| Perrigo Co. PLC (PRGO) | Aug. 85.00 Puts | Initiate a stock price stop of 85.00 (CP: 78.31) |
| Simon Property Group, Inc. (SPG) | Jul. 155.00 Puts | Raise the option stop loss to 9.60 (CP: 11.60) |
| Name | Option Sym. | Call to Sell | Call Price | Investment for 500 Shares | Annual Called Rtn. | Annual Static Rtn. | Downside Protection |
|---|---|---|---|---|---|---|---|
| Cree Research Inc $39.36 | O:CREE 18I40.00D21 | Sep. 40.00 | 3.70 | $18,050.35 | 23.79% | 22.18% | 8.30% |
| Name | Action |
|---|---|
| First Solar, Inc. (FSLR) - 74.07 | Sell the September 75.00 Calls. |
| Avis Budget Group, Inc. (CAR) - 47.60 | Sell the August 52.50 Calls. |
| Deckers Outdoor Corporation (DECK) - 90.82 | Sell the September 97.50 Calls. |
| First Solar, Inc. (FSLR) - 74.07 | Sell the September 75.50 Calls. |
| Take-Two Interactive Software, Inc. (TTWO) - 96.38 | Sell the September 100.00 Calls. |
| Lam Research Corporation (LRCX) - 185.82 | Sell the August 195.00 Calls. |
| Name | Covered Write |
|---|---|
| Urban Outfitters, Inc. ( URBN - 38.64 ) | September 39.00 covered write. |
| Boyd Gaming Corp ( BYD - 34.24 ) | September 37.00 covered write. |
| Urban Outfitters, Inc. ( URBN - 38.64 ) | September 42.00 covered write. |
Daily Equity & Market Analysis
Loading, Please Wait...

Create Portfolio