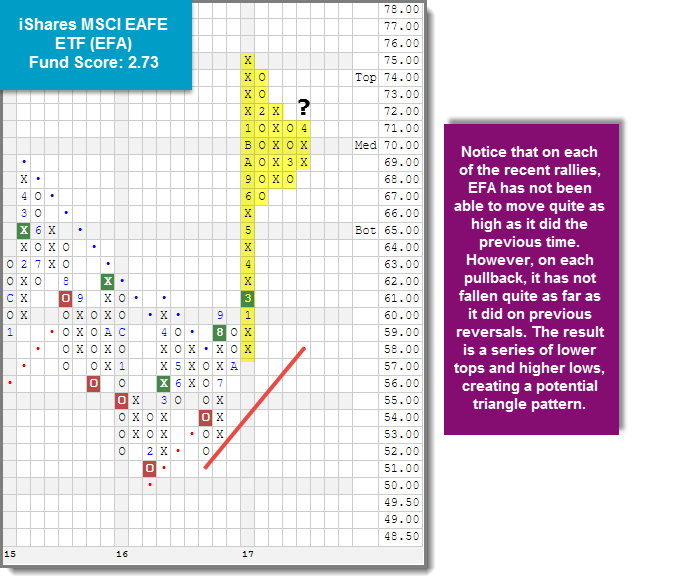
It was a negative week overall in terms of performance as each of the 10 major market ETFs covered in this report finished in the red, with four losing more than -3%. Today we examine the potential triangle pattern forming on the chart of the iShares MSCI EAFE ETF (EFA)
Portfolio View - Major Market ETFs
| Symbol | Name | Price | Yield | Trend | RS Signal | RS Col. | Score | 200 Day MA | Weekly Mom |
| DIA | SPDR Dow Jones Industrial Average ETF Trust | 240.09 | 2.04 | Positive | X | 3.38 | 236.54 | +1W | |
| EFA | iShares MSCI EAFE ETF | 70.67 | 2.55 | Positive | Sell | O | 2.73 | 69.39 | +3W |
| FRN | PowerShares Frontier Markets ETF | 15.82 | 3.40 | Positive | Sell | X | 4.25 | 15.12 | -5W |
| IJH | iShares S&P MidCap 400 Index Fund | 188.43 | 1.29 | Positive | Buy | X | 4.05 | 183.95 | +1W |
| IJR | iShares S&P SmallCap 600 Index Fund | 78.66 | 1.19 | Positive | Buy | X | 5.41 | 74.80 | +1W |
| QQQ | PowerShares QQQ Trust | 158.46 | 0.82 | Positive | Buy | X | 5.14 | 154.54 | -6W |
| RSP | PowerShares S&P 500 Equal Weight ETF | 99.45 | 1.63 | Positive | Buy | X | 4.55 | 98.23 | +1W |
| SPY | SPDR S&P 500 ETF Trust | 262.98 | 1.85 | Positive | O | 2.45 | 260.48 | +1W | |
| VWO | Vanguard FTSE Emerging Markets ETF | 45.62 | 2.36 | Positive | Sell | O | 4.64 | 45.47 | -6W |
| XLG | PowerShares S&P 500 Top 50 ETF | 185.68 | 1.89 | Positive | O | 2.26 | 185.31 | +1W |
Additional Comments:
It was a negative week overall in terms of performance as each of the 10 major market ETFs covered in this report finished in the red, with four losing more than -3%. The biggest mover among the group was the PowerShares QQQ Trust QQQ, which dropped -4.60% from 4/17 – 4/24. The iShares MSCI EAFE ETF EFA fared the best, losing just -0.77%. Turning our attention to the chart of EFA below, we can see a familiar pattern forming on the chart. As a refresher, the triangle pattern is created when a chart makes a series of lower tops while at the same time making higher bottoms. This action creates what looks exactly like a triangle from geometry class. One case in point is the chart of the EFA below. Notice that on each of the recent rallies, it has not been able to move quite as high as it did the previous time. However, on each pullback, it has not fallen quite as far as it did on previous reversals. The result is a series of lower tops and higher bottoms, creating a potential triangle pattern. At this point, if the price continues to move higher from here, the triangle will be completed to the upside (a bullish triangle) with a move to $73. On the other hand, a move to $67 or below would complete a bearish triangle pattern. With a fund score of 2.73 coupled with a price target of $77; we will be keeping a watchful eye on this trend chart to see if the EFA is able to hold key support levels.