A technical review of the Dollar
Remember, these are technical comments only. Just as you must be aware of fundamental data for the stocks we recommend based on technical criteria in the report, so too must you be aware of important data regarding delivery, market moving government releases, and other factors that may influence commodity pricing. We try to limit our technical comments to the most actively traded contracts in advance of delivery, but some contracts trade actively right up to delivery while others taper off well in advance. Be sure you check your dates before trading these contracts. For questions regarding this section or additional coverage of commodities email ben.jones@dorseywright.com.
Data represented in the table below is through 04/24/2018:
Broad Market Commodities Report
Portfolio View - Commodity Indices
| Symbol | Name | Price | Trend | RS Signal | RS Col. | 200 Day MA | Weekly Mom |
| CL/ | Crude Oil Continuous | 67.85 | Positive | Buy | X | 56.47 | +3W |
| DBLCIX | Deutsche Bank Liquid Commodities Index | 361.05 | Negative | Sell | O | 333.01 | +6W |
| DWACOMMOD | DWA Continuous Commodity Index | 481.20 | Positive | Sell | O | 462.93 | +2W |
| GC/ | Gold Continuous | 1333.00 | Positive | Buy | X | 1302.56 | -1W |
| GN/Y | S&P GSCI Index Spot | 470.42 | Positive | Sell | X | 420.46 | +3W |
| HG/ | Copper Continuous | 3.14 | Positive | Buy | X | 3.05 | +2W |
| ZG/ | Corn (Electronic Day Session) Continuous | 381.25 | Positive | Sell | X | 358.82 | -3W |
US Dollar Update:
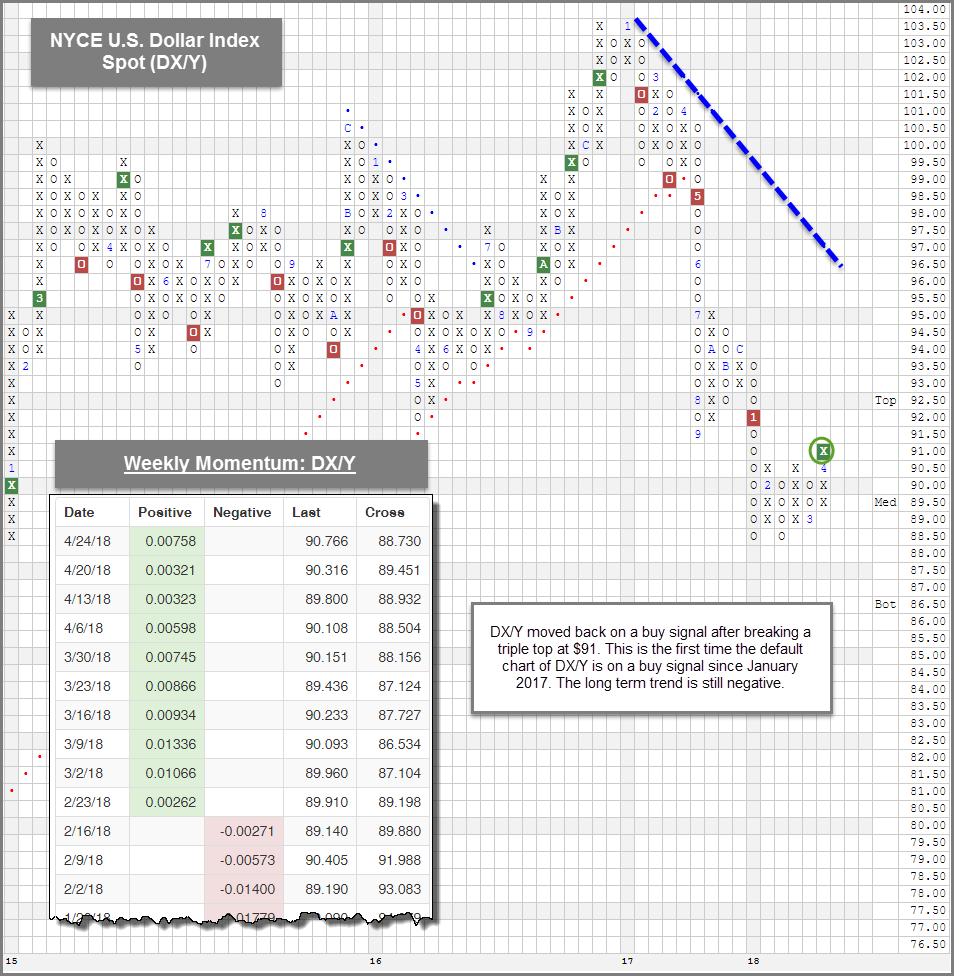
- Dollar hits 3-month high as 10-year yield rises above 3% - The default chart of the NYSE US Dollar Index Spot DX/Y returned to a buy signal after it broke a triple top at $91.00 on Tuesday, April 24th, 2018. The move took DX/Y through resistance that goes back to the February 2018 reversal high at $90.50. DX/Y's trend chart is now on a Point & Figure buy signal for the first time since December 2017.
- Trend - The long term trend of DX/Y remains negative, as it continues to trade beneath the bearish resistance line. That said, the breakout is a reprieve against a sell-off that can began early last year. There's still a big "air pocket" between the current levels of the DX/Y versus the trendline, so we would still have to see DX/Y rally over 6% before it would test the negative trendline.
- Momentum - The recent breakout occurs after a 10+ week period of positive weekly momentum for the DX/Y. Typically we see weekly momentum, on average, stay positive between seven to eight weeks. This to say that recent breakout could occur right when the DX/Y's short term momentum has been exhausted. This will be something to monitor going forward.
- Asset Class Implications - For a review of what areas do well in a rising dollar market or falling dollar market, we recommend reviewing our US Dollar and Asset Classes Study. Typically in rising dollar markets, which have yet to officially enter, US Equities, particularly the Growth style box, have been one of the best performing areas in the market. Small Cap tends to outperform Large Cap, and International Equities generally underperforms US Equities. Gold has historically shown negative average returns in rising dollar environments as well. Here's a look at the study - US Dollar and Asset Classes Study.