The Cash Percentile Rank for International Equities has fallen down to 0% as the strength in the International Equity markets continues to broaden.
Our primary tool for understanding where things stand from a relative strength standpoint is the Dynamic Asset Level Investing Tool, or DALI for short. The tool will help us identify which asset classes are favored as well as unfavored. Not only does it do that for us, but DALI also provides metrics that help us identify whether the individual asset class may be weakening versus cash. The main metric we typically focus on to understand that relationship is called Cash Percentile Rank.
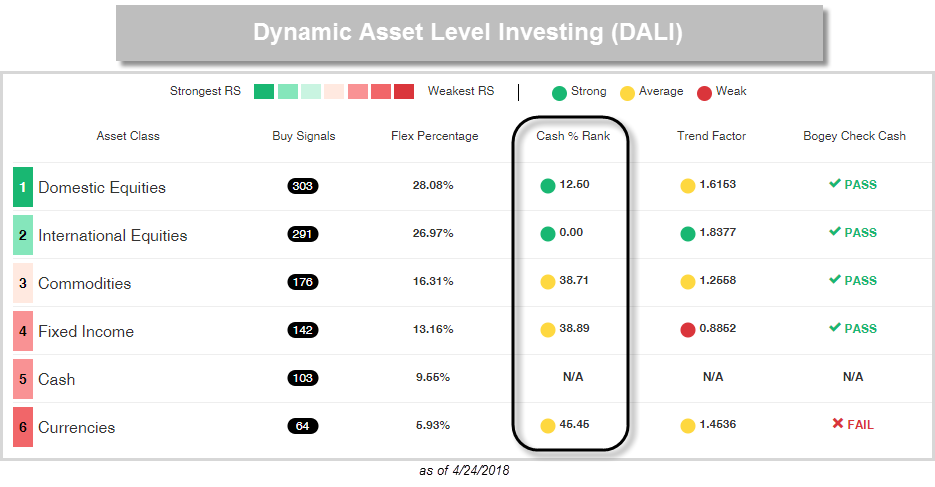
Cash Percentile Rank simply measures how a cash proxy (typically the DWA Money Market Proxy – 13 Week T-Bill MNYMKT) is doing relative to the proxies that make up a particular asset class within DALI. The Cash Percentile Rank, as seen in the image below, can be found on the DALI details page. At this time, the Cash Percentile Ranks for US and International Equities are 12.50% and 0%, respectively, which suggests that a majority of the asset class proxies are showing better relative strength than cash. Meanwhile, the majority of Commodities, Fixed Income, and even Currencies still rank better than cash. Although we do see that majority of our proxies in US and International are better than cash, it is always beneficial to know the lay of the land and also have a risk management tool that we can fall back on at any time. Today we wanted to take a closer look at the Cash Percentile Rank measure for International Equities.
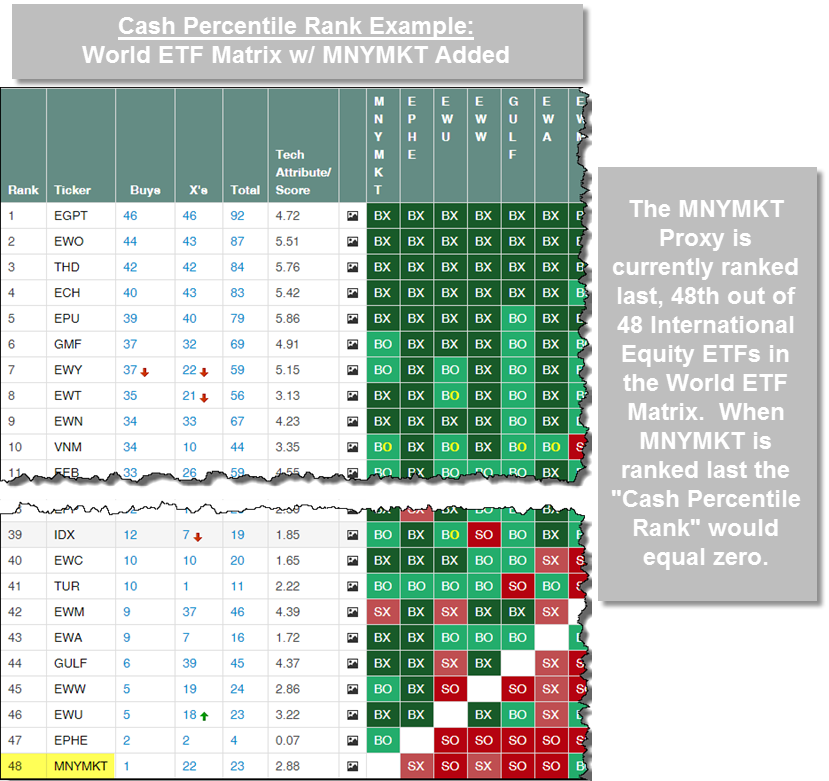
Like DALI, the Cash Percentile Rank concept is driven by DWA RS Matrix tool. In order to construct a Cash Percentile Rank reading for a group of stocks, ETFs, or mutual funds, we simply add the DWA Money Market Proxy – 13 Week T-Bill MNYMKT to the matrix universe and then calculate what percentile it ranks within the matrix. We evaluate these matrices on a daily basis to see where cash resides and then display the results in DALI, using a traffic light of sorts, assigning the specific asset class either a green, yellow, or red light. If cash resides in the bottom third of the matrix, this suggests poor RS for cash versus others in the matrix, so it gets a green light. As cash rises in the matrix and moves into the middle third, the light turns yellow. This would suggest that members of the asset class are starting to falter and that we should takes a more cautious approach or perhaps hedge our exposure to that asset class. If cash ascends to the top third of the matrix, the light will turn red, indicating that on an aggregate basis, the asset class has weakened enough to make cash as a better overall investment choice relative to that particular asset classes. In the image below we have shown an example of an already constructed matrix with International Equity ETFs and a cash proxy.
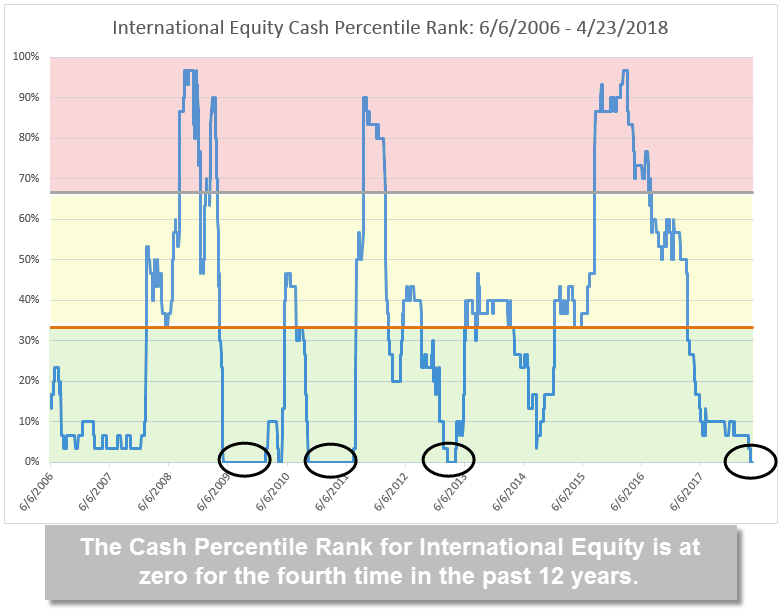
For perspective on how the Cash Percentile Rank fluctuates we have shown the Cash Percentile Rank history for International Equities going back to 2006. The higher the reading is, the higher our cash proxy ranks within the matrix. In other words, the International Equity proxies are weak relative to cash so it's better to take a more defensive approach to equity exposure. Notice that in the graph below, the Cash Percentile Rank value hit its high levels in the mid 2008 and 2016. During these times, the light we have made reference to in prior examples was red. Since 2016, the Cash Percentile Rank has steadily declined moving below 33% in March 2017 and just this month (April 9th) the Cash Percentile Rank for International Equity fell to 0%. This suggests that all of the International Equity proxies in the ranking are currently above the Money Market Proxy. This is the fourth time in the past 12 years that the International Equity Cash Percentile Ranking has been at 0%. The other time periods were late 2009 / early 2010, mid 2010 to mid 2011, and early 2013. This is all to say that despite the market volatility of late the International Equity markets continue to show a positive picture. Additionally, the fact that the Money Market Proxy sits in the last position suggests there is a wide breadth of strength in the International Markets. As we move forward the Cash Percentile Rank is another positive sign for International Equities, and as long as that number stays below 33%, will continue to be indicative of a healthy relative strength picture for the International Markets.