Most Requested Symbols

This weekend brought several notable developments to the global marketplace as the United States moved to oust Venezuelan President Nicolás Maduro. What price movement do you need to know about?
The end of Q3 brings about the quarterly evaluations for our large-cap (PDP) and small-cap (DWAS) momentum strategies. Both saw a handful of trades as leadership trends.
Weekly Rundown Video – Dec 30, 2025
Weekly rundown with NDW analyst team covering all major asset classes.
Weekly rundown with NDW analyst team covering all major asset classes.
This weekend brought several notable developments to the global marketplace as the United States moved to oust Venezuelan President Nicolás Maduro. It goes without saying that any uptick in geopolitical conflict leaves the door open for heightened volatility, and Venezuela’s position as a leader of global oil reserves makes the move particularly interesting. There are largely two trains of thought regarding the overall impact on oil/energy prices, which remained largely steady on Monday’s open (CL/ gained ~1% in the morning). The first is that heightened US influence could unlock more of Venezuela’s reserves, unleashing supply which would put downward pressure on energy prices. The second idea suggests that any unrest in energy driven regions could hamper near-term production, decreasing supply (and increasing uncertainty…) which would push overall prices higher. While the true outcome is likely somewhere in the middle, the weekend’s events gives us the opportunity to look around the globe to see how price is reacting in the near-term… and what you might monitor as the situation develops. Note that our commodity charts don't update with intraday action, so the chart below doesn't take into account movement on 1/5.

Energy names popped as markets opened for the day before tapering off throughout the morning. With that said, broad energy representative XLE managed to notch intraday highs above $47, enough to post a bullish catapult on its default chart. While the energy space remains a relative laggard on our longer-term rankings, its admittedly limited performance so far this year has been impressive (+~4.5% as of Monday morning). It’s long term fund score could certainly stand for some overall improvement as it sits as 2.73, but a trip above 3.0 would mark the fund’s first test of NDW’s “acceptable” status since March of 2025.

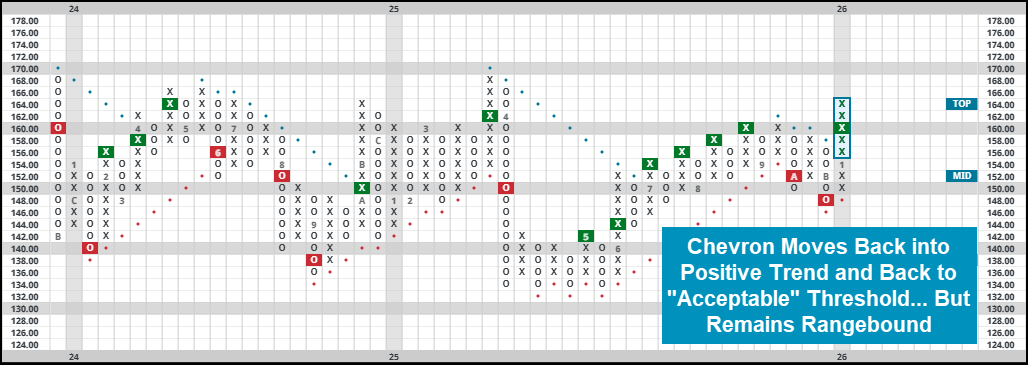
Chevron Corp (CVX) rallied on the news as the energy giant already has “significant” exposure to the country (CNBC). Shares advanced as much 6.5% for the day before trailing off slightly… but the move was enough to push it back into a positive trend to earn its third technical attribute point. While the stock will now be considered technically actionable, note that overall performance has been lackluster for the better part of the last three years. We will continue to monitor some stiff resistance in the low $170’s going forward.
Other areas typically associated with global unrest also moved higher on Monday. Silver and Gold continued higher after the space saw some relatively large swings to close out the last year. They continue to trade around their own respective highs and should continue to flex their muscles at the top of the rankings if further uncertainty is in store. Our last comment today will swirl around aerospace and defense names, a group which tends to excel during times of global unrest. The First Trust Indexx Aerospace & Defense ETF (MISL) gained roughly 3% with intraday action on Monday, having now gained just over 6% so far in 2026. While the move brings it up into heavily overbought territory, the technical picture remains quite strong. MISL was a recent addition to the Focus Five Model, which has put in a strong start to the new year. PPA is another focused aerospace and defense fund you could look toward.
Remember, any time there is a rapidly developing story, there will be headlines and an influx of calls from clients asking how they are positioned in the event things go haywire. Our job is to remain objective and let price be our guide. Utilize the charts to find levels of price that are important and set alerts to be notified as the full picture develops.


Momentum had a mixed performance across Q4, capping off what has been a mixed year for momentum. Large cap momentum strategies pulled back in Q4 after a productive Q3, lagging across the full year as many of those names were unable to make up the for the disruption early in the year. On the other hand, small cap momentum strategies flourished in the fourth quarter, with consistent small cap leadership serving as a tailwind for the space to close out 2025.
The performance table below compares the price return of the Invesco Dorsey Wright Momentum ETF PDP and the Invesco Dorsey Wright SmallCap Momentum ETF DWAS to their respective benchmarks through the first three quarters, while the two bottom tables compare their YTD return against the same timeframe in prior years.

Our approach toward momentum through relative strength analysis looks to capitalize on consistent trends across the market. Changing trends cause the portfolios to readjust to maintain exposure to the strongest areas. Underperformance is typical during those environments as areas that had demonstrated relative strength fall in our rankings. The most important step in our approach comes next – those areas that have declined in strength are sold to make room for the new leaders. Any investment process is going to produce a portfolio of winners and losers. Relative strength analysis gives us a systematic way to cull the losers and constantly push the portfolio toward the strongest areas of the market.
In the most recent quarter (Q3) we saw 50 changes (out of 100 holdings) in PDP and 111 changes (out of 200 holdings) in DWAS, repositioning both portfolios toward areas of leadership as we enter the second quarter. That is more than we saw last quarter, and even more than the quarters prior to that as market leadership continues to find steady footing.
Below you'll find an update about the specific changes made in both strategies with the most recent index reconstitution. Keep in mind that removed positions likely no longer maintain characteristics of superior relative strength; meanwhile, additions have improved to a place of leadership and could be ideas to consider.
Invesco DWA Momentum ETF (PDP)
The stock-selection process behind the Invesco Dorsey Wright Momentum ETF (PDP) is simple yet robust. Every quarter, we apply the Relative Strength process to compare approximately 1,000 large and mid-cap US stocks and select the strongest 100 names. The quarterly reconstitution process's goal is to weed out the weak names and realign the portfolio toward strength. As mentioned before, with this most recent reconstitution and rebalance, we removed 50 stocks and added 50 new stocks, which we've compiled in the tables below. Several observations:


Invesco DWA SmallCap Momentum ETF (DWAS)
The stock-selection process used in DWAS is like PDP. Every quarter, we apply the Relative Strength process to compare approximately 2,000 US-listed small-cap stocks and select the strongest 200 names. With this most recent reconstitution and rebalance we pushed the portfolio towards strength by removing 100 stocks and adding 100 new stocks, which we've outlined in the table below. However, and perhaps unique to DWAS, not all stocks that were removed are technically weak. We have received this question in the past, so we want to address it here.
One reason for these removals is due to stocks exceeding the market cap filter. High-momentum stocks should, ideally, increase in market cap which means that sometimes a name will exceed the small-cap maximum at the end of a quarter. This is not the norm, but worth keeping in mind when reviewing the changes. Several takeaways:


Disclosures:
This article is intended for Financial Professional Use Only.
Management and other expenses can have a material impact on performance when compounded over time. Past performance, hypothetical or actual, does not guarantee future results. In all securities trading there is a potential for loss as well as profit. It should not be assumed that recommendations made in the future will be profitable or will equal the performance as shown.
Click here for more information from Invesco on the Invesco DWA Momentum ETF (PDP): https://www.invesco.com/us/financial-products/etfs/product-detail?audienceType=Investor&ticker=PDP
Click here for more information from Invesco on the Invesco DWA SmallCap Momentum ETF (DWAS): https://www.invesco.com/us/financial-products/etfs/product-detail?audienceType=Investor&productId=ETF-DWAS
Dorsey, Wright & Associates, LLC is owned by Nasdaq, Inc. and we have affiliates who also provide financial services, research, information, and act as Brokers/Dealers to a wide variety of clients. Our affiliates use the information we create to create indexes, which are then used to create Exchange Traded Funds. These things create a potential conflict of interest in that we may have an incentive to promote or use the products and services of our affiliates and business partners. A number of Dorsey Wright representatives are registered with and hold securities licenses with the affiliate broker-dealers. In this capacity, they assist with the marketing and distribution of Exchange Traded Products.
Average Level
2.87
| < - -100 | -100 - -80 | -80 - -60 | -60 - -40 | -40 - -20 | -20 - 0 | 0 - 20 | 20 - 40 | 40 - 60 | 60 - 80 | 80 - 100 | 100 - > |
|---|---|---|---|---|---|---|---|---|---|---|---|
|
Buy signalVOOV
|
|||||||||||
|
Sell signaluso
|
Buy signalVOOG
|
Buy signalgcc
|
|||||||||
|
Sell signalief
|
Buy signalQQQ
|
Buy signalhyg
|
Buy signaldia
|
||||||||
|
Sell signallqd
|
Buy signalgsg
|
Buy signaliwm
|
Buy signalIJH
|
||||||||
|
Buy signalagg
|
Buy signalshy
|
Buy signalSPY
|
Buy signalrsp
|
||||||||
|
Sell signaldx/y
|
Buy signalXLG
|
Buy signalijr
|
Buy signalfxe
|
Buy signalGLD
|
|||||||
|
Sell signaltlt
|
Sell signalicf
|
Buy signalONEQ
|
Buy signaldvy
|
Buy signalefa
|
Buy signalEEM
|
||||||
| < - -100 | -100 - -80 | -80 - -60 | -60 - -40 | -40 - -20 | -20 - 0 | 0 - 20 | 20 - 40 | 40 - 60 | 60 - 80 | 80 - 100 | 100 - > |
| AGG | iShares US Core Bond ETF |
| USO | United States Oil Fund |
| DIA | SPDR Dow Jones Industrial Average ETF |
| DVY | iShares Dow Jones Select Dividend Index ETF |
| DX/Y | NYCE U.S.Dollar Index Spot |
| EFA | iShares MSCI EAFE ETF |
| FXE | Invesco CurrencyShares Euro Trust |
| GLD | SPDR Gold Trust |
| GSG | iShares S&P GSCI Commodity-Indexed Trust |
| HYG | iShares iBoxx $ High Yield Corporate Bond ETF |
| ICF | iShares Cohen & Steers Realty ETF |
| IEF | iShares Barclays 7-10 Yr. Tres. Bond ETF |
| LQD | iShares iBoxx $ Investment Grade Corp. Bond ETF |
| IJH | iShares S&P 400 MidCap Index Fund |
| ONEQ | Fidelity Nasdaq Composite Index Track |
| QQQ | Invesco QQQ Trust |
| RSP | Invesco S&P 500 Equal Weight ETF |
| IWM | iShares Russell 2000 Index ETF |
| SHY | iShares Barclays 1-3 Year Tres. Bond ETF |
| IJR | iShares S&P 600 SmallCap Index Fund |
| SPY | SPDR S&P 500 Index ETF Trust |
| TLT | iShares Barclays 20+ Year Treasury Bond ETF |
| GCC | WisdomTree Continuous Commodity Index Fund |
| VOOG | Vanguard S&P 500 Growth ETF |
| VOOV | Vanguard S&P 500 Value ETF |
| EEM | iShares MSCI Emerging Markets ETF |
| XLG | Invesco S&P 500 Top 50 ETF |

| Symbol | Company | Sector | Current Price | Action Price | Target | Stop | Notes |
|---|---|---|---|---|---|---|---|
| AIT | Applied Industrial Technologies, Inc. | Machinery and Tools | $259.63 | mid 240s - ow 260s | 316 | 208 | 5 for 5'er, top half of favored MACH sector matrix, LT pos peer & mkt RS, pos trend flip, Earn. 1/28 |
| CME | CME Group, Inc. | Wall Street | $269.68 | 260s - 270s | 312 | 224 | 4 for 5'er, middle of WALL sector matrix, triple top breakout, 1.8% yield |
| AFL | AFLAC Incorporated | Insurance | $110.24 | 108 - 115 | 143 | 95 | 4 for 5'er, top half of INSU sector matrix, LT pos peer & mkt RS, spread triple top, 2% yield |
| GFI | Gold Fields Limited (South Africa) ADR | Precious Metals | $43.56 | 40 - 44 | 58 | 35 | 4 for 5'er, top third of PREC sector matrix, LT pos peer & mkt RS, good R-R, 1.8% yield |
| LAMR | Lamar Advertising Company | Media | $124.12 | 120s - low 130s | 158 | 110 | 4 for 5'er, top half of MEDI sector matrix, LT pos peer & mkt RS, spread triple top 4.8% yield |
| ABCB | Ameris Bancorp | Banks | $73.98 | 70s | 92 | 77 | 5 for 5'er, top 25% of BANK sector matrix, LT pos peer RS, spread quintuple top, 1.1% yield, Earn. 1/29 |
| ORI | Old Republic International | Insurance | $43.27 | lo-mid 40s | 76 | 384 | 4 TA rating, top 20% of insurance sector RS matrix, consec buy signals, recent RS buy, R-R > 4, Earn. 1/22 |
| LAZ | Lazard Inc. | Wall Street | $49.74 | hi 40s - low 50s | 69 | 41 | 5 for 5'er, middle of WALL sector matrix, LT pos peer & mkt RS, triple top, buy on pullback, good R-R, Earn. 1/29 |
| HLT | Hilton Worldwide Holdings Inc | Leisure | $292.98 | hi 260s - low 280s | 328 | 240 | 5 for 5'er, top half of LEIS sector matrix LT pos peer & mkt RS, quintuple top |
| HCA | HCA Healthcare Inc. | Healthcare | $470.39 | 450s - lo 500s | 588 | 384 | 5 TA rating, top 20% of HEAL sector matrix, LT RS buy, LT peer RS buy, consec buy signals, buy-on-pullback, Earn. 1/27 |
| LECO | Lincoln Electric Holdings, Inc. | Machinery and Tools | $243.76 | 240s | 320 | 196 | 5 for 5'er, top third of favored MACH sector matrix, LT pos peer & mkt RS, triple top, 1.3% yield |
| THC | Tenet Healthcare Corporation | Healthcare | $199.45 | 190 - mid 200s | 286 | 170 | 5 TA rating, top 50% of HEAL sector matrix, LT RS buy, buy-on-pullback |
| FLS | Flowserve Corporation | Machinery and Tools | $70.75 | hi 60s - lo 70s | 91 | 54 | 5 TA rating, top 10% of MACH sector matrix, LT RS buy, buy-on-pullback |
| BCO | The Brink's Company | Protection Safety Equipment | $116.46 | mid 110s - low 120s | 152 | 104 | 5 for 5'er, top half of PROT sector matrix, LT pos peer & mkt RS, spread triple top, R-R>2.0 |
| GOOGL | Alphabet Inc. Class A | Internet | $315.15 | 300 - hi 320s | 428 | 268 | 5 TA rating, top of INET sector matrix, LT RS buy, buy-on-pullback |
| CUBI | Customers Bancorp Inc | Banks | $74.50 | low-to-mid 70s | 89 | 63 | 4 for 5'er, top 20% of favored BANK sector matrix, RS buy signal, spread quad top, Earn. 1/22 |
| ENS | EnerSys | Electronics | $150.73 | mid 140s - low 150s | 190 | 126 | 4 for 5'er, top 20% of ELEC sector matrix, one box from RS buy signal, quadruple top |
| AAPL | Apple Inc. | Computers | $271.01 | 260s - 270s | 380 | 224 | 5 for 5'er, top 20% of COMP sector matrix, LT pos mkt RS, buy on pullback, Earn. 1/29 |
| RL | Ralph Lauren | Textiles/Apparel | $362.53 | 352 - 380s | 472 | 296 | 5 TA rating, LT RS buy, consec buy signals, buy-on-pullback |
| HEI | Heico Corporation | Aerospace Airline | $329.31 | 310s - 320s | 424 | 264 | 5 for 5'er, LT pos mkt RS, spread quad top, pos trend change |
| CBRE | CBRE Group, Inc. | Real Estate | $160.19 | hi 150s - lo 170s | 188 | 134 | 5 TA rating, top 10% of REAL sector matrix, LT RS buy, consec buy signals |
| MAR | Marriott International, Inc. | Leisure | $313.41 | 290s - low 310s | 400 | 252 | 5 for 5'er, top half of LEIS sector matrix, LT pos mkt RS, multiple buy signals |
| Symbol | Company | Sector | Current Price | Action Price | Target | Stop | Notes |
|---|
| Symbol | Company | Sector | Current Price | Action Price | Target | Stop | Notes |
|---|---|---|---|---|---|---|---|
| CINF | Cincinnati Financial Corporation | Insurance | $161.49 | mid 150s - hi 160s | 206 | 134 | CINF has fallen to a sell signal. OK to hold here. Raise stop to $142. |
| BPOP | Popular, Inc. | Banks | $125.96 | 120s | 154 | 108 | BPOP has moved into heavily overbought territory. OK to hold here. Maintain $108 stop. Earn. 1/27 |
| Comment | |||||||
|---|---|---|---|---|---|---|---|
|
|
|||||||
MAR Marriott International, Inc. R ($311.90) - Leisure - MAR is a 5 for 5'er that ranks in the top half of the leisure sector matrix and has been on a market RS buy signal since 2020. On its default chart the stock has completed five consecutive buy signals, most recently breaking a double top at $312 late last month. Long exposure may be added in the $290s to low $310s and we will set our initial stop at $252, a potential spread quadruple bottom break on MAR's default chart. We will use the bullish price objective, $400, as our target price.
| 25 | |||||||||||||||||||||||||||||
| 316.00 | X | 316.00 | |||||||||||||||||||||||||||
| 312.00 | X | 312.00 | |||||||||||||||||||||||||||
| 308.00 | • | C | X | 308.00 | |||||||||||||||||||||||||
| 304.00 | X | • | X | O | X | 304.00 | |||||||||||||||||||||||
| 300.00 | X | O | • | X | O | X | 300.00 | ||||||||||||||||||||||
| 296.00 | 2 | O | • | X | O | X | 296.00 | ||||||||||||||||||||||
| 292.00 | X | O | • | X | O | X | Mid | 292.00 | |||||||||||||||||||||
| 288.00 | O | X | O | • | X | O | X | 288.00 | |||||||||||||||||||||
| 284.00 | O | X | O | X | • | X | O | 284.00 | |||||||||||||||||||||
| 280.00 | O | X | O | X | O | • | X | X | 280.00 | ||||||||||||||||||||
| 276.00 | 1 | X | O | X | O | • | X | 7 | O | X | X | 276.00 | |||||||||||||||||
| 272.00 | O | O | 3 | • | X | O | X | O | X | A | X | O | B | 272.00 | |||||||||||||||
| 268.00 | O | X | O | 6 | X | O | X | O | X | O | X | O | X | • | 268.00 | ||||||||||||||
| 264.00 | O | X | O | X | O | X | O | X | O | X | O | X | O | X | • | 264.00 | |||||||||||||
| 260.00 | O | X | O | X | O | X | 8 | X | 9 | O | O | • | 260.00 | ||||||||||||||||
| 256.00 | O | X | O | O | O | • | • | Bot | 256.00 | ||||||||||||||||||||
| 252.00 | O | X | • | 252.00 | |||||||||||||||||||||||||
| 248.00 | O | X | X | • | 248.00 | ||||||||||||||||||||||||
| 244.00 | O | X | O | 4 | 5 | • | 244.00 | ||||||||||||||||||||||
| 240.00 | O | X | O | X | O | X | • | 240.00 | |||||||||||||||||||||
| 236.00 | O | X | O | X | O | X | • | 236.00 | |||||||||||||||||||||
| 232.00 | O | O | • | O | X | X | • | 232.00 | |||||||||||||||||||||
| 228.00 | • | • | O | X | O | X | • | 228.00 | |||||||||||||||||||||
| 224.00 | • | O | X | O | X | • | 224.00 | ||||||||||||||||||||||
| 220.00 | • | O | X | O | X | • | 220.00 | ||||||||||||||||||||||
| 216.00 | • | O | X | O | • | 216.00 | |||||||||||||||||||||||
| 212.00 | • | O | X | • | 212.00 | ||||||||||||||||||||||||
| 208.00 | • | O | • | 208.00 | |||||||||||||||||||||||||
| 25 |
| AMAT Applied Materials, Inc. ($283.66) - Semiconductors - AMAT rose Monday to break a double top at $280 before climbing over 5% intraday to notch a new all-time high at $284. This 5 for 5'er moved to a positive trend in September and has been on an RS buy signal against the market since 2023. The weight of the technical evidence is favorable and improving. However, AMAT is nearing overbought territory. Initial support is seen at $248. |
| AU AngloGold Ashanti Limited (South Africa) ADR ($88.47) - Precious Metals - AU returned to a buy signal Monday when it broke a double top at $88 amid a rally in precious metals producers. Monday's move adds to an already positive technical picture as AU is a 5 for 5'er that ranks in the top third of the favored precious metals sector matrix. From here, AU faces overhead resistance at $91, the all-time high it reached last month. |
| CVX Chevron Corporation ($163.87) - Oil - CVX returned to a buy signal and a positive trend Monday amid a broad rally in the oil stocks driven by the US incursion in Venezuela. CVX broke a double top at $160 and continued higher breaking a spread triple top at $162. The positive trend change will promote the stock to an acceptable 3 for 5'er. From here, overhead resistance sits at $168, while support can now be found at $148. Earnings are expected on 1/30. |
| GD General Dynamics Corporation ($355.56) - Aerospace Airline - GD opened up 2026 with a P&F buy signal at $356, reconfirming a strong technical picture as the aerospace name now sits just one box away from all time highs at $360. Those looking for focused exposure are fine to take the break as an action point. Support is now offered just below current levels between $328 & $336. |
| GILD Gilead Sciences, Inc. ($118.27) - Biomedics/Genetics - GILD inched lower to complete a double bottom break at $118. The 3 for 5'er shifted down from a 4 with its latest moving after reversing back into a negative trend. Additionally, GILD ranks near the bottom of Biomedics/Genetics sector matrix. The stock is still rated a hold, but continue to monitor for any further technical deterioration. Strong resistance can be seen $126-$128. |
| HAS Hasbro, Inc. ($86.03) - Leisure - HAS broke a double top at $86 for a fourth buy signal and a new 52-week high. The stock has been a 5 for 5'er since late November 2025 and ranks within the top half of the Leisure sector matrix while being accompanied by a yield north of 3%. Okay to consider here on the breakout or on a pullback to the lower $80s. Initial support lies at $80, while additional can be found at $75 and $71. |
| PEP PepsiCo, Inc. ($140.02) - Food Beverages/Soap - Shares of PEP broke a double bottom at $142 to move back to a sell signal, in addition to moving to a negative trend. As a result, PEP is back to being an unacceptable 0 for 5’er given its long-term relative weakness. From here, support lies at $140, $138, $128. |
| RDDT Reddit, Inc. Class A ($245.40) - Internet - RDDT pushed higher Monday to break a double top at $248, marking a fifth consecutive buy signal. This stock has a 4 out of 5 TA rating and sits in the top third of the internet sector RS matrix. The weight of the technical evidence is favorable and improving. Exposure can be considered on this breakout. Initial support can be seen at $224 with further support seen at $216. |
| TCTZF Tencent Holdings Limited ($81.02) - Internet - TCTZF pushed higher Monday to break a double top at $81, moving the stock back to a positive trend. This promotes the stock to the maximum 5 TA rating. It has shown positive relative strength against the market since last February, adding to the favorable long-term technical picture. Weekly momentum recently flipped positive as well, suggesting the potential for further upside from here. The technical picture is favorable and improving again. Note that there is overhead resistance at the current position, with further resistance seen at $83 and $86. Initial support is seen at $75. |
| TMO Thermo Fisher Scientific Inc. ($608.56) - Healthcare - TMO inched higher to break a double top at $608, marking its fifth consecutive buy signal. The 4 for 5'er ranks in the top quartile of the healthcare sector matrix. Long exposure can be made here. Initial strong support is seen between $552-$560, with additional support at $520. |
| VLO Valero Energy Corp ($181.40) - Oil Service - VLO was up more than 9% Monday amid a broad rally in oil and oil service stocks. VLO returned to a buy signal when it broke a double top at $180 and continued higher to $184, where it now sits against resistance. Monday's move adds to an already positive technical picture as VLO is a 4 for 5'er and ranks in the top half of the oil service sector matrix. |
| VTR Ventas, Inc. ($77.06) - Real Estate - Shares of VTR broke a double bottom at $76, moving back to a sell signal. However, the 5 for 5’er remains in a positive trend while holding relative strength versus the market and its peers, making it a stock to continue owning for the time being. From here, initial support lies at $67 |
| WELL Welltower Inc. ($186.04) - Real Estate - Shares of WELL broke a double bottom at $182, ending its streak of six consecutive sell buy signals. However, the stock remains a strong buy as a 5 for 5’er. The first sell signal after an extended streak of buys is often just a head fake. Additionally, the stock is slightly oversold with an OBOS reading of -30%. From here, initial support lies at $176 and $164 to $162. |
| WLK Westlake Corp. ($74.98) - Chemicals - WLK returned to a positive trend Monday when it broke a double top at $77. The outlook for the stock remains negative, however, as even with the positive trend change WLK is an unfavorable 2 for 5'er. From here, the next level of overhead resistance sits at $80, meanwhile, support can now be found at $72. |

| Name | Option Symbol | Action | Stop Loss |
|---|---|---|---|
| CME Group, Inc. - $274.83 | O: 26C270.00D20 | Buy the March 270.00 calls at 12.30 | 256.00 |
| Name | Option | Action |
|---|---|---|
| Bank of America ( BAC) | Jan. 52.50 Calls | Raise the option stop loss to 2.70 (CP: 4.70) |
| Bank of America ( BAC) | Mar. 52.50 Calls | Raise the option stop loss to 3.65 (CP: 5.65) |
| Caterpillar, Inc. ( CAT) | Mar. 580.00 Calls | Raise the option stop loss to 60.10 (CP: 62.10) |
| Morgan Stanley ( MS) | Mar. 180.00 Calls | Raise the option stop loss to 11.50 (CP: 13.50) |
| eBay Inc. ( EBAY) | Mar. 85.00 Calls | Raise the option stop loss to 6.60 (CP: 8.60) |
| J.P. Morgan Chase & Co. ( JPM) | Apr. 325.00 Calls | Initiate an option stop loss of 21.35 (CP: 23.35) |
| Name | Option Symbol | Action | Stop Loss |
|---|---|---|---|
| Alibaba Group Holding Ltd (China) ADR - $156.27 | O: 26P155.00D17 | Buy the April 155.00 puts at 12.15 | 168.00 |
| Name | Option | Action |
|---|---|---|
| The Campbell's Company ( CPB) | Jan. 32.00 Puts | Raise the option stop loss to 3.00 (CP: 5.00) |
| DocuSign, Inc. ( DOCU) | Mar. 70.00 Puts | Raise the option stop loss to 5.60 (CP: 7.60) |
| The Boeing Company ( BA) | Feb. 210.00 Puts | Stopped at 228.00 (CP: 228.21) |
| Name | Option Sym. | Call to Sell | Call Price | Investment for 500 Shares | Annual Called Rtn. | Annual Static Rtn. | Downside Protection |
|---|---|---|---|---|---|---|---|
| Carnival Corporation $ 30.92 | O: 26C32.00D20 | Mar. 32.00 | 2.00 | $ 14,998.30 | 27.74% | 27.34% | 5.25% |
| Name | Action |
|---|---|
| Amphenol Corporation ( APH) - 139.71 | Sell the March 140.00 Calls. |
| Lemonade Inc ( LMND) - 75.96 | Sell the February 80.00 Calls. |
| Intel Corporation ( INTC) - 39.38 | Sell the February 37.00 Calls. |
| Estee Lauder Companies ( EL) - 106.76 | Sell the March 110.00 Calls. |
| Las Vegas Sands Corp. ( LVS) - 65.21 | Sell the March 65.00 Calls. |
| Figure Technology Solutions, Inc. Class A ( FIGR) - 43.74 | Sell the February 45.00 Calls. |
| Barrick Mining Corporation ( B) - 44.08 | Sell the March 44.00 Calls. |
| Name | Covered Write |
|---|---|
|
|
|
Daily Equity & Market Analysis
NDW MORNING UPDATE
Jan 07, 2026
Loading, Please Wait...
