Most Requested Symbols

The real estate sector is showing signs of life for the first time in a long time.
The curve has an average reading of 21.10%.
Today's featured stock is Meta Platform Inc. (META).
Comments include: ALB, AMZN, ASH, BIDU, CAKE, CBT, CRM, CVX, DKNG, DKS, ETN, HAL, HD, JBL, LYV, MATX, MUR, NCLH, NE, OXY, RS, SAIA, SPT, STLD, TGT, and TRGP.
Call: JP Morgan Chase & Co (JPM); Put: Verizon Communications (VZN); Covered Write: Ally Financial (ALLY).
NDW Morning Update Video - August 5, 2024
NDW Morning Update Video – August 5, 2024.
Click here to download MP3
No matter how long you’ve been in the business, no matter how many corrections or pullbacks you have seen, days like today are always a bit spooky. The hot unemployment numbers from today (8/2) gave investors a concern that the odds of a soft landing might not be as high as markets had hoped for. The VIX, or “fear gauge” as some call it, spiked over 50% intraday as investors geared up for further uncertainty. Small caps, which were previously lifted higher on the idea of September rate cut found themselves getting hammered with intraday action. This, of course, comes at a time when markets were looking for any reason to pile onto the small cap train as market breadth was improving as we opened August. But the point of today’s piece isn’t to talk about small caps… let’s let the dust settle there before any calls are truly made. The main focus for the WYA is simple: To help cut through the noise as clients see red in their portfolios.
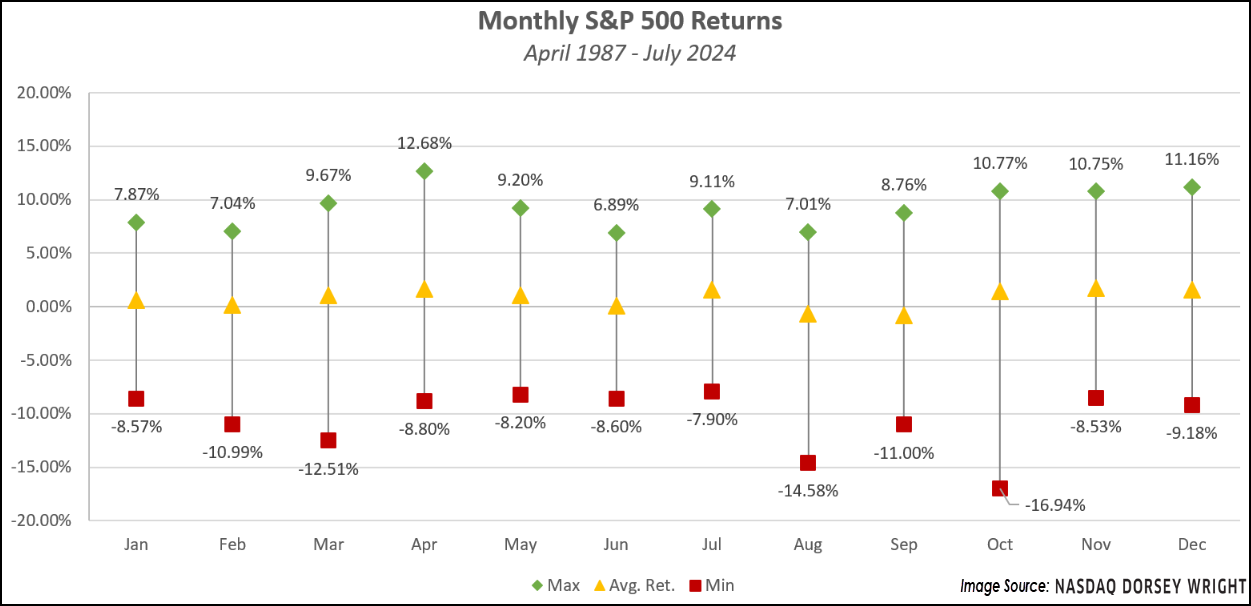
To start, let's take a look at what the month of August brings markets. The chart below walks through average market returns for each calendar month. We have touched on weakness during the summer months, with August bringing in below-average returns historically. Dating back to 1987, SPX has posted an average return of -0.67%, only beating next month- September historically. Minimum/Maximum monthly readings are also less attractive than the “normal” months. All this to say- remember we are in a seasonally weak part of the year. While the magnitude of August's pullback so far has been intense- if there was a time of year for it to be more “normal”, now would be the time for it.
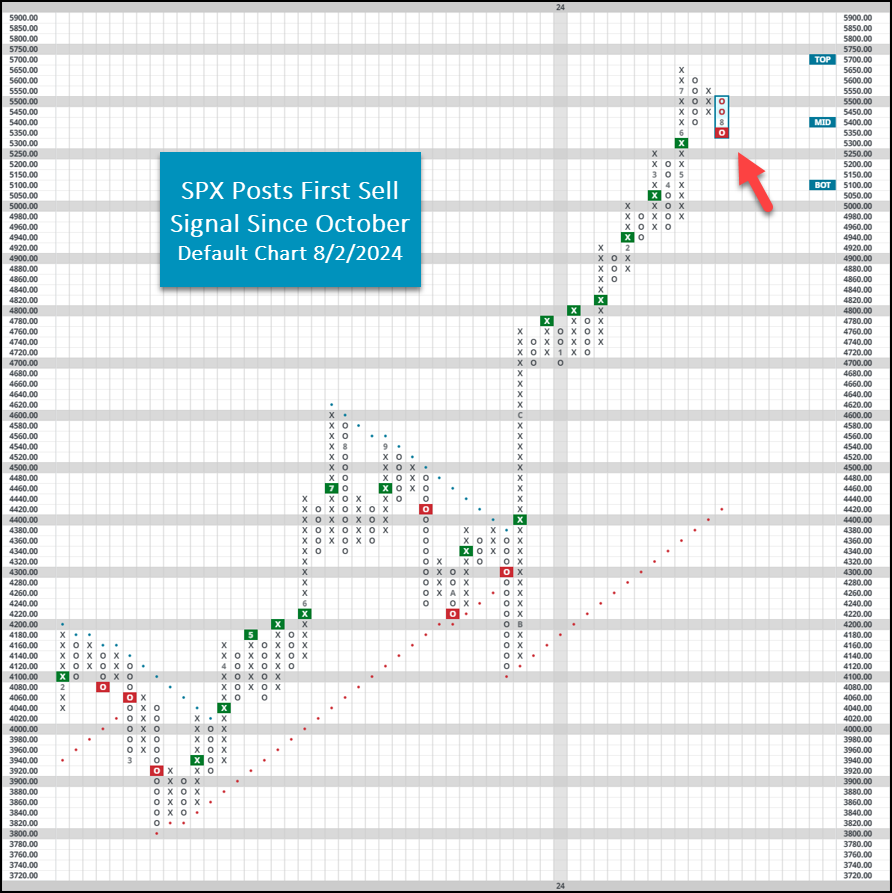
With intraday action, SPX will also post its first sell signal since October of 2023 on its default chart. It may seem like common knowledge- but markets can’t go up every day. Pullbacks are normal, exhales are normal, and yes, even “sell” signals are normal from time to time. Now, those aren’t excuses to fall asleep at the wheel… but simply a reminder that swift exhales within an overall strong market uptrend are nothing to pull the emergency exit over. To close, we will offer a few things the analyst team has their eye on as volatility does pick up:
- 1 sell signal is “normal”, but a series of lower tops and sell signals could be more concerning for broad markets. Watch SPX around old resistance at 5,250.
- Small caps and the longevity of their rally. If the space falls, market breadth should narrow, a net negative.
- The strength of the “core.” Perhaps zooming out of solely technicals, if the economy is unable to achieve a soft landing, what areas emerge as relative strength leaders?
As clients call in and question where their portfolios are positioned, remember that part of the job is helping calm panic as markets ebb and flow. While there are elements of the markets that are definitely eye-catching (and could be concerning if we see further downside action…) domestic equities remain in control. Make sure to use the alerts manager to keep track of notable charts easily.

As discussed over the past few weeks, market breadth has materially improved, and the real estate sector is showing signs of life for the first time in a long time. I searched our archives to find the last report where the sector was discussed positively but came up empty handed. Three reports that did turn up are linked below:
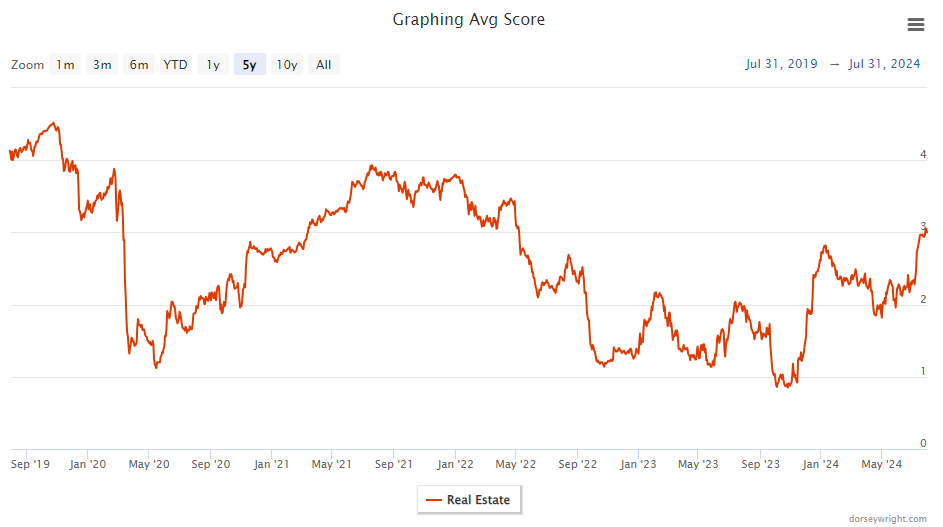
There were plenty of rallies in the last two years, but none had the magnitude or endurance to pull the sector out of the basement rankings on our macro indicators. To that point, real estate funds have consistently carried one of the lowest average scores on our Asset Class Group Scores Page. However, the tide may now be changing. Earlier this week the real estate group score breached 3.0 which is a significant milestone and threshold for technical health. Granted, most other sectors still have higher scores; nonetheless, this is a big step in the right direction. The last time real estate moved into the 3.0 score zone was March 2021.
Note: This is a technicality, but important - the real estate group was most recently above the 3.0 score in May 2022, but it was on a downward trend, not an entrance/uptrend like we see today.
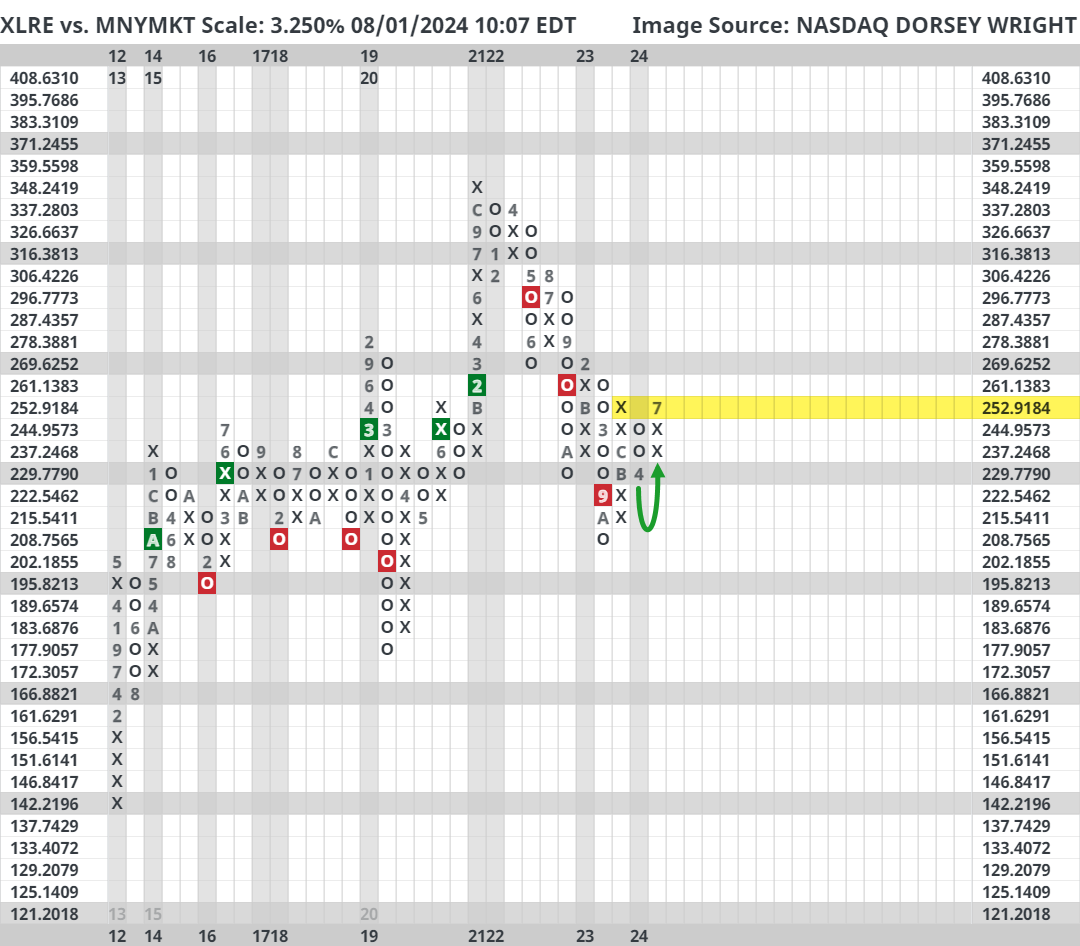
Earlier this week we also saw the Real Estate Select Sector SPDR Fund (XLRE) move into a column of Xs against our cash proxy (MNYMKT) on a 3.25% relative strength chart. In common speak, this means that real estate has recently outperformed cash by about 10% (3.25% box size x 3 box reversal = 9.75%). Remember that our cash proxy, MNYMKT, is the 13 Week Treasury Bill which has been no slouch as of late with short-term yields hovering around 5%.
Interestingly, XLRE is now the closest to giving a relative strength buy signal in over two years - roughly 3.25% further outperformance will do the trick. The last time XLRE printed a relative strength buy signal against cash was February 2021, but the last time XLRE returned to a relative strength buy signal was June 2020. Admittedly, the signal history on the chart below was inconsistent prior to 2020, but since then the chart has trended nicely (signals leading to further signals of the same kind).
What changed? In short, interest rates, and more specifically, the expectations for interest rates. The relationship of interest rates and real estate is summarized well by S&P Global, “All else being equal, higher interest rates tend to decrease the value of properties and increase REIT borrowing costs. In addition, higher interest rates make the relatively high dividend yields generated by REITs less attractive when compared with lower-risk, fixed-income securities, which reduces their appeal to income-seeking investors.” So, with the market looking for a cut in September and an accommodative monetary policy thereafter, perhaps real estate has some breathing room.
Another factor likely being weighed is the soft-landing probability. The real estate sector is not a traditionally defensive play, unlike utilities and consumer staples, which means that investors would likely not hang around if rates are crashing in the face of an economy falling apart. The jury is still out on this topic, and likely will be for a while, but it is still worth acknowledging.
For those with a strategic mandate to have real estate exposure, or those wanting a more opportunistic/tactical approach, we have emphasized for years that only focused exposure was justifiable. In other words, very few (if any) broad real estate funds were demonstrating healthy technical behavior, forcing investors to take a more tailored and/or individual stock approach. While that is largely still true today, we have seen some broad funds pop on the radar.
The XLRE trend chart has improved materially. With a fund score comfortably north of 3.0 and December 2023 resistance in the rearview mirror, the technical picture has brightened. Further bullish confirmation would come with a push past the February 2023 highs at $42. RSPR, the Invesco S&P 500 Equal Weight Real Estate ETF (RSPR), is another example with a fund score now above 3.0. It would be ideal to see RSPR clear its February 2023 highs; regardless, it is a good sign to see the largest (XLRE) and average (RSPR) real estate stocks putting up good performance.

| Symbol | Name | Price | Yield | PnF Trend | RS Signal | RS Col. | Fund Score | 200 Day MA | Weekly Mom |
|---|---|---|---|---|---|---|---|---|---|
| DIA | SPDR Dow Jones Industrial Average ETF Trust | 403.23 | 1.66 | Positive | Sell | X | 4.09 | 379.25 | + 5W |
| EEM | iShares MSCI Emerging Markets ETF | 42.20 | 2.41 | Positive | Sell | X | 3.43 | 40.59 | - 2W |
| EFA | iShares MSCI EAFE ETF | 78.23 | 2.89 | Positive | Sell | X | 3.43 | 76.30 | + 3W |
| FM | iShares Frontier and Select EM ETF | 27.69 | 4.12 | Positive | Sell | O | 2.41 | 27.11 | + 3W |
| IJH | iShares S&P MidCap 400 Index Fund | 60.60 | 1.28 | Positive | Buy | O | 4.30 | 56.20 | + 4W |
| IJR | iShares S&P SmallCap 600 Index Fund | 115.02 | 1.23 | Positive | Sell | O | 3.43 | 104.75 | + 4W |
| QQQ | Invesco QQQ Trust | 459.66 | 0.61 | Positive | Buy | O | 4.55 | 429.16 | - 3W |
| RSP | Invesco S&P 500 Equal Weight ETF | 169.69 | 1.51 | Positive | Sell | O | 3.06 | 158.82 | + 4W |
| SPY | SPDR S&P 500 ETF Trust | 543.01 | 1.24 | Positive | Buy | X | 5.20 | 498.99 | - 3W |
| XLG | Invesco S&P 500 Top 50 ETF | 44.83 | 0.79 | Positive | Buy | X | 5.62 | 40.63 | - 3W |

QQQ continued its pullback as it gave its first sell signal in 2024 and tests support at the $445 level. Despite its recent fall, QQQ still holds a more than respectable 4.55 fund score. The fund was previously in extended territory, and the abrupt pullback during Friday's trading leaves the fund slightly in oversold territory
That said, the fund has lost some relative strength versus other names, underperforming RSP by over 10% in the last four weeks. QQQ reversed back into a column of O's against RSP on a 3.25% relative strength chart during last week's trading, showing near-term weakness against the equal-weighted S&P 500, but would need significant further underperformance to hit a sell signal. QQQ still holds a better long-term picture, but keep an eye out for further deterioration as a sign of continued tech-focused weakness.
The majority of the funds within the table above moved lower this week. EFA, QQQ, and XLG returned to sell signals on their default charts, signaling some weakness on the international front and within the large cap core. Small caps have also been in focus, seeing IJR reverse to old resistance from earlier this year. As market volatility picks up, continue to monitor these areas of the market with a watchful eye.

Average Level
21.10
| < - -100 | -100 - -80 | -80 - -60 | -60 - -40 | -40 - -20 | -20 - 0 | 0 - 20 | 20 - 40 | 40 - 60 | 60 - 80 | 80 - 100 | 100 - > |
|---|---|---|---|---|---|---|---|---|---|---|---|
|
Buy signaldia
|
|||||||||||
|
Buy signalrsp
|
|||||||||||
|
Buy signalgld
|
|||||||||||
|
Buy signalQQQ
|
Buy signaliwm
|
||||||||||
|
Buy signalefa
|
Buy signaldx/y
|
Buy signaltlt
|
|||||||||
|
Buy signalONEQ
|
Buy signalUSO
|
Buy signalVOOV
|
|||||||||
|
Buy signalVOOG
|
Sell signalfxe
|
Buy signalIJH
|
Buy signallqd
|
Buy signaldvy
|
Buy signalief
|
||||||
|
Buy signalgsg
|
Sell signalgcc
|
Buy signaleem
|
Buy signalXLG
|
Buy signalSPY
|
Buy signalhyg
|
Buy signalijr
|
Buy signalagg
|
Buy signalshy
|
Buy signalicf
|
||
| < - -100 | -100 - -80 | -80 - -60 | -60 - -40 | -40 - -20 | -20 - 0 | 0 - 20 | 20 - 40 | 40 - 60 | 60 - 80 | 80 - 100 | 100 - > |
| AGG | iShares US Core Bond ETF |
| USO | United States Oil Fund |
| DIA | SPDR Dow Jones Industrial Average ETF |
| DVY | iShares Dow Jones Select Dividend Index ETF |
| DX/Y | NYCE U.S.Dollar Index Spot |
| EFA | iShares MSCI EAFE ETF |
| FXE | Invesco CurrencyShares Euro Trust |
| GLD | SPDR Gold Trust |
| GSG | iShares S&P GSCI Commodity-Indexed Trust |
| HYG | iShares iBoxx $ High Yield Corporate Bond ETF |
| ICF | iShares Cohen & Steers Realty ETF |
| IEF | iShares Barclays 7-10 Yr. Tres. Bond ETF |
| LQD | iShares iBoxx $ Investment Grade Corp. Bond ETF |
| IJH | iShares S&P 400 MidCap Index Fund |
| ONEQ | Fidelity Nasdaq Composite Index Track |
| QQQ | Invesco QQQ Trust |
| RSP | Invesco S&P 500 Equal Weight ETF |
| IWM | iShares Russell 2000 Index ETF |
| SHY | iShares Barclays 1-3 Year Tres. Bond ETF |
| IJR | iShares S&P 600 SmallCap Index Fund |
| SPY | SPDR S&P 500 Index ETF Trust |
| TLT | iShares Barclays 20+ Year Treasury Bond ETF |
| GCC | WisdomTree Continuous Commodity Index Fund |
| VOOG | Vanguard S&P 500 Growth ETF |
| VOOV | Vanguard S&P 500 Value ETF |
| EEM | iShares MSCI Emerging Markets ETF |
| XLG | Invesco S&P 500 Top 50 ETF |
| Symbol | Company | Sector | Current Price | Action Price | Target | Stop | Notes |
|---|---|---|---|---|---|---|---|
| CCEP | Coca-Cola Europacific Partners PLC | Food Beverages/Soap | $74.15 | 60s | 97 | 56 | 5 for 5'er, top 25% of FOOD sector matrix, spread quad top, R-R~3.0, 3% yield |
| GTES | Gates Industrial Corporation plc | Business Products | $17.74 | 16-18 | 23.50 | 15 | 5 TA rating, top 25% of BUSI sector matrix, LT RS buy, shakeout pattern buy point, R-R > 3 |
| KR | The Kroger Co. | Retailing | $55.09 | lo - hi 50s | 89 | 42 | 4 TA rating, top half RETA sector matrix, cosnec. buy signals, LT RS buy, R-R > 2 |
| BRK.B | Berkshire Hathaway Inc | Wall Street | $431.81 | low 400s - mid 430s | 556 | 392 | 5 for 5'er, top half of WALL sector matrix, LT pos mkt RS, triple top breakout, R-R>2.5 |
| GEO | The Geo Group Inc. | Real Estate | $13.77 | 14-17 | 34.50 | 12.50 | 5 TA rating, top 10% of REAL sector matrix, buy-on-pullback, R-R > 4, Earn. 8/7 |
| FLS | Flowserve Corporation | Machinery and Tools | $48.95 | hi 40s - lo 50s | 79 | 38 | 5 TA rating, top 25% of MACH sector matrix, LT RS buy, buy-on-pullback, R-R > 2 |
| MSFT | Microsoft Corporation | Software | $417.12 | 410s - 430s | 480 | 360 | 5 for 5'er, top third of SOFT sector matrix, LT pos mkt RS, buy on pullback |
| LEN | Lennar Corporation | Building | $176.24 | 168 - lo 180s | 246 | 140 | 4 TA rating, top half BUIL sector matrix, LT RS buy, buy-on-pullback, R-R > 2 |
| META | Meta Platform Inc. | Internet | $497.87 | 460s - 490s | 672 | 408 | 5 for 5'er, top half of INET sector matrix, buy on pullback, R-R>2.0 |
| Symbol | Company | Sector | Current Price | Action Price | Target | Stop | Notes |
|---|
| Symbol | Company | Sector | Current Price | Action Price | Target | Stop | Notes |
|---|---|---|---|---|---|---|---|
| CRH | CRH plc (Ireland) ADR | Building | $81.84 | mid 70s - low 80s | 103 | 65 | CRH fell to a sell signal on Friday. OK to hold here. Raise stop to $71. Earn. 8/8 |
| EFX | Equifax Inc. | Business Products | $282.10 | 240s - 260s | 360 | 224 | EFX has moved into heavily overbought territory. OK to hold here. Raise stop to $232. |
| COF | Capital One Financial Corporation | Finance | $143.89 | lo 140s - mid 150s | 190 | 122 | COF fell to a sell signal Friday. OK to hold here. Maintain $122 stop. |
| ITGR | Integer Holdings Corp. | Healthcare | $116.16 | mid 110s - low 120s | 164 | 94 | INTGR fell to a sell signal on Friday. OK hold here. Maintain $94 stop. |
| GE | GE Aerospace | Aerospace Airline | $169.75 | 160s - 170s | 214 | 146 | GE fell to a sell signal on Friday. OK to hold here. Maintain $146 stop. |
| Comment | |||||||
|---|---|---|---|---|---|---|---|
|
|
|||||||
META Meta Platform Inc. R ($489.64) - Internet - META is a 5 for 5'er that ranks in the top half of the internet sector matrix. After giving two consecutive sell signals, META returned to a buy signal earlier this week with a double top break at $496. In Friday's trading, the stock pulled back below the middle of its trading band, offering an entry point for long exposure. Positions may be added in the $460s - $490s and we will set our initial stop at $408, which would take out two levels of support on META's default chart. We will use the bullish price objective, $672, as our target price, giving us a reward-to-risk ratio north of 2.0.
| 24 | ||||||||||||||||||||||||||||||||||||||||||||||||||||
| 536.00 | X | 536.00 | ||||||||||||||||||||||||||||||||||||||||||||||||||
| 528.00 | X | X | O | 528.00 | ||||||||||||||||||||||||||||||||||||||||||||||||
| 520.00 | X | X | O | X | X | O | X | 520.00 | ||||||||||||||||||||||||||||||||||||||||||||
| 512.00 | X | O | X | 4 | O | X | X | O | X | O | X | 512.00 | ||||||||||||||||||||||||||||||||||||||||
| 504.00 | X | O | X | O | X | O | X | O | X | X | O | X | O | X | 504.00 | |||||||||||||||||||||||||||||||||||||
| 496.00 | 3 | O | X | O | X | O | X | O | X | O | X | 7 | O | X | 496.00 | |||||||||||||||||||||||||||||||||||||
| 488.00 | X | X | O | X | O | O | O | X | O | X | O | X | X | Mid | 488.00 | |||||||||||||||||||||||||||||||||||||
| 480.00 | X | X | O | X | O | O | O | X | 6 | O | X | O | 8 | 480.00 | ||||||||||||||||||||||||||||||||||||||
| 472.00 | X | O | X | O | X | O | X | O | X | O | X | O | X | 472.00 | ||||||||||||||||||||||||||||||||||||||
| 464.00 | X | O | X | O | O | X | O | X | O | O | X | 464.00 | ||||||||||||||||||||||||||||||||||||||||
| 456.00 | X | O | O | X | O | O | X | 456.00 | ||||||||||||||||||||||||||||||||||||||||||||
| 448.00 | X | O | 5 | O | 448.00 | |||||||||||||||||||||||||||||||||||||||||||||||
| 440.00 | X | O | X | 440.00 | ||||||||||||||||||||||||||||||||||||||||||||||||
| 432.00 | X | O | X | 432.00 | ||||||||||||||||||||||||||||||||||||||||||||||||
| 424.00 | X | O | X | 424.00 | ||||||||||||||||||||||||||||||||||||||||||||||||
| 416.00 | X | O | 416.00 | |||||||||||||||||||||||||||||||||||||||||||||||||
| 408.00 | X | Bot | 408.00 | |||||||||||||||||||||||||||||||||||||||||||||||||
| 400.00 | X | 2 | 400.00 | |||||||||||||||||||||||||||||||||||||||||||||||||
| 396.00 | X | O | X | 396.00 | ||||||||||||||||||||||||||||||||||||||||||||||||
| 392.00 | X | O | X | 392.00 | ||||||||||||||||||||||||||||||||||||||||||||||||
| 388.00 | X | O | 388.00 | |||||||||||||||||||||||||||||||||||||||||||||||||
| 384.00 | X | 384.00 | ||||||||||||||||||||||||||||||||||||||||||||||||||
| 380.00 | X | 380.00 | ||||||||||||||||||||||||||||||||||||||||||||||||||
| 376.00 | X | X | 376.00 | |||||||||||||||||||||||||||||||||||||||||||||||||
| 372.00 | X | O | X | 372.00 | ||||||||||||||||||||||||||||||||||||||||||||||||
| 368.00 | X | O | X | 368.00 | ||||||||||||||||||||||||||||||||||||||||||||||||
| 364.00 | X | O | X | 364.00 | ||||||||||||||||||||||||||||||||||||||||||||||||
| 360.00 | X | X | O | 360.00 | ||||||||||||||||||||||||||||||||||||||||||||||||
| 356.00 | X | O | X | 356.00 | ||||||||||||||||||||||||||||||||||||||||||||||||
| 352.00 | X | O | X | 352.00 | ||||||||||||||||||||||||||||||||||||||||||||||||
| 348.00 | X | 1 | X | 348.00 | ||||||||||||||||||||||||||||||||||||||||||||||||
| 344.00 | X | O | 344.00 | |||||||||||||||||||||||||||||||||||||||||||||||||
| 340.00 | X | X | 340.00 | |||||||||||||||||||||||||||||||||||||||||||||||||
| 336.00 | X | O | X | 336.00 | ||||||||||||||||||||||||||||||||||||||||||||||||
| 332.00 | X | O | X | X | 332.00 | |||||||||||||||||||||||||||||||||||||||||||||||
| 328.00 | X | X | O | X | O | X | 328.00 | |||||||||||||||||||||||||||||||||||||||||||||
| 324.00 | X | X | O | X | O | X | O | X | 324.00 | |||||||||||||||||||||||||||||||||||||||||||
| 320.00 | X | O | X | O | X | C | X | O | 320.00 | |||||||||||||||||||||||||||||||||||||||||||
| 316.00 | X | X | O | X | O | X | O | 316.00 | ||||||||||||||||||||||||||||||||||||||||||||
| 312.00 | X | O | X | 8 | X | A | O | B | 312.00 | |||||||||||||||||||||||||||||||||||||||||||
| 308.00 | X | O | X | O | X | O | X | O | X | 308.00 | ||||||||||||||||||||||||||||||||||||||||||
| 304.00 | X | O | X | O | 9 | O | X | O | X | 304.00 | ||||||||||||||||||||||||||||||||||||||||||
| 300.00 | X | O | X | O | X | O | X | O | X | 300.00 | ||||||||||||||||||||||||||||||||||||||||||
| 296.00 | X | O | X | O | X | X | O | X | O | X | 296.00 | |||||||||||||||||||||||||||||||||||||||||
| 292.00 | 7 | O | O | X | O | X | O | X | O | X | 292.00 | |||||||||||||||||||||||||||||||||||||||||
| 288.00 | X | O | X | O | X | O | O | X | 288.00 | |||||||||||||||||||||||||||||||||||||||||||
| 284.00 | X | O | X | O | X | O | X | 284.00 | ||||||||||||||||||||||||||||||||||||||||||||
| 280.00 | X | O | X | O | O | 280.00 | ||||||||||||||||||||||||||||||||||||||||||||||
| 276.00 | X | X | O | 276.00 | ||||||||||||||||||||||||||||||||||||||||||||||||
| 272.00 | 6 | O | X | 272.00 | ||||||||||||||||||||||||||||||||||||||||||||||||
| 268.00 | X | O | X | 268.00 | ||||||||||||||||||||||||||||||||||||||||||||||||
| 264.00 | X | O | X | 264.00 | ||||||||||||||||||||||||||||||||||||||||||||||||
| 260.00 | X | O | 260.00 | |||||||||||||||||||||||||||||||||||||||||||||||||
| 256.00 | X | 256.00 | ||||||||||||||||||||||||||||||||||||||||||||||||||
| 252.00 | X | 252.00 | ||||||||||||||||||||||||||||||||||||||||||||||||||
| 248.00 | X | 248.00 | ||||||||||||||||||||||||||||||||||||||||||||||||||
| 244.00 | 5 | X | 244.00 | |||||||||||||||||||||||||||||||||||||||||||||||||
| 240.00 | X | O | X | 240.00 | ||||||||||||||||||||||||||||||||||||||||||||||||
| 236.00 | X | O | X | • | 236.00 | |||||||||||||||||||||||||||||||||||||||||||||||
| 232.00 | X | O | • | 232.00 | ||||||||||||||||||||||||||||||||||||||||||||||||
| 228.00 | X | • | 228.00 | |||||||||||||||||||||||||||||||||||||||||||||||||
| 224.00 | X | • | 224.00 | |||||||||||||||||||||||||||||||||||||||||||||||||
| 220.00 | X | X | • | 220.00 | ||||||||||||||||||||||||||||||||||||||||||||||||
| 216.00 | 4 | O | X | • | 216.00 | |||||||||||||||||||||||||||||||||||||||||||||||
| 212.00 | X | O | X | • | 212.00 | |||||||||||||||||||||||||||||||||||||||||||||||
| 208.00 | X | O | • | 208.00 | ||||||||||||||||||||||||||||||||||||||||||||||||
| 204.00 | X | • | 204.00 | |||||||||||||||||||||||||||||||||||||||||||||||||
| 200.00 | X | • | 200.00 | |||||||||||||||||||||||||||||||||||||||||||||||||
| 198.00 | X | • | 198.00 | |||||||||||||||||||||||||||||||||||||||||||||||||
| 196.00 | X | • | 196.00 | |||||||||||||||||||||||||||||||||||||||||||||||||
| 194.00 | • | 194.00 | ||||||||||||||||||||||||||||||||||||||||||||||||||
| 24 |

| ALB Albemarle Corp ($86.99) - Chemicals - ALB was down more than 6.5% on Friday and fell to a sell signal when it broke a spread quadruple bottom at $90 and continued lower to $83. Friday's move adds confirmation to an already negative technical picture as ALB is a 0 for 5'er and ranks 46th out of 46 names in the chemicals sector matrix. The stock has now taken out all support it has found since 2020. |
| AMZN Amazon.com Inc. ($166.71) - Retailing - Following earnings on 8/1, AMZN reversed into Os and broke a double bottom at $176 to return the stock to a sell signal as it fell to violate multiple support levels on its way down to $162, the lowest chart level since the beginning of February. AMZN now trades just one box above its bullish support line at $160. The stock also appears it will maintain its 5 attribute rating, but note that it now resides within one box of the market RS chart reversing into Os. Beyond the bullish support line, support lies at $150 and $146. |
| ASH Ashland Inc. ($93.56) - Chemicals - ASH fell to a sell signal on Friday when it broke a triple bottom at $94 and now sits against its bullish support line at $93. Friday's sell signal adds to an already unfavorable technical picture as ASH is a 2 for 5'er. A move to $92 would violate ASH's trend line and drop the stock to a 1 for 5'er. |
| BIDU Baidu, Inc. (China) ADR ($84.37) - Internet - BIDU declined Friday to break a double bottom at $86 before falling to $83 intraday. This 0 for 5'er moved to a negative trend in May and sits near the bottom of the internet sector RS matrix. The technical picture is weak and continues to worsen. Initial support is not seen until $79, while overhead resistance is not seen until $104. Note that earnings are expected on 8/22. |
| CAKE The Cheesecake Factory Incorporated ($34.73) - Restaurants - CAKE broke a triple bottom at $36 for the stock's first sell signal in 2024 as it fell to $35. The move will also violate the bullish support line, which will cause the stock to drop to a 2 for 5'er trading in a negative trend. From here, support now lies at $34 and $32 with additional in the upper-$20s. Note that long-term resistance at $41 continues to thwart further upside for the stock. |
| CBT Cabot Corp ($89.91) - Chemicals - CBT fell nearly 7% on Friday and dropped to a sell signal on its default chart when it broke a double bottom at $94. The stock continued lower to $89, where it now sits just above support at $88. The technical picture for CBT remains positive as it is a 5 for 5'er and ranks in the top 10% of the chemicals sector matrix. |
| CRM Salesforce Inc. ($243.97) - Software - CRM moved lower Friday to break a double bottom at $244. This 2 for 5'er moved to a negative trend in May and sits in the bottom half of the software sector RS matrix. CRM had been showing near-term technical improvement in recent weeks, but is now weakening once again. Initial support can be seen at $228 further further support seen at $212. Overhead resistance can be seen at $264. Note that earnings are expected on 8/28. |
| CVX Chevron Corporation ($148.44) - Oil - CVX gave a second consecutive sell signal when it broke a double bottom at $152 on Friday and continued lower to $148, where it now sits against support. The technical picture for CVX was negative prior to Friday's action as the stock is a 1 for 5'er and ranks in the bottom half of the oil sector matrix. |
| DKNG DraftKings Inc Class A ($31.74) - Gaming - DKNG broke a double bottom at $35 to complete a bearish triangle and count as a third sell signal as the stock fell to $31. The move violates the bullish support line, which coupled with the market RS chart reversal into Os last week, will drop the stock to a 2 for 5'er trading in a negative trend. From here, support now lies at $26 and $23. |
| DKS Dick's Sporting Goods, Inc. ($199.11) - Retailing - DKS broke a double bottom at $198 to complete a bearish triangle as the stock fell to $196. This marks the second sell signal for the 5 for 5'er since it peaked at $232 in June. From here, support on the default chart now lies at $184 and $180. |
| ETN Eaton Corporation ($279.15) - Machinery and Tools - Despite the strong attribute rating, ETN leaves much to be desired from a technical perspective. The stock has now put in a series of lower tops off 2024 highs and sits without support until the bullish support line at $260 below. Exercise extreme caution within the name and consider trimming the name if you have gains available. |
| HAL Halliburton Company ($31.82) - Oil Service - HAL gave a second consecutive sell signal and took out notable support on Friday when it broke a spread triple bottom at $32. The move adds evidence to an already weak technical picture as HAL is a 1 for 5'er and ranks in the bottom quintile of the oil service sector matrix. From here, the next level of support on HAL's chart sits at $28. |
| HD Home Depot, Inc. ($352.32) - Building - HD broke a double bottom at $348 to end a series of buy signals that began in June. This move also brings HD down to test the bullish support line, which would be violated with a move to $340. In addition to trading in a positive trend, the only other positive attribute for the stock resides in a very long-term market RS buy signal. Additional support lies at $332 and $324. |
| JBL Jabil Circuit, Inc. ($99.55) - Electronics - JBL fell Friday to break a double bottom at $106 before falling to $97 intraday. This moves the stock to a negative trend and demotes it to a 2 for 5 TA rating. The weight of the technical evidence is weak here and deteriorating. Long exposure should be avoided. Further support may be seen at $89. Overhead resistance may be found initially at $118. |
| LYV Live Nation Entertainment Inc. ($90.93) - Leisure - LYV broke a double bottom at $92 to return the stock to a sell signal as it fell to $90. This move also violated the bullish support line, which will drop the stock to a 3 for 5'er. From here, support lies at $89 and $87, the 2024 chart low. |
| MATX Matson Inc ($132.82) - Transports/Non Air - MATX moved as much as 3.5% higher on the day, posting a 4th consecutive buy signal in the process. While the stock only holds a 3/5 attribute rating, the technical picture is attractive. Those looking to add to the transports space could do so here. |
| MUR Murphy Oil Corp ($37.52) - Oil - MUR fell to a sell signal and a negative trend on Friday when it broke a double bottom at $38. The negative trend change will drop MUR to an unfavorable 2 for 5'er. From here, the next level of support sits at $37. |
| NCLH Norwegian Cruise Line Holdings Ltd. ($15.83) - Leisure - NCLH broke a double bottom at $16 to return to a sell signal and violate the bullish support line. It also continues the stock trading within the $15 to $21, which has been in place for much of 2024. The trendline violation will drop the stock to a 3 for 5'er. From here, initial support lies at $15.50, while long-term support resides in the $12 to $13 range. |
| NE Noble Corporation ($42.07) - Oil Service - NE fell to a sell signal and violated its trend line in Friday's trading, a move which will drop it to an unfavorable 2 for 5'er. NE now sits against major support at $42, a level it has rallied from on three prior occasions since December of last year. |
| OXY Occidental Petroleum Corporation ($57.67) - Oil - OXY fell to a sell signal and violated its trend line on Friday when it broke a double bottom at $58. The trend violation will drop the stock to an unfavorable 2 for 5'er. From here, the next level of support sits at $56, a level from which OXY has rallied four times since March of last year. Earnings are expected on 8/7. |
| RS Reliance Inc. ($287.22) - Steel/Iron - RS fell to a sell signal on Friday when it broke a double bottom at $292 following an unsuccessful test of its bearish resistance line. The stock now sits two boxes above support at $276. The technical outlook for RS remains positive as it is a 4 for 5'er and ranks third out of 14 names in the steel/iron sector matrix; however, the unsuccessful test of its negative trend line is a cause for concern. |
| SAIA Saia, Inc. ($382.90) - Transports/Non Air - SAIA has bounced back down to logical support on its default chart at $372. With that in mind, those looking to trim current exposure to the name should look to do so on reversals back into X's. On the contrary, a breech of this support would be a net negative for the current 2/5'er. Regardless, exposure should be limited when possible. |
| SPT Sprout Social Inc Class A ($32.89) - Software - SPT fell Friday to break a double bottom at $33, ending a streak of three consecutive buy signals. This 2 for 5'er moved to a negative trend in April and sits in the bottom half of the software sector RS matrix. The technical picture is weak and showing further deterioration. Initial support can be seen at $32, while overhead resistance can be seen at $39. |
| STLD Steel Dynamics Inc. ($121.28) - Steel/Iron - After unsuccessfully testing its bearish resistance line, STLD fell to a sell signal on Friday when it broke a triple bottom at $124 and now sits against support at $120. The weight of the evidence remains positive as STLD is a 4 for 5'er that ranks in the top third of the steel/iron sector matrix. |
| TGT Target Corporation ($139.28) - Retailing - TGT broke a double bottom at $144 to return to a sell signal as the stock fell to test support at $140. The move violates the bullish support line, which will drop the stock to a 0 for 5'er trading in a negative trend. Beyond current support, additional can be found at $132. |
| TRGP Targa Resources Corp. ($130.18) - Gas Utilities - TRGP reversed into Os and broke a double bottom to initiate a shakeout pattern. The stock is a 5 for 5'er that ranks 2nd (out of 17) in the Gas Utilities sector matrix and is accompanied by a yield north of 2%. From here, the action point for the shakeout pattern would be upon a reversal back into Xs, while the pattern would be complete upon a triple top break at $140. Support on smaller scale charts can be found in the mid-$110s, while support on the default chart lies at $96. |
| Name | Option Symbol | Action | Stop Loss |
|---|---|---|---|
| J.P. Morgan Chase & Co. - $197.99 | O: 24J195.00D18 | Buy the October 195.00 calls at 12.50 | 178.00 |
| Name | Option | Action |
|---|---|---|
| Halliburton Company ( HAL) | Sep. 38.00 Calls | Stopped at 32.00 (CP: 31.67) |
| Permian Resources Corp. ( PR) | Aug. 16.00 Calls | Stopped at 14.00 (CP: 14.73) |
| AFLAC Incorporated ( AFL) | Aug. 85.00 Calls | Stopped at 13.00 (CP: 12.40) |
| Occidental Petroleum Corporation ( OXY) | Sep. 62.50 Calls | Stopped at 58.00 (CP: 57.50) |
| Bunge Limited ( BG) | Oct. 110.00 Calls | Stopped at 100.00 (CP: 98.14) |
| Name | Option Symbol | Action | Stop Loss |
|---|---|---|---|
| Verizon Communications Inc. - $40.72 | O: 24V41.00D18 | Buy the October 41.00 puts at 1.67 | 44.00 |
| Name | Option | Action |
|---|---|---|
| Microchip Technology Incorporated ( MCHP) | Oct. 90.00 Puts | Initiate an option stop loss of 12.00 (CP: 14.00) |
| Autodesk, Inc. ( ADSK) | Oct. 240.00 Puts | Initiate an option stop loss of 16.30 (CP: 18.30) |
| Chevron Corporation ( CVX) | Sep. 155.00 Puts | Initiate an option stop loss of 6.50 (CP: 8.50) |
| Chevron Corporation ( CVX) | Dec. 155.00 Puts | Raise the option stop loss to 10.55 (CP: 12.55) |
| United Airlines Holdings Inc. ( UAL) | Dec. 47.00 Puts | Raise the option stop loss to 6.05 (CP: 8.05) |
| Old Dominion Freight Line, Inc. ( ODFL) | Dec. 205.00 Puts | Initiate an option stop loss of 18.40 (CP: 20.40) |
| Name | Option Sym. | Call to Sell | Call Price | Investment for 500 Shares | Annual Called Rtn. | Annual Static Rtn. | Downside Protection |
|---|---|---|---|---|---|---|---|
| Ally Financial Inc. $ 42.55 | O: 24K41.00D15 | Nov. 41.00 | 3.20 | $ 18,969.50 | 24.32% | 25.30% | 6.78% |
| Name | Action |
|---|---|
| Sunrun Inc ( RUN) - 17.51 | Sell the October 18.00 Calls. |
| Smith & Wesson Brands Inc. ( SWBI) - 16.23 | Sell the November 17.50 Calls. |
| Seagate Technology ( STX) - 99.00 | Sell the December 105.00 Calls. |
| NVIDIA Corporation ( NVDA) - 109.43 | Sell the November 118.00 Calls. |
| Live Nation Entertainment Inc. ( LYV) - 92.98 | Sell the November 95.00 Calls. |
| Name | Covered Write |
|---|---|
|
|
|
Daily Equity & Market Analysis
Loading, Please Wait...
