
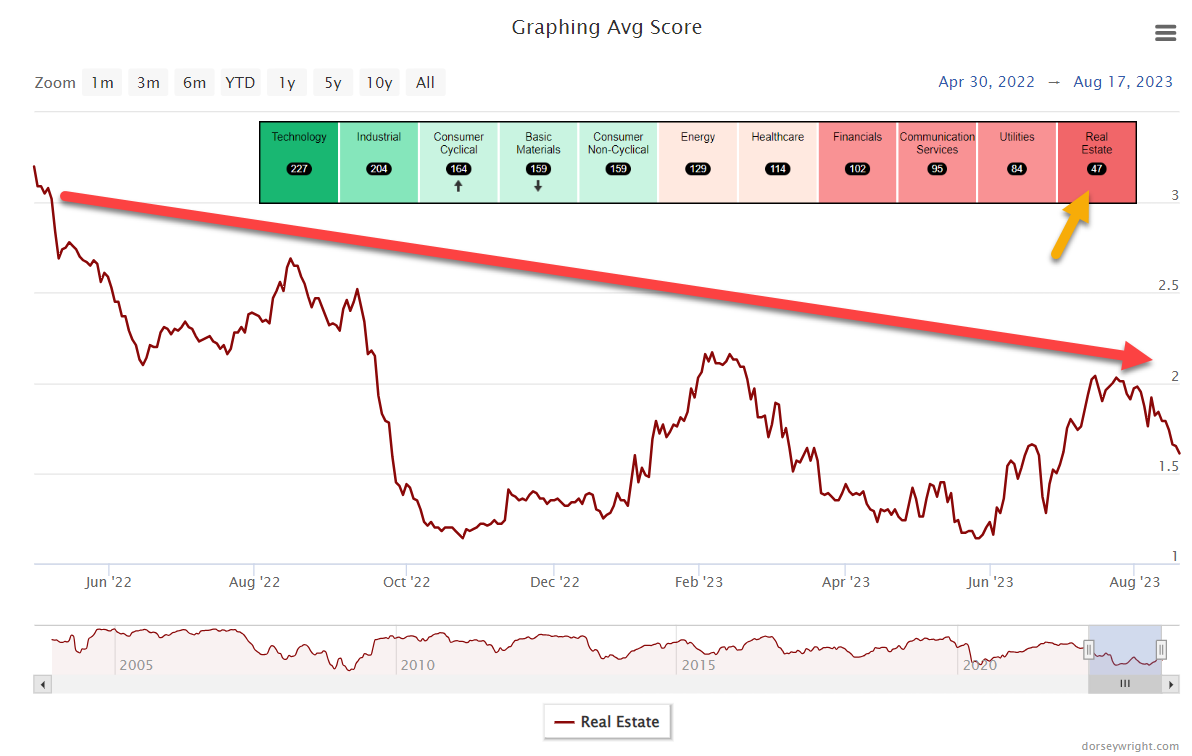
Real Estate remains in the basement of our sector rankings and recently posted some of its worst trailing relative performance on record. Is there a mean reversion opportunity?
Housing and Real Estate are a cornerstone of how we all live our lives. At least for the recent past, the same cannot be said for helping out our investment portfolios, which have been best suited to steer clear of the sector. We have touched on this throughout the past 12 months as the group has persistently posted low relative strength readings across the platform; currently, Real Estate holds an average fund score of only 1.61 and earns a pitiful 47 buy signals within the DALI sector rankings. Individual stock picking has been just as difficult, with few representatives holding what the analyst team would consider acceptable ratings from a technical perspective. With knowledge of this historically bad run on the back burner, today’s report will focus on other instances of such underperformance in hopes of identifying what may be in store for the group in the near future.
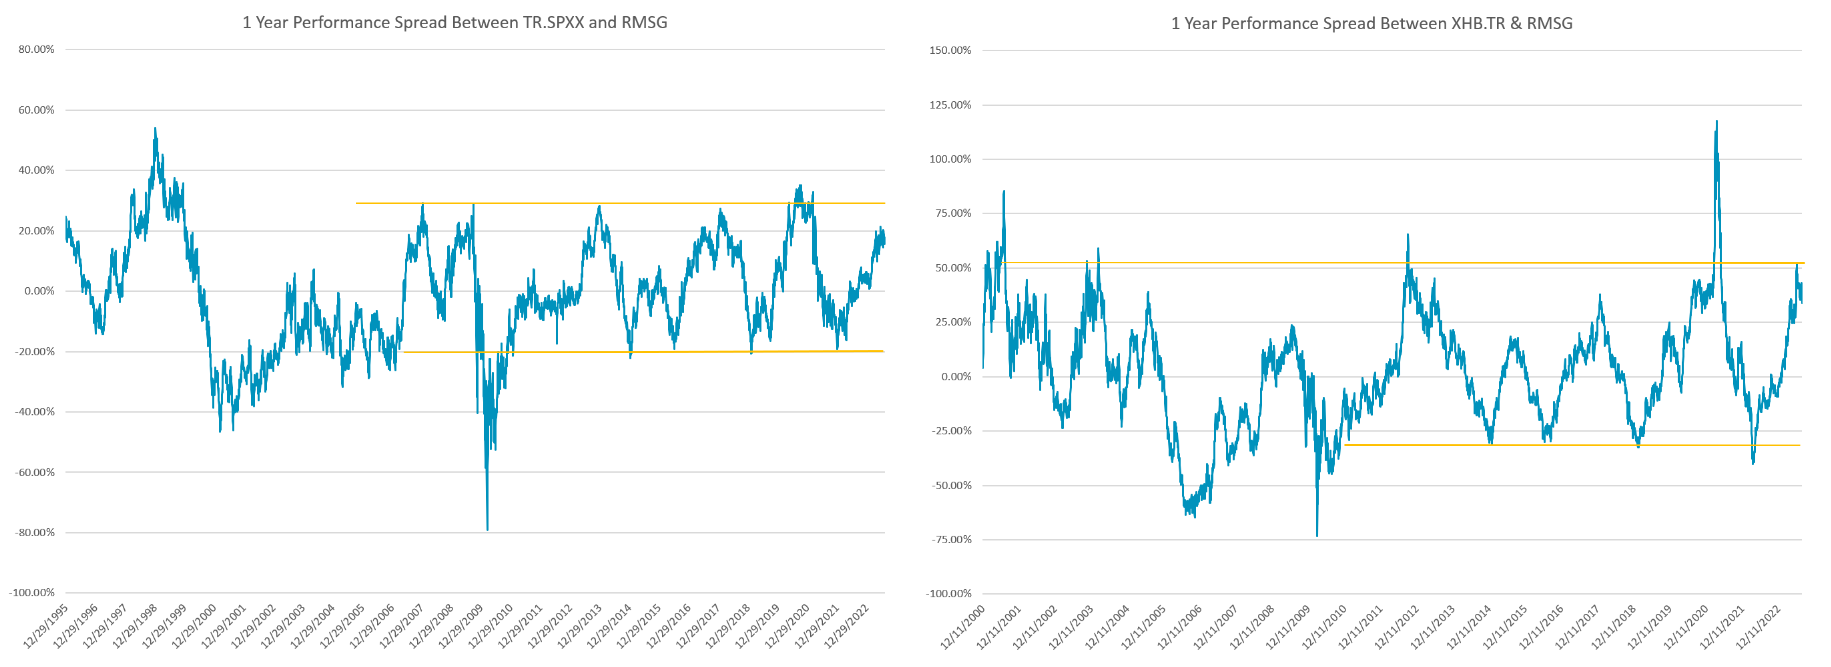
To do this, we ran a performance spread between the S&P 500 (TR.SPXX, which assumes dividend reinvestment) and the MSCI US REIT Total Return Index RMSG. By nature of the business models behind the sector, Real Estate can often take on the “income” focused role within a client’s portfolio. For this reason, dividends were included in today’s analysis to allow each group to play on a level field. Even with dividends included for RMSG, rolling 1-year performance for the index is underperforming the broad S&P 500 by a wide margin, nearly 17.50% at the time of this writing. Looking at the chart on the left, this seems to be encroaching on a rather historical mark, with outperformance in favor of TR.SPXX topping out around 23% five times over the last two decades. While history seldom repeats it often rhymes, suggesting that further underperformance from the sector in comparison to the broad market would be quite rare.
On the other side of the conversation comes homebuilders, which have continued to rocket forward as the demand for new builds remains strong from a macro perspective. A similar 1-year performance spread between the SPDR S&P Homebuilders ETF XHB.TR and RMSG was run, revealing a similar picture to the one discussed earlier. Outside of the strong showing (100%+ outperformance in favor of XHB.TR) in 2020, the rolling 1-year performance spread is at somewhat historic levels. All this considered, the performance spreads suggest a near-term uptick (or at least stabilization) could be due for this washed-out sector.
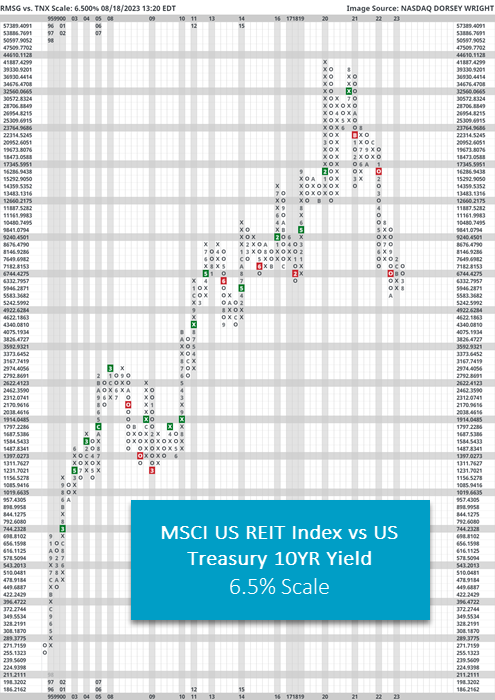
As for why Real Estate is underperforming to this degree, that is generally outside of our lane as technical analysts; however, we can say that interest rates have historically been a good indicator. Before delving into this relationship, note that many Real Estate names traded in the marketplace (and underlying popular equity ETFs like XLRE) are Real Estate Investment Trusts, REITs for short. These investment vehicles pool capital from numerous investors to purchase and operate income-generating Real Estate. The trust is then required to distribute at least 90% of its taxable income in the form of shareholder dividends each year, which will often translate to high dividend yields for investors. A REIT is publicly traded, which brings liquidity to a traditionally illiquid asset class and will often specialize in a certain type of property such as hotels, shopping malls, etc. In addition to the payout requirement, REITs can also offer potential tax benefits and diversification to an investment portfolio.
So, given this background, rising interest rates can undoubtedly impose some headwinds for REITs. Summarized well by S&P Global, “All else being equal, higher interest rates tend to decrease the value of properties and increase REIT borrowing costs. In addition, higher interest rates make the relatively high dividend yields generated by REITs less attractive when compared with lower-risk, fixed-income securities, which reduces their appeal to income-seeking investors.”
We will conclude today with a relative strength chart between the Invesco S&P 500 Equal Weight Real Estate ETF (RSPR, formally known as EWRE) and the S&P 500 Equal Weight (SPXEWI). In question form, this chart answers, “How is the average Real Estate stock faring against the S&P 500?” We partly know the answer based on the spreads first discussed in today’s piece, but this chart adds further perspective from a cumulative point of view. As we can see, the record lows from March 2009 are not far off; in fact, we are only about 10% away. Although we do not call past lows on a relative strength chart “support” or past highs “resistance” as we would on a regular trend chart, they can still be notable areas of market memory – especially in this case.
Extreme underperformance can certainly go on longer than anticipated, and the overall technical trend is still against the Real Estate sector currently. However, as trend followers we must also be mindful of potential mean reversions; the longer this trend of severe underperformance persists the more intently we (and others) will likely be watching.

