
The Real Estate sector recently experienced an abundance of upside participation, and as a result, is now among the best-performing areas so far this year. However, we believe there could be a sell on rally opportunity on the horizon.
The first three weeks of 2023 have been led by the laggards, or in other words, areas of the market that have not performed well over a longer timeframe. Communications (XLC), Consumer Discretionary (XLY), and Real Estate (XLRE) are the best-performing sectors year-to-date (through 1/19), but in 2022 they were the worst three performing sectors – in the same order. XLC was the worst performing, XLY was the second worst performing, and XLRE was the third worst performing. Seasonal tendencies, like tax loss harvesting, could explain some of this behavior but given the sheer degree of participation from these sectors in recent weeks we figured it was worth addressing today. Although, instead of tackling each sector we will focus our attention on Real Estate.
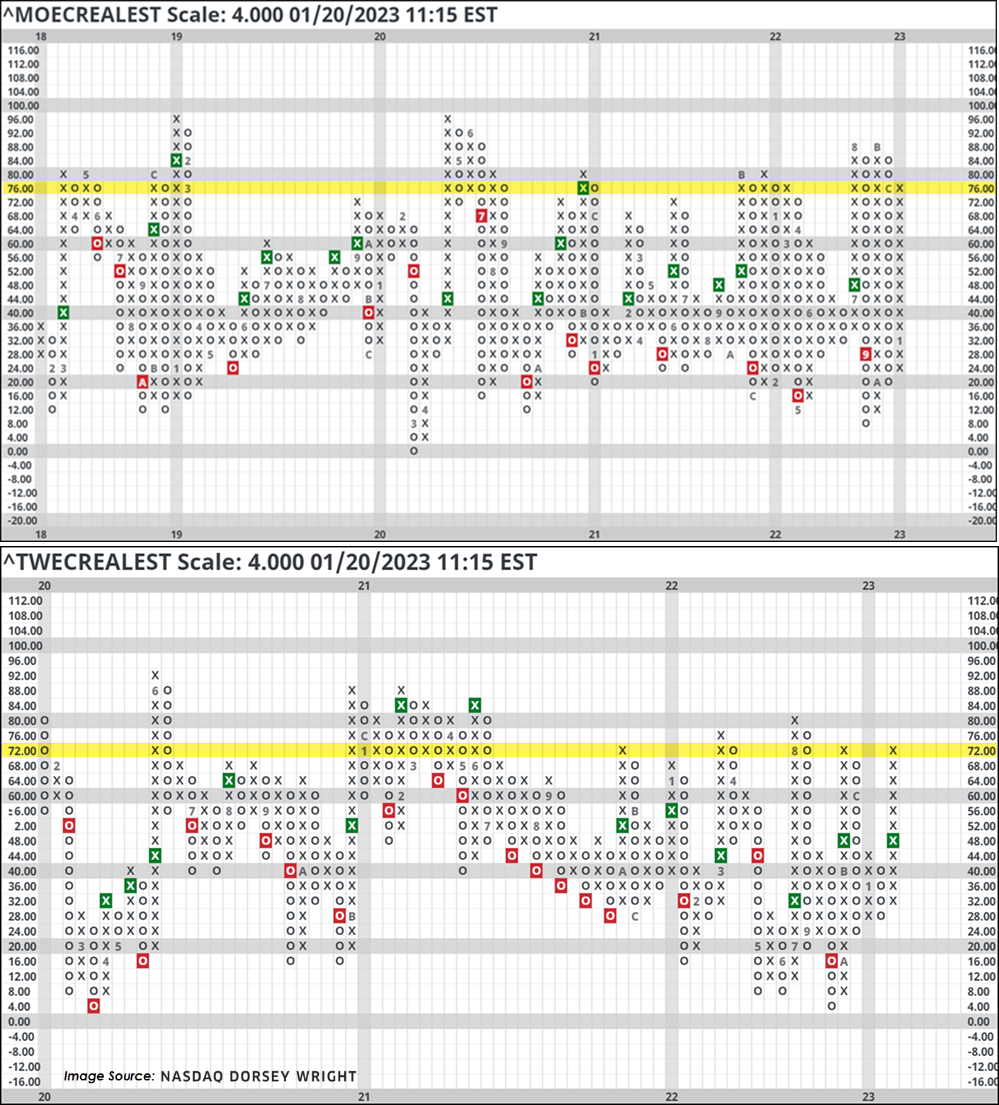
High Participation from a Laggard Sector: The two charts below measure individual stock participation within the Real Estate sector in different ways. The top chart calculates the percent of stocks with positive weekly momentum, a short-term and sensitive reading. As of Thursday (1/19), 78% of Real Estate stocks had positive weekly momentum which tied for third most of all the major 11 sectors. The bottom chart measures the percent of stocks above their ten-week (50-day) moving average. As of Thursday, this read 62%. Note that we used a 4% box size for each of these indicator charts to present a “zoomed-out” view to add a perspective of where this reading has reached in the past several years. In both cases, these readings sit in a high field position.
It is not uncommon to see a high degree of participation from a laggard sector; in fact, most know that during market selloffs it is often the beaten-down stocks that see the sharpest bounces to the upside. Now, distinguishing a laggard rally from a breadth thrust (which is more often associated with a new trend of outperformance) is something less commonly agreed upon. In our case, we look at these participation indicators through the lens of longer-term relative strength rankings like DALI and the Asset Class Group Scores (ACGS) Page, and on each tool, we find Real Estate sitting near the bottom. In fact, the sector ranks second to last on both pages.
Furthermore, the sector not only sits second to last on DALI and the ACGS page, but it has been unable to gain relative strength buy signals or achieve a positive group score direction on the two systems, respectively. So, when pairing the lofty individual stock participation indicators we began our discussion with today against the sustained downtrend/period of relative underperformance for the sector observed in DALI and the ACGS page, it would suggest looking for an exit instead of entry opportunity in the near future.

Extended Rate Moves Suggest a Nearing Inflection Point: Admittedly, trend-following strategies (like our own) will struggle at market inflection points – or times when there is a sharp change of leadership on an asset class or sector level. To this point, there are a couple of other things worth considering as it relates to Real Estate that could affect our technical rankings. The first is interest rates; more specifically, the magnitude of the recent decline. In the left-hand chart below, we see the US 10YR Yield Index (TNX) slicing through its last nearby level of support at 3.4%, resulting in a triple bottom sell signal. Following this move, TNX carries a weekly overbought/oversold (OBOS) reading of -55.81% which is the most oversold reading since December 2021. Falling interest rates have typically been a tailwind for the Real Estate sector and quickly rising rates have been a noted headwind. This is summarized well by S&P Global, “All else being equal, higher interest rates tend to decrease the value of properties and increase REIT borrowing costs. In addition, higher interest rates make the relatively high dividend yields generated by REITs less attractive when compared with lower-risk, fixed-income securities, which reduces their appeal to income-seeking investors.”
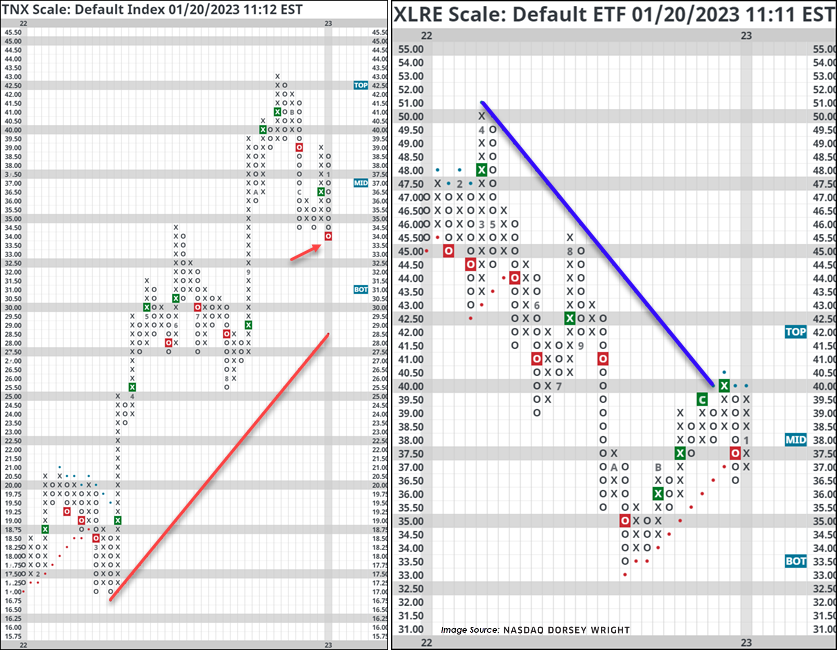
However, we could see some dislocation from this norm in the near term due to a historically negative correlation between interest rates and Real Estate equities. Not only have Real Estate stocks been historically sensitive to interest rates, but their current sensitivity is at an extreme. The left-hand chart below plots the MSCI US Equity REIT Index’s (RMSG) correlation with the 10YR Treasury Yield. As we can see, the degree of negative correlation is matching the depths of 2013 and 2017 and has rarely gotten more negative in recent history. Mean reversion in this relationship would suggest a more positive correlation with interest rates, or simply less negative; however, that does not necessarily imply a direction. A move towards a more positive correlation could mean that interest rates rise alongside Real Estate stocks, or interest rates fall alongside Real Estate stocks.
In the near term, the oversold condition of rates coupled with the elevated potential for correlation reversion could suggest a sell on rally opportunity on the horizon for Real Estate stocks. Or, as first acknowledged in this section, a change of trend after the initial snapback is realized. However, until the sector can meaningfully gain ground on our DALI tool or Group Score rankings, we will be looking for opportunities to trim positions.

