Most Requested Symbols

Join us in Nashville this October!
Notable Technical Developments from the Technology, Industrial, Financials, Consumer Discretionary, Communication Services, Utilities, and Real Estate Sectors.
The curve has an average reading of 28.84%.
Today's featured stock is The Geo Group Inc. (GEO).
Comments include: CEG, LSCC, LW, PKX, QCOM, ROST, SF, TSLA, & WFRD.
Call: Citigroup (C); Put: Alibaba Group Holding Ltd (BABA); Covered Write: Best Buy Co (BBY).
NDW Morning Update Video - July 25, 2024
NDW Morning Update Video – July 25, 2024.
Click here to download MP3
The home construction group has rallied to new highs following softer than anticipated CPI data and strong earnings from the largest home builder D.R. Horton (DHI). In the last two weeks, the bullish percent for the home construction group has increased from 32% to 84%. Movements of that magnitude are quite rare, with only three years since 1995 in which the Bullish Percent added fifty percentage points in two weeks: 2008, 2019, and 2020. Even gains of forty percentage points are uncommon, as there have only been eight other years with such instances.
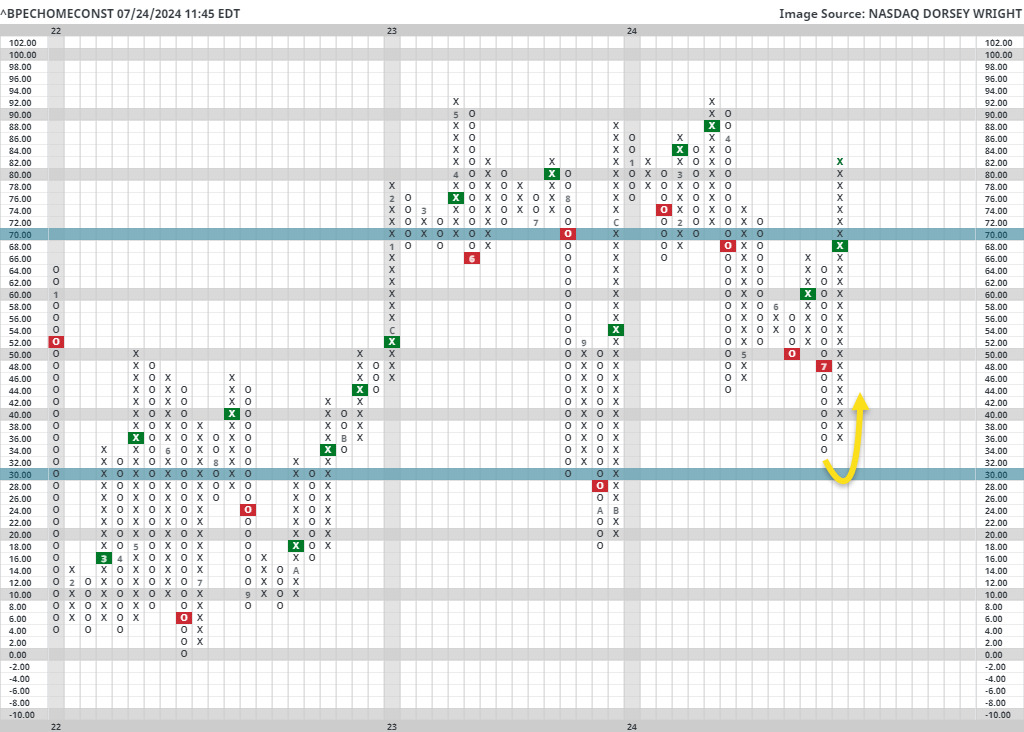
Home construction is considered a leading indicator, meaning its performance often precedes the overall economy. Consequently, we might expect increasing participation from homebuilders to foreshadow a strengthening market. Looking at forward returns when the Bullish Percent for Home Construction adds forty percentage points in two weeks, we find that the S&P 500 experiences above average returns, especially ninety days forward, as seen in the table below. Specifically, the market is up almost 90% of the time three months out, with average returns of 9.1%.
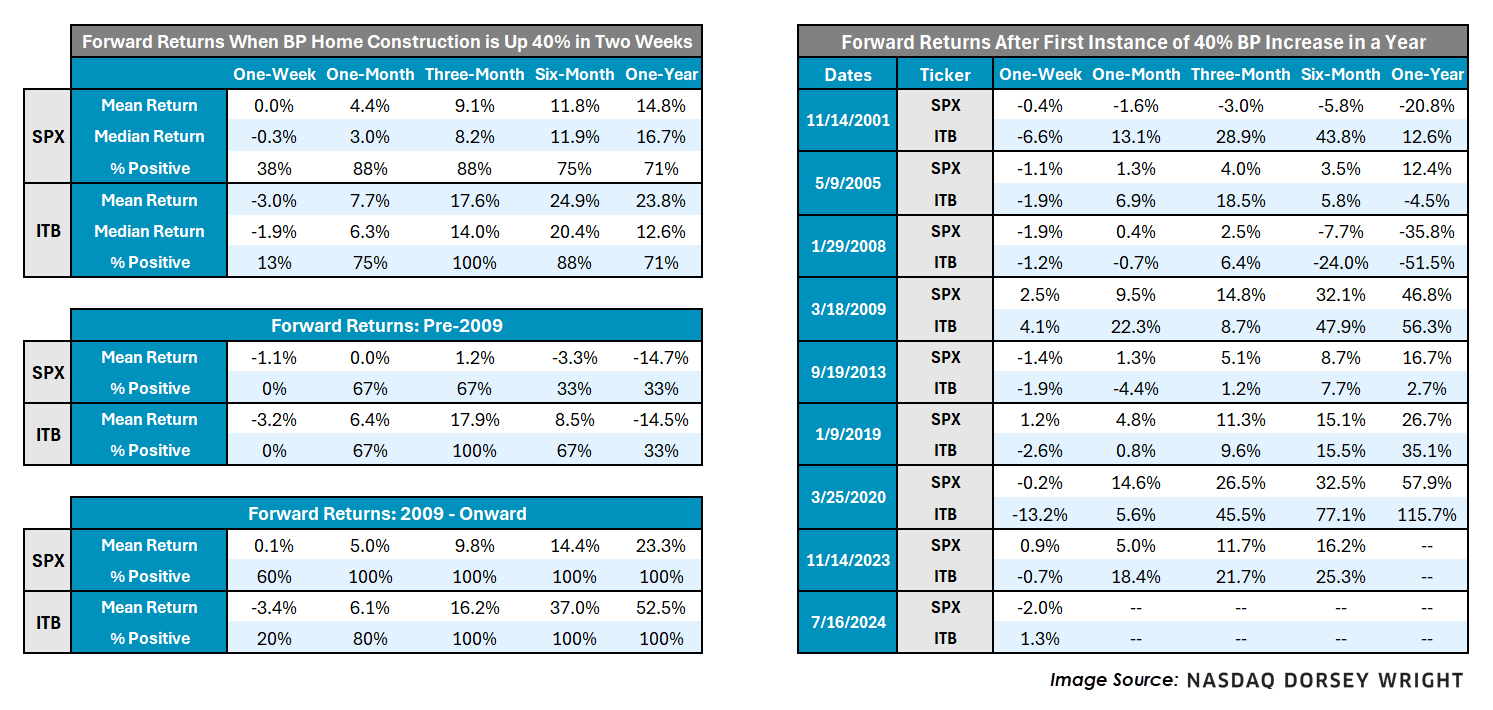
Arguably the most significant instance of a forty percentage point BP gain came in 2008, which saw a market decline of over 35% a year later, but more recent returns look quite different from before the financial crisis. Following BP gains of forty percentage points since the recession began to cool in 2009, the average one-year forward SPX return is 23.3%, the minimum one-year return is 16.7%, and 100% of instances saw positive returns after one month. Forward returns are even stronger for iShares U.S. Home Construction ETF (ITB), as the average one-year forward return is 24% – even including 2008. Most notably, three-month forward returns have been positive for ITB after every instance, averaging a 17.6% return. Since 2009, ITB’s performance has been even more impressive, with an average one-year forward return of 52%. In general, significant increases in home construction breath has been a positive sign for future performance.
That said, returns are highly volatile across all periods following those forty percentage point BP gains, and include the seismic drawdown of 2008. After said BP gains, the standard deviation of SPX one-year forward returns is 34%, around double the average of 17% for SPX since 1995. Returns are also skewed by the momentous performance following the COVID-19 plummet in March of 2020, so take performance numbers with a grain of salt.
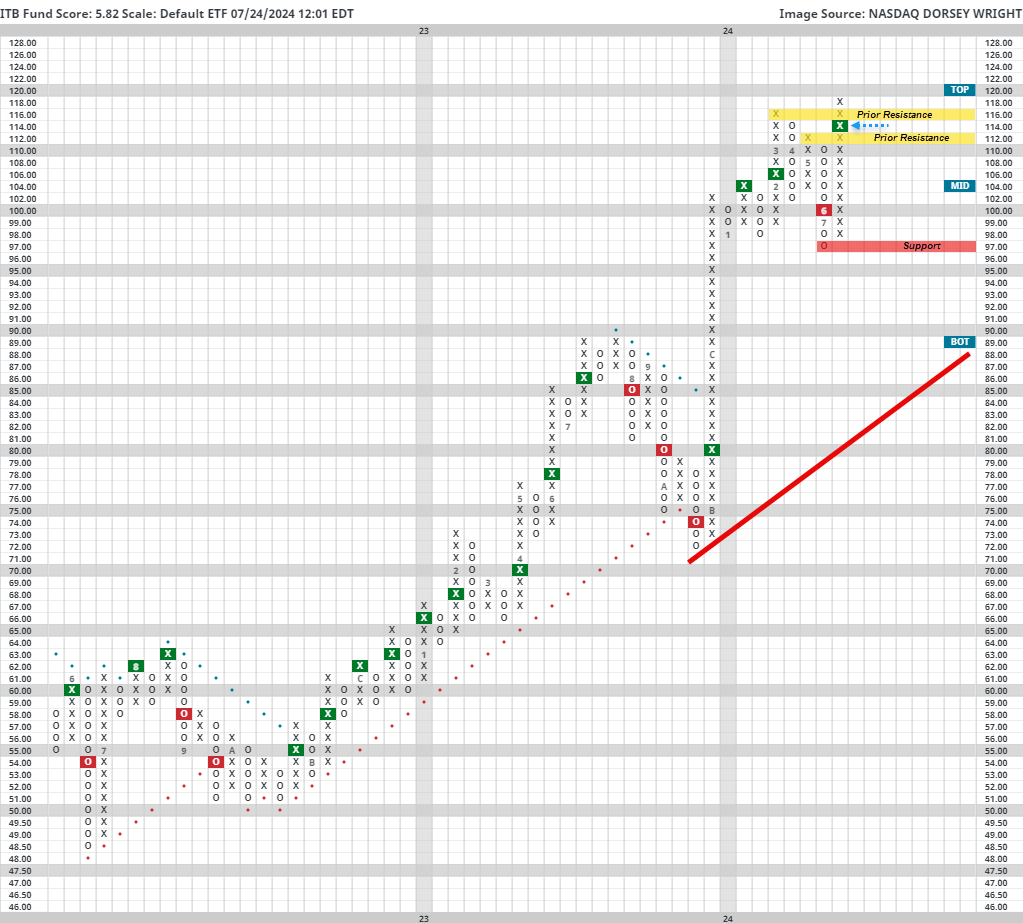
Regardless, ITB is a strong name to consider, carrying a near-perfect 5.82 fund score, recently breaking through all previous resistance to return to a buy signal. Additionally, the homebuilding group sits at first place in the group sector matrix rankings and has remained at the top spot since November of last year. Support does not start until $97, but prior resistance lies higher at $116 and $112, which can now be thought of as future support. However, those looking to add exposure should note the fund’s slightly overbought (OBOS) reading above 60%, as well as the potential for increased market volatility, if past trends persist.


We’re pleased to announce that registration is open for Catapult 2024 presented by Nasdaq Dorsey Wright in Nashville from October 15-17. Register now to take advantage of our last chance for early-bird pricing!
Join us at our revitalized fall conference for 3 days of in-depth sessions that will help you strengthen your business with scalable, repeatable processes and a clear value proposition for your clients.
Attendees will have the opportunity to hear from different members of the NDW team, including our portfolio managers and research analysts. We will also be joined be special guest speakers, including Phil Mackintosh, Head Economist at Nasdaq, Ryan Issaskainen, Senior VP & ETF Strategist at First Trust, and others!
You’ll learn:
Bringing someone from your office? Contact us for group discounts!
We look forward to seeing you!
The crypto space had an uneventful last week from a pure performance perspective. A handful of coins within the Nasdaq Crypto Index (.NCI) found themselves slightly in the red while larger coins, namely Bitcoin ($BTC) and Ethereum ($ETH) posted small weekly gains. For the most part, technical pictures within the crypto space remain largely in limbo. Bitcoin’s recent rally is constructive but several other coins have broken down to significant levels of support. All in all, continue to exercise caution as you look towards investable options within crypto.
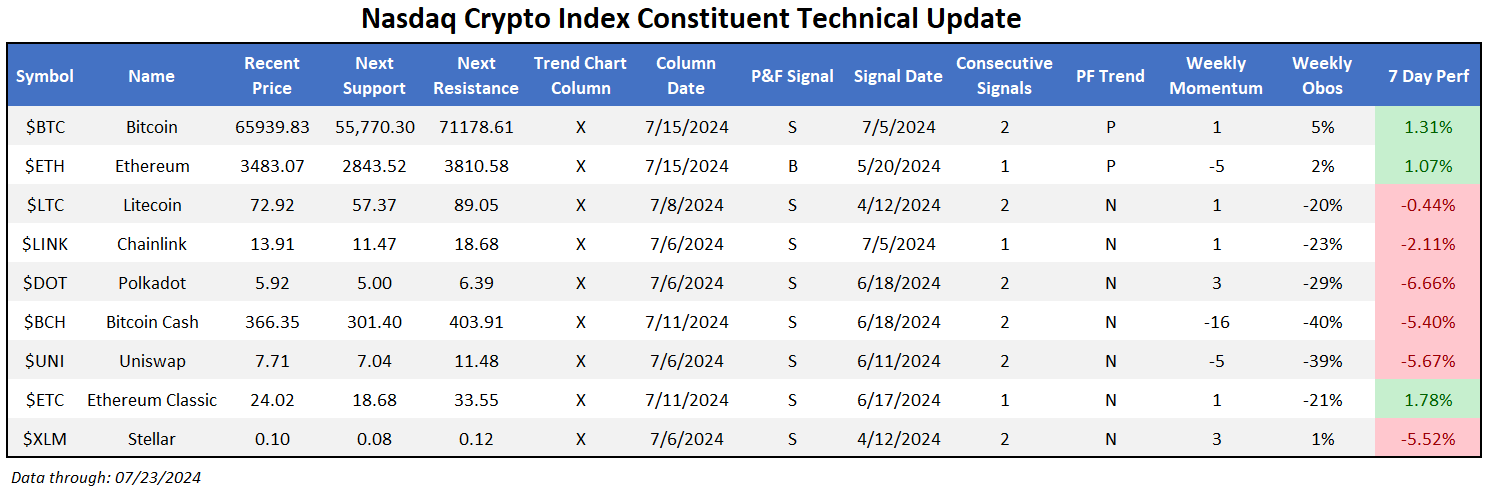
While performance metrics were somewhat muted, this week did bring the launch of several spot Ethereum ETFs to the market. This follows a slew of spot Bitcoin ETFs to open in 2024, which is typically considered a positive sign as access to crypto increases for open markets. On the first day of trading, spot Ethereum ETFs saw over 100 million net inflows, let higher by Blackrock’s ETHA. From a technical perspective, $ETH is in the middle of a notable line of support established below around $2,850 and a range of resistance up above around $3,800-$4,000. While more constructive than other coins which have moved notably lower, a third failure to breech these highs could spell further weakness for the coin.

Each week the analysts at NDW review and comment on all major asset classes in the global markets. Shown below is the summary or snapshot of the primary technical indicators we follow for multiple areas. Should there be changes mid-week we will certainly bring these to your attention via the report.
| Universe | BP Col & Level (actual) | BP Rev Level | PT Col & Level (actual) | PT Rev Level | HiLo Col & Level (actual) | HiLo Rev Level | 10 Week Col & Level (actual) | 10 Week Rev Level | 30 Week Col & Level (actual) | 30 Week Rev Level |
|---|---|---|---|---|---|---|---|---|---|---|
| ALL |
|
40% |
|
34% |
|
74% |
|
60% |
|
48% |
| NYSE |
|
54% |
|
52% |
|
84% |
|
70% |
|
68% |
| OTC |
|
34% |
|
28% |
|
68% |
|
56% |
|
42% |
| World |
|
46% |
|
38% |
|
|
|
54% |
|
44% |
Check out this week's Major Index and DALI Overview (3: ).
After being only one of two indices to finish in positive territory last week, the Russell 2000 Index RUT again leads all US equity indices this week. In last week’s DALI feature, we noted where small caps, through the iShares Russell 2000 Index IWM, had begun to show improvement from a relative strength (RS) standpoint against other asset class ETF representatives. The continued outperformance by small caps this week has brought further developments in RS as the switch between international equities and commodities in DALI was ultimately caused by small caps' improvement against representatives from the two asset classes. Additionally, the RS in Xs for the S&P Small Cap 600 Index ^RSXSPSML reversed back into Xs following Monday’s action providing evidence on the individual stock level of the space’s positive near-term RS. For those not familiar with the RS in Xs indicator (RS in Xs (^RSX)), it measures the percentage of stocks (or ETFs/mutual funds) that are in a column of Xs on their market RS charts against the S&P 500 Equal Weight Index SPXEWI. Recall that when a market RS chart resides in Xs it means the stock is exhibiting a near-term trend of outperformance over SPXEWI, and with the reversal into Xs on the RS in Xs for the S&P 600 ^RSXSPSML chart, it indicates an increase in stocks showing those near-term trends of outperformance.
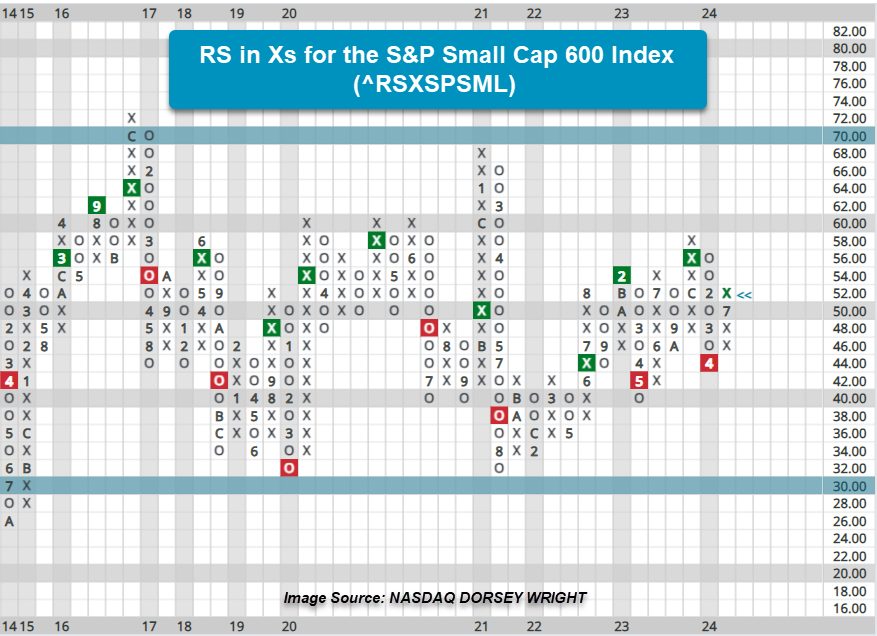
The table below breaks down those stocks by broad sector within the S&P 600 currently maintaining positive near-term market RS. The percent of total sector constituents is shown to provide a gauge for what broad sectors are contributing to the near-term increase in RS. The last two columns of the table show the number of those stocks with RS charts in Xs that maintain RS buy or sell signals, providing a barometer for how many stocks have shown or may be poised to show long-term positive RS against the market. Below are highlights from the data.
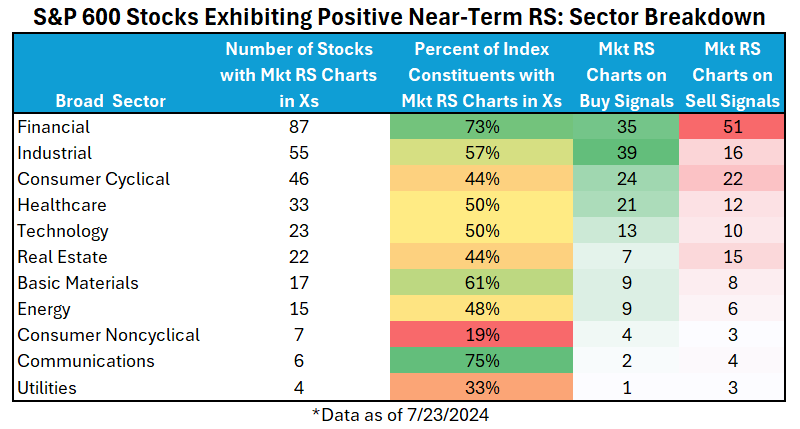
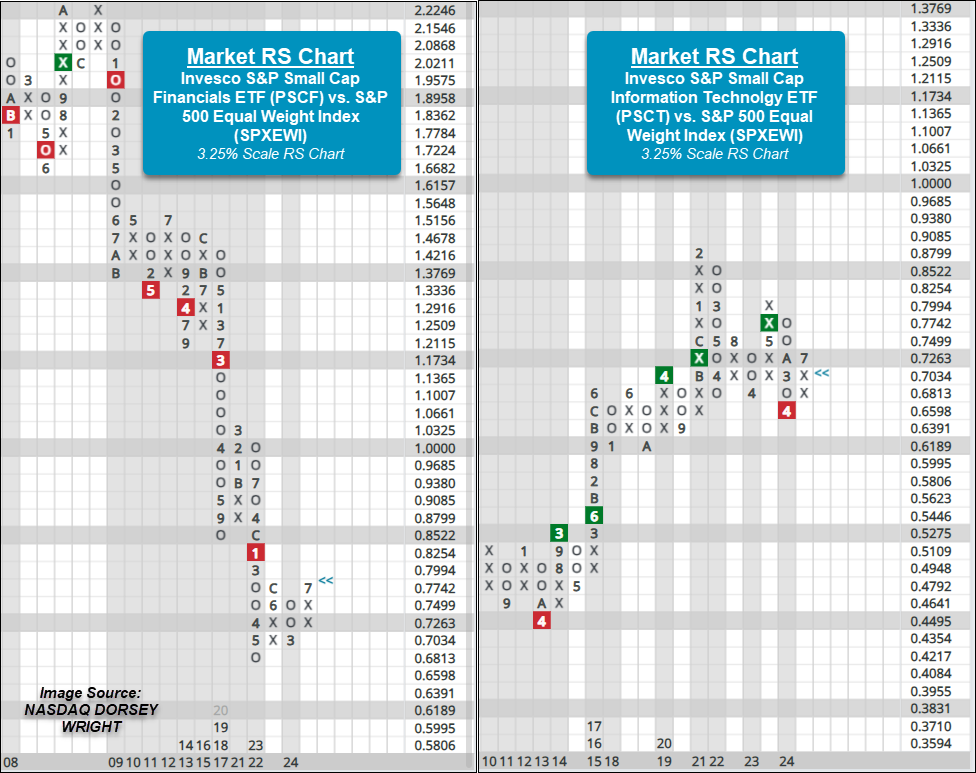
Within the Invesco small cap sector ETF lineup four sectors have exhibited or recently seen a change in near-term relative strength against the S&P 500 Equal Weight Index SPXEWI.
The two small cap sector ETFs that have seen recent changes to near-term RS are Financials PSCF and Technology PSCT as both reversed into Xs on their market RS charts during last week’s trading. Before the reversals back in Xs, Financials had been in Os since March this year while Technology had been in Os since December last year. While each ETF still resides on an RS sell signal, favoring the SPXEWI in the long term, recent action has brought the market RS chart of PSCF to within one box of an RS buy signal. Both ETFs possess acceptable fund scores with Financials PSCF registering its highest score since late-2016 at 4.61. PSCF currently trades at a multi-year high and in overbought territory, so those seeking exposure to the ETF are best served looking for price normalization at current levels or a pullback before adding. After reaching a multi-year high early last week at $51(one box below the all-time chart high), PSCT pulled back to $48.50 and actionable territory on the chart.
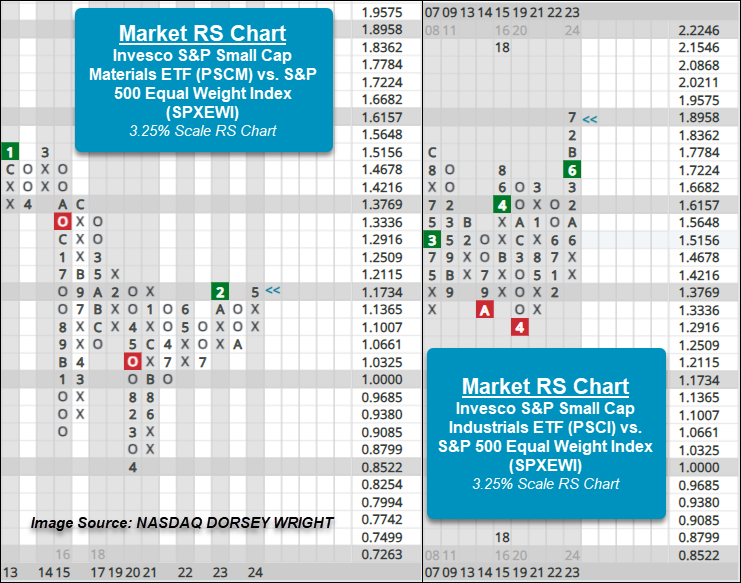
Industrials PSCI and Materials PSCM are the two additional small cap sector funds showing positive near-term market RS. Each ETF has also maintained a market RS buy signal, showing positive long-term RS, and traded in a positive trend on the default trend charts since 2023. The funds possess strong scores near 5.5 and currently trade at all-time chart highs. PSCI returned to a buy signal last week by completing a shakeout pattern while PSCM has maintained a buy signal since December last year. Those seeking exposure to PSCI may look to add on a pullback to the mid-$120s, while PSCM is actionable at current levels.

The past week saw no significant technical developments in the Basic Materials, Energy, Consumer Staples, or Healthcare Sectors. Those that saw noteworthy movement are included below, in order of their relative strength ranking in the DALI domestic equity sector rankings. Sector designations are based on DALI sector rankings and are as follows: 1 - 3 overweight, 4 - 7 equal weight, and 8 - 11 underweight.
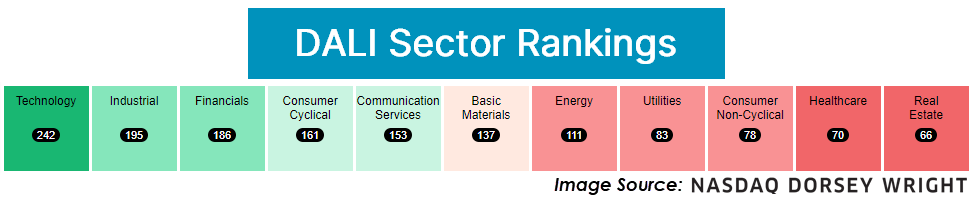
Technology – Overweight
Weekly Technology Video (4:32)
Strength continues to broaden out in Technology, with small caps (PSCT) reversing up into a column of Xs against the large-cap tech representative (XLK). The chart continues to favor XLK from a longer-term perspective, but the near-term improvement from PSCT suggests small-caps are worth considering. One name held in PSCT that looks actionable at current levels is AGYS, which runs software for the hospitality industry. Large-cap tech will be in focus over the next week with more names reporting earnings. IBM shows a constructive technical picture heading into earnings Wednesday afternoon (7/24). ON has shown substantial consolidation over the past several weeks, primed to breakout in either direction depending on earnings next Monday (7/29). MSFT continues to have one of the most consistently strong technical pictures heading into its earnings release next Tuesday (7/30).
Industrials – Overweight
Weekly Industrials Video (4:04)
The sector remains a firm overweight this week. Main standouts came from aerospace and defense names, seeing ITA move to new highs. On the earnings front, continue to avoid UPS, as it posted its 5th consecutive sell signal on its default chart after poor quarterly results and guidance. GE advanced but remains in an actionable spot for those who want to add to this perfect 5/5’er. GD slipped on its earnings but holds relevant support. Watch current levels closely. ODFL moved higher but remains a name to avoid for the long term. Recent action has been constructive but hasn’t been quite enough to improve the overall technical picture.
Financials – Overweight
Weekly Financials Video (1:51)
Financials continue to gain relative strength in our DALI rankings, now sitting just nine signals behind Industrials. Participation has also been noteworthy with 68% of stocks on a Point & Figure buy signal, the most since November 2022. Investors can consider KCE with a 5.8 fund score.
Consumer Discretionary – Equal Weight
Weekly Discretionary Video (5:18)
Cyclical stocks fell this past week along with the broader market with XLY falling 2.9%. Even with the negative action within the broader sector, the building space continued to see a notable increase in participation with the bullish percent for the subsector ^BPBUIL returning to bull confirmed status. D.R. Horton DHI rallied to new highs on earnings last week, while General Motors GM fell this week after citing issues in China during their earnings call and Tesla TSLA missed on most metrics. Earnings continue to be in full swing within the sector with roughly 15 stocks within the sector from the S&P 500 report over the next week.
Communication Services – Equal Weight
Weekly Communication Services Video (3:45)
Communication Services remains in 5th place this week as some of the tech-focused declines bring the sector lower. With that said though, action hasn’t been severe enough to suggest larger names are losing relative strength quite yet. GOOGL (GOOG) moved lower after earnings but maintained its string of four consecutive buy signals as of 7/24. CMCSA fell to 2024 lows and is a name to avoid, while SPOT rocketed higher. Continue to dollar cost into exposure to take advantage of normalization on the back of the recent 15% gain after earnings.
Utilities – Underweight
The broader Utilities sector was roughly flat for the week with XLU up 30 basis points. Participation continued to increase within subsectors of Utilities, with the bullish percent for the Electric Utilities ^BPEUTI reversing back into Xs over the past week. Additionally, the positive trend indicators for the Electric Utilities ^PTEUTI and Gas Utilities ^PTGUTI also reversed into Xs, showing not only an increase in stocks returning to buy signals but also movement of trends back to positive. NextEra NEE reported mixed earnings, but continues to be a notable name showing technical improvement. Additional earnings for the sector this week include DTE Energy DTE, CMS Energy CMS, Edison EIX, and PG&E PCG.
Real Estate – Underweight
Weekly Real Estate Video (2:41)
The real estate sector continues to trade strong. SPDR ETF XLRE was the best performing of the major 11 over the past seven days, as well as the rolling 30 days. On the Asset Class Group Scores page, real estate is just shy of the green zone with an acceptable fund score threshold of 3.0. That said, we are seeing some short-term signs of overbought conditions. Two stock standouts the past week were SPG and CBRE.
International equities saw declining relative strength over the past week, leading the asset class to fall from second to third in our DALI rankings. This relative weakness was more a result of the rapid improvement in small caps than it was deterioration in foreign stocks, as we cover in today’s Major Index and DALI overview. Still, the relative strength picture for international equities is, at best, uncertain. We have seen the asset class remain close with commodities in our DALI rankings for weeks. The broader space has been unable to show further follow-through to the upside after brief periods of improvement. This makes it more important to focus on favorable areas within the asset class that have separated themselves from the field.
Once such area is India, which just moved back into the top ten ranked countries in our NDW Country Index Matrix Ranking this week for the first time since December 2022. We have also seen India sit near the top of all 134 groups on our Asset Class Group Scores (ACGS) rankings for several weeks (currently third), and it is the only non-US group with an average score north of 5.00.
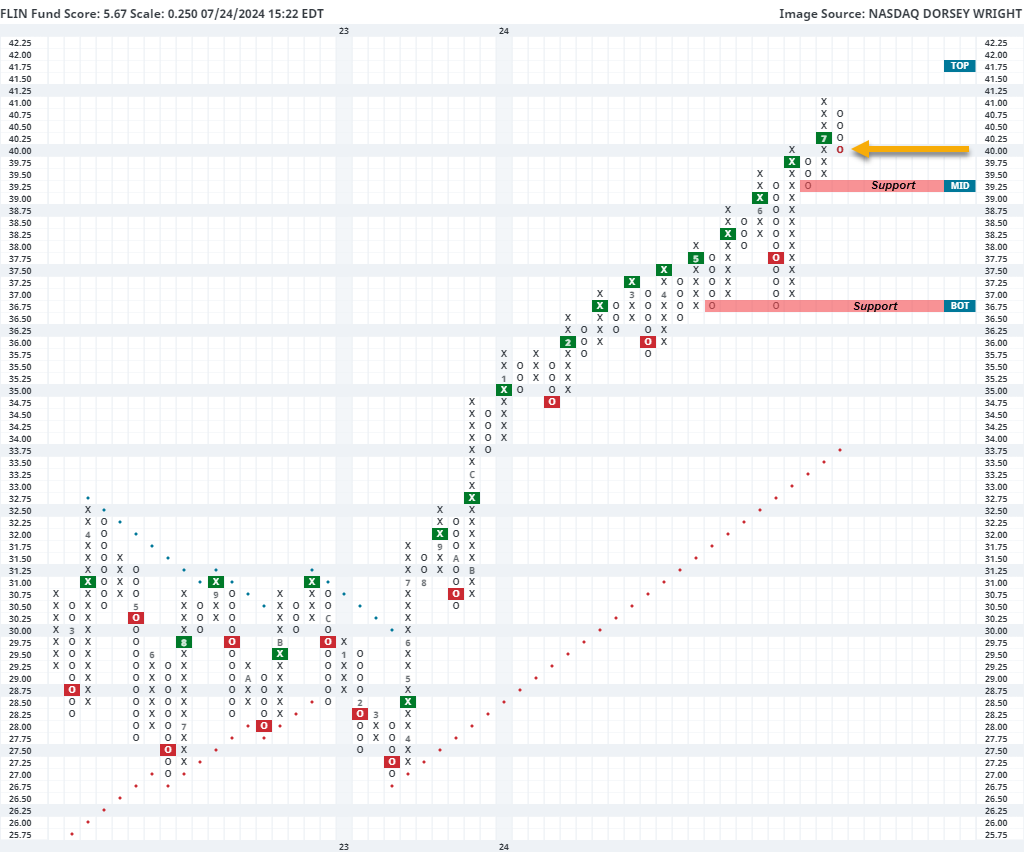
Most of the cap-weighted India funds have pulled back slightly from all-time highs over the past week, potentially offering an opportunity for those looking to add exposure. This includes the Franklin FTSE India ETF FLIN, which pulled back on its ¼ point chart from the all-time high of $41 down to $40, just above the mid-point of its trading band. This fund has shown consistent improvement for over a year and currently sits on two consecutive buy signals on the ¼ point chart after rising over 14% so far through 2024. Those looking to add exposure toward India may consider FLIN on this pullback, with initial support offered at $39.25. Further support may be seen at $36.25.
Weekly Fixed Income Update Video (2:13)
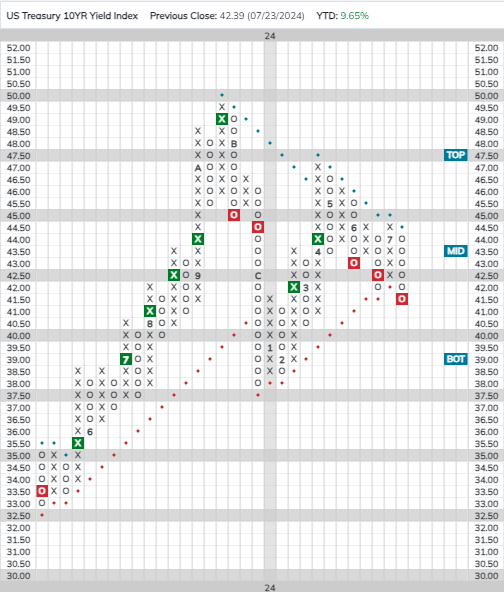
The 10-year US Treasury Yield Index (TNX) gave a third consecutive sell signal and violated its trend line last week, putting it back in a negative trend for the first time since April.
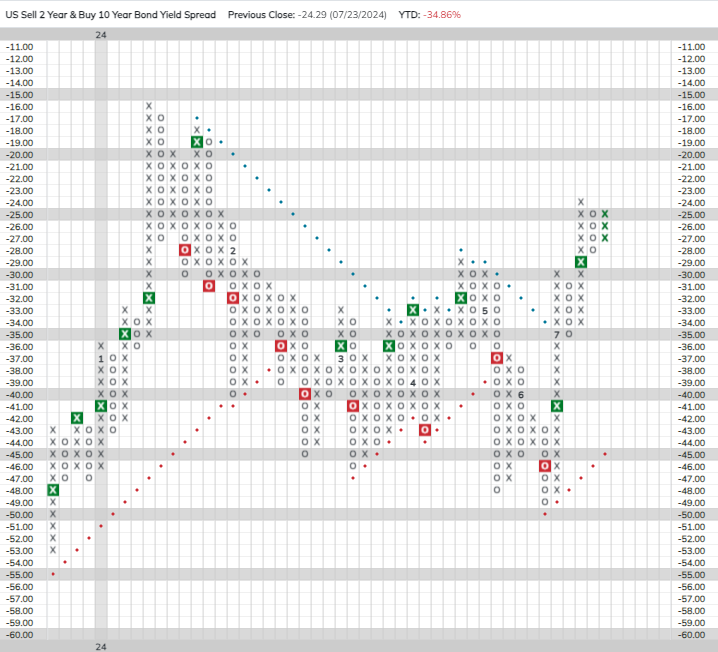
The Treasury yield curve has steepened recently as intermediate-term yields have fallen faster than long-term yields. The two-year/10-year spread is now the least inverted it has been since February. Long duration fixed income currently ranks above short-duration in the Asset Class Group Scores (ACGS) fixed income rankings, but with long-terms yields appearing to be more buoyant, short-term bonds currently may offer the better risk-reward profile.
The fed futures market is now pricing in a 100% chance of a September rate cut. On Friday, we’ll get our last look at inflation ahead of the Fed’s July meeting when the June PCE report is released. Assuming no uptick in inflation, FOMC members could use this meeting to signal their intent to lower rates in September.
The inverse fixed income group now has a -1.76 score direction, the second lowest score direction of all 134 groups in the ACGS system. The inverse group’s deeply negative score direction speaks to the recent improvement in the US fixed income market; however, many US core groups still sport less-than-ideal fund scores. Other than this, the fixed income rankings look largely the same as they did a week ago.
Remember, these are technical comments only. Just as you must be aware of fundamental data for the stocks we recommend based on technical criteria in the report, so too must you be aware of important data regarding delivery, market moving government releases, and other factors that may influence commodity pricing. We try to limit our technical comments to the most actively traded contracts in advance of delivery, but some contracts trade actively right up to delivery while others taper off well in advance. Be sure you check your dates before trading these contracts. For questions regarding this section or additional coverage of commodities email will.gibson@nasdaq.com.
Data represented in the table below is through 7/23/24:
Broad Market Commodities Report
| Symbol | Name | Price | PnF Trend | RS Signal | RS Col. | 200 Day MA | Weekly Mom |
|---|---|---|---|---|---|---|---|
| CL/ | Crude Oil Continuous | 76.96 | Positive | Buy | X | 78.77 | - 1W |
| DBLCIX | Deutsche Bank Liquid Commodities Index | 463.54 | Negative | Sell | O | 481.78 | - 2W |
| DWACOMMOD | DWA Continuous Commodity Index | 857.01 | Positive | Buy | O | 832.46 | - 7W |
| GC/ | Gold Continuous | 2407.30 | Positive | Buy | X | 2154.78 | + 3W |
| HG/ | Copper Continuous | 4.14 | Negative | Buy | X | 4.08 | - 9W |
| ZG/ | Corn (Electronic Day Session) Continuous | 402.50 | Negative | Sell | O | 448.27 | - 8W |
Weekly Commodities Video (2:27)
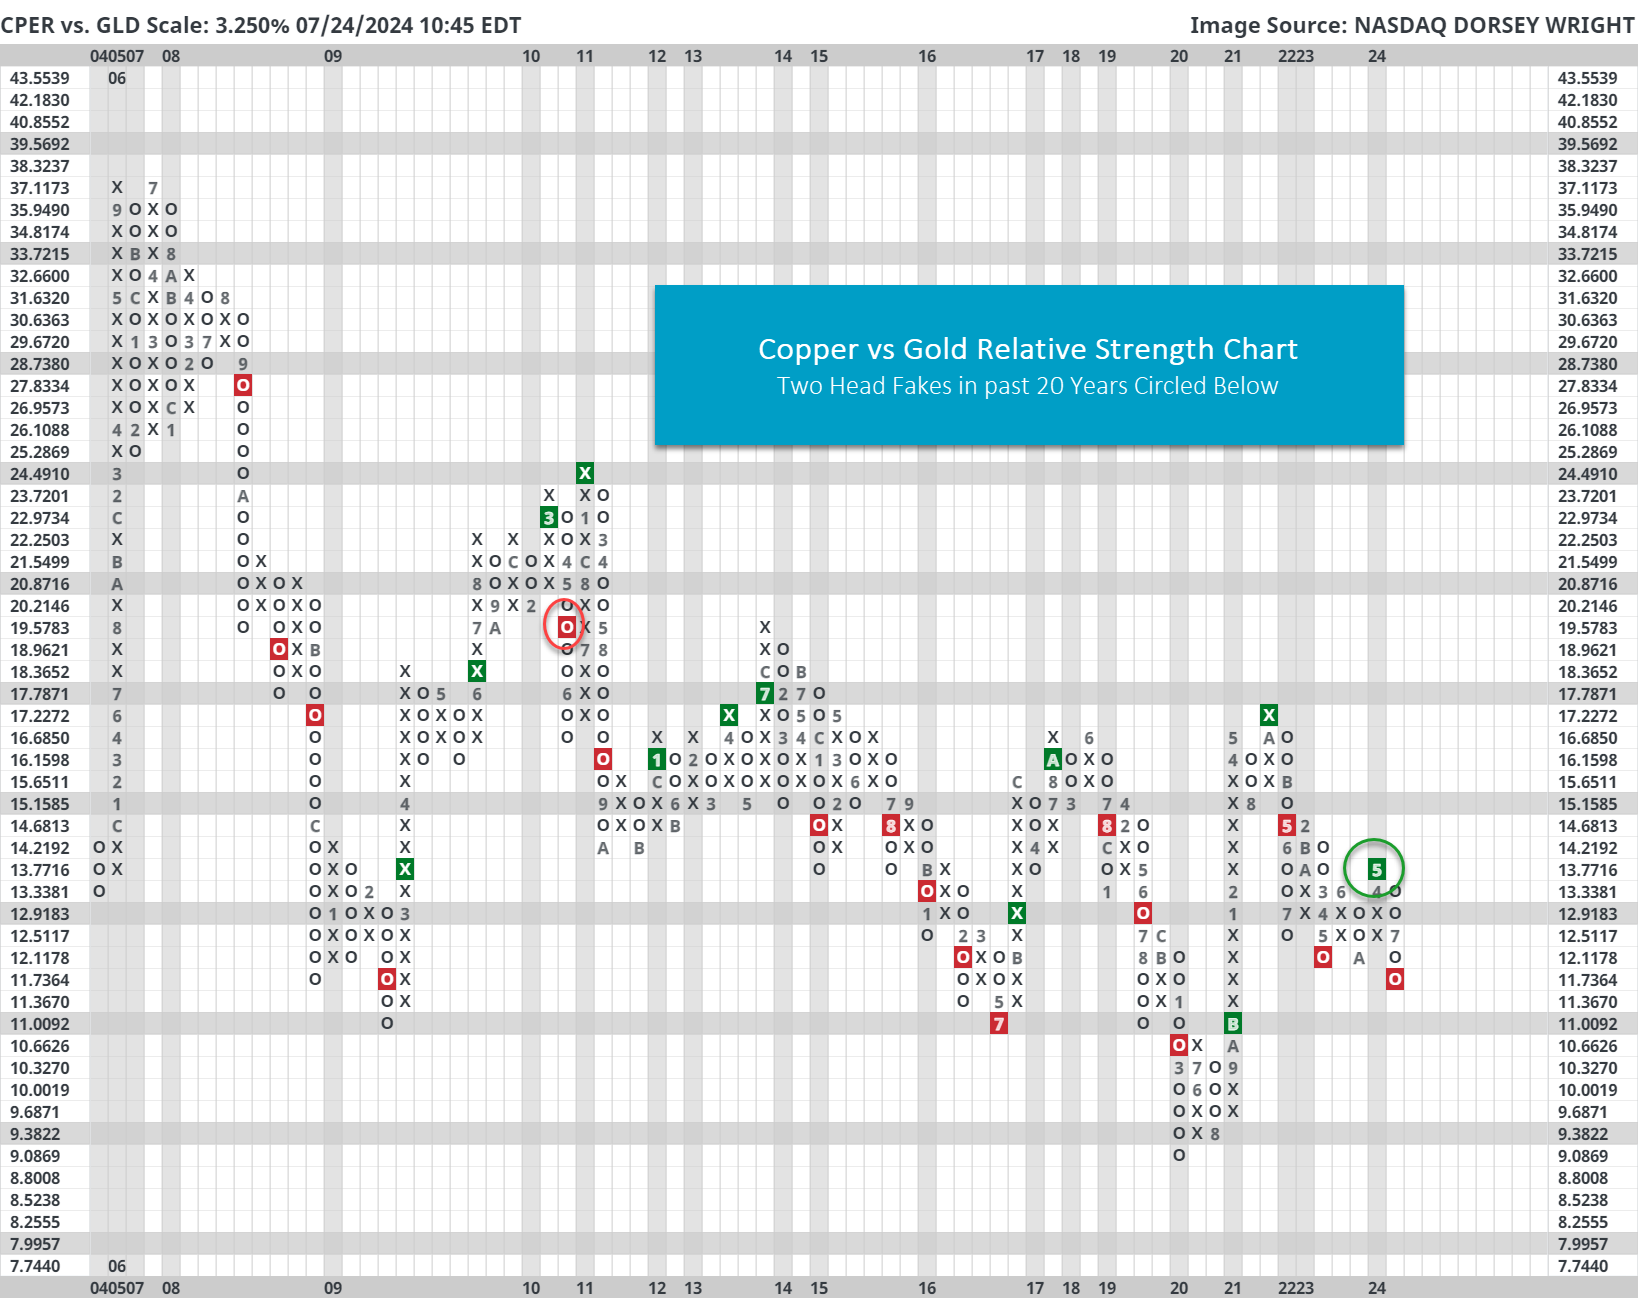
Precious metals climbed to the top of our commodity rankings on DALI for the first time since April of this year. As expected last week, gold (GLD) and copper (CPER) were two of the primary reasons for this shakeup. Over the past seven days gold lost 2.5% yet copper fell 6.4%. Over the past 30 days, copper has lost over 5% while gold has gained nearly 4%.
The extreme performance bifurcation pushed copper to a relative strength sell signal against gold. As seen on the chart below, the relationship typically “trends” quite well – meaning that relative strength buy signals usually led to more relative strength buy signals, and vice versa for sell signals.
In hindsight, the May 2024 buy signal was different because there was no follow through to the upside for copper...which is rare. Interestingly, the only other time in the past two decades where we saw no signal follow through was May 2010.
That said, the direction of this relationship seems muddy right now; however, bulls should like to see this turnaround quickly in favor of copper as further explained here.
Average Level
28.84
| < - -100 | -100 - -80 | -80 - -60 | -60 - -40 | -40 - -20 | -20 - 0 | 0 - 20 | 20 - 40 | 40 - 60 | 60 - 80 | 80 - 100 | 100 - > |
|---|---|---|---|---|---|---|---|---|---|---|---|
|
Sell signalfxe
|
|||||||||||
|
Buy signalQQQ
|
|||||||||||
|
Buy signalgld
|
|||||||||||
|
Buy signalief
|
|||||||||||
|
Buy signalagg
|
|||||||||||
|
Buy signalVOOV
|
|||||||||||
|
Buy signaldx/y
|
Buy signalONEQ
|
Buy signalIJH
|
|||||||||
|
Buy signalUSO
|
Buy signalVOOG
|
Buy signalSPY
|
Buy signalijr
|
||||||||
|
Buy signalgsg
|
Buy signaleem
|
Sell signaltlt
|
Buy signalrsp
|
Buy signaldia
|
Buy signalhyg
|
Buy signalicf
|
|||||
|
Sell signalgcc
|
Buy signalefa
|
Buy signallqd
|
Buy signalXLG
|
Buy signaldvy
|
Buy signalshy
|
Buy signaliwm
|
|||||
| < - -100 | -100 - -80 | -80 - -60 | -60 - -40 | -40 - -20 | -20 - 0 | 0 - 20 | 20 - 40 | 40 - 60 | 60 - 80 | 80 - 100 | 100 - > |
| AGG | iShares US Core Bond ETF |
| USO | United States Oil Fund |
| DIA | SPDR Dow Jones Industrial Average ETF |
| DVY | iShares Dow Jones Select Dividend Index ETF |
| DX/Y | NYCE U.S.Dollar Index Spot |
| EFA | iShares MSCI EAFE ETF |
| FXE | Invesco CurrencyShares Euro Trust |
| GLD | SPDR Gold Trust |
| GSG | iShares S&P GSCI Commodity-Indexed Trust |
| HYG | iShares iBoxx $ High Yield Corporate Bond ETF |
| ICF | iShares Cohen & Steers Realty ETF |
| IEF | iShares Barclays 7-10 Yr. Tres. Bond ETF |
| LQD | iShares iBoxx $ Investment Grade Corp. Bond ETF |
| IJH | iShares S&P 400 MidCap Index Fund |
| ONEQ | Fidelity Nasdaq Composite Index Track |
| QQQ | Invesco QQQ Trust |
| RSP | Invesco S&P 500 Equal Weight ETF |
| IWM | iShares Russell 2000 Index ETF |
| SHY | iShares Barclays 1-3 Year Tres. Bond ETF |
| IJR | iShares S&P 600 SmallCap Index Fund |
| SPY | SPDR S&P 500 Index ETF Trust |
| TLT | iShares Barclays 20+ Year Treasury Bond ETF |
| GCC | WisdomTree Continuous Commodity Index Fund |
| VOOG | Vanguard S&P 500 Growth ETF |
| VOOV | Vanguard S&P 500 Value ETF |
| EEM | iShares MSCI Emerging Markets ETF |
| XLG | Invesco S&P 500 Top 50 ETF |
| Symbol | Company | Sector | Current Price | Action Price | Target | Stop | Notes |
|---|---|---|---|---|---|---|---|
| CCEP | Coca-Cola Europacific Partners PLC | Food Beverages/Soap | $72.81 | 60s | 97 | 56 | 5 for 5'er, top 25% of FOOD sector matrix, spread quad top, R-R~3.0, 3% yield |
| LIN | Linde Plc | Chemicals | $447.41 | hi 410s - lo 460s | 572 | 360 | 5 TA rating, consec. buy signals, LT RS buy, buy-on-pullback |
| LAMR | Lamar Advertising Company | Media | $121.42 | 110s | 129 | 100 | 5 for 5'er, top third of MEDI sector matrix, LT pos mkt RS, multiple buy signals, 4.5% yield, Earn. 8/8 |
| ESTC | Elastic NV | Software | $117.39 | hi 100s - hi 110s | 151 | 92 | 4 TA rating, top 33% of SOFT sector matrix, recent pos. trend change, cosnec. buy signals, buy-on-pullback |
| NVO | Novo Nordisk A/S (Denmark) ADR | Drugs | $133.28 | hi 130s -low 140s | 225 | 120 | 5 for 5'er, top 20% of DRUG sector matrix, LT pos mkt RS, buy on pullback, R-R>3.5, Earn. 8/7 |
| GTES | Gates Industrial Corporation plc | Business Products | $17.48 | 16-18 | 23.50 | 15 | 5 TA rating, top 25% of BUSI sector matrix, LT RS buy, shakeout pattern buy point, R-R > 3, Earn. 7/31 |
| BDC | Belden, Inc. | Electronics | $95.80 | low-to-mid 90s | 115 | 80 | 5 for 5'er, top half ELEC sector matrix, LT pos mkt RS, spread triple top, Earn. 8/1 |
| KR | The Kroger Co. | Retailing | $53.84 | lo - hi 50s | 89 | 42 | 4 TA rating, top half RETA sector matrix, cosnec. buy signals, LT RS buy, R-R > 2 |
| CRH | CRH plc (Ireland) ADR | Building | $82.26 | mid 70s - low 80s | 103 | 65 | 4 for 5'er, top half of favored BUIL sector matrix, LT pos mkt RS, bearish signal reversal, 2.5% yield, Earn. 8/8 |
| BRK.B | Berkshire Hathaway Inc | Wall Street | $434.01 | low 400s - mid 430s | 556 | 392 | 5 for 5'er, top half of WALL sector matrix, LT pos mkt RS, triple top breakout, R-R>2.5 |
| EFX | Equifax Inc. | Business Products | $264.99 | 240s - 260s | 360 | 224 | 5 for 5'er, top half of BUSI sector matrix, spread quad top, buy on pullback, R-R~2.0 |
| GEO | The Geo Group Inc. | Real Estate | $16.45 | 14-17 | 34.50 | 12.50 | 5 TA rating, top 10% of REAL sector matrix, buy-on-pullback, R-R > 4, Earn. 8/7 |
| Symbol | Company | Sector | Current Price | Action Price | Target | Stop | Notes |
|---|
| Symbol | Company | Sector | Current Price | Action Price | Target | Stop | Notes |
|---|---|---|---|---|---|---|---|
| ARMK | Aramark | Food Beverages/Soap | $33.64 | low 30s | 54 | 26 | Removed for upcoming earnings (8/6). |
| SPG | Simon Property Group, Inc. | Real Estate | $156.82 | hi 140s - lo 160s | 198 | 120 | Removed for upcoming earnings (8/5). |
| APO | Apollo Global Management Inc. | Wall Street | $124.84 | 108 - 116 | 140 | 94 | Removed for upcoming earnings (8/1). |
| Comment | |||||||
|---|---|---|---|---|---|---|---|
|
|
|||||||
GEO The Geo Group Inc. ($15.67) R - Real Estate - GEO has a strong 5 for 5 TA rating and sits in the top decile of the real estate sector RS matrix. This stock moved higher earlier this month to notch a new multi-year high at $18 before retracting to the current position near $16. We have seen GEO maintain and RS buy signal against the market since October 2023, demonstrating a resilient technical picture. This pullback may offer the a more opportune entry point for potential long investors. Exposure may be considered from $14 to $17, with our initial stop positioned at $12.50. The bullish price objective of $34.50 will serve as our price target, offering a reward-to-risk ratio north of 4-to-1. Note that earnings are expected on 8/7.
| 20 | 21 | 22 | 23 | 24 | ||||||||||||||||||||||||||||||||||||||||||||||||
| 24.00 | • | 24.00 | ||||||||||||||||||||||||||||||||||||||||||||||||||
| 23.00 | O | • | 23.00 | |||||||||||||||||||||||||||||||||||||||||||||||||
| 22.00 | O | • | 22.00 | |||||||||||||||||||||||||||||||||||||||||||||||||
| 21.00 | O | • | 21.00 | |||||||||||||||||||||||||||||||||||||||||||||||||
| 20.00 | O | • | 20.00 | |||||||||||||||||||||||||||||||||||||||||||||||||
| 19.50 | 7 | • | 19.50 | |||||||||||||||||||||||||||||||||||||||||||||||||
| 19.00 | O | • | 19.00 | |||||||||||||||||||||||||||||||||||||||||||||||||
| 18.50 | O | X | • | • | 18.50 | |||||||||||||||||||||||||||||||||||||||||||||||
| 18.00 | O | X | 9 | O | X | • | X | 18.00 | ||||||||||||||||||||||||||||||||||||||||||||
| 17.50 | O | X | O | X | O | X | O | • | X | O | Top | 17.50 | ||||||||||||||||||||||||||||||||||||||||
| 17.00 | O | X | O | X | O | X | 2 | O | X | • | X | O | 17.00 | |||||||||||||||||||||||||||||||||||||||
| 16.50 | O | 8 | A | X | X | O | X | O | X | O | • | X | O | 16.50 | ||||||||||||||||||||||||||||||||||||||
| 16.00 | O | X | O | X | O | X | O | 3 | O | • | X | X | O | 16.00 | ||||||||||||||||||||||||||||||||||||||
| 15.50 | O | X | O | X | 1 | O | X | O | • | • | X | O | X | 15.50 | ||||||||||||||||||||||||||||||||||||||
| 15.00 | O | B | X | O | X | O | • | X | • | • | 4 | O | 6 | 7 | 15.00 | |||||||||||||||||||||||||||||||||||||
| 14.50 | O | X | O | O | • | X | O | • | X | • | X | O | X | O | X | 14.50 | ||||||||||||||||||||||||||||||||||||
| 14.00 | O | X | O | X | • | X | O | • | X | O | • | X | 5 | X | O | X | Mid | 14.00 | ||||||||||||||||||||||||||||||||||
| 13.50 | C | O | X | O | X | O | X | 6 | O | • | X | O | X | O | X | 13.50 | ||||||||||||||||||||||||||||||||||||
| 13.00 | O | X | O | X | O | X | O | X | O | • | 3 | O | O | 13.00 | ||||||||||||||||||||||||||||||||||||||
| 12.50 | O | X | O | X | X | O | X | O | X | O | • | • | 2 | 12.50 | ||||||||||||||||||||||||||||||||||||||
| 12.00 | O | X | O | X | O | X | X | O | X | 5 | X | O | • | C | 2 | • | X | 12.00 | ||||||||||||||||||||||||||||||||||
| 11.50 | O | X | O | X | O | X | O | X | O | • | O | X | O | • | X | O | X | O | • | 1 | 11.50 | |||||||||||||||||||||||||||||||
| 11.00 | O | O | O | X | O | X | • | O | X | O | X | • | X | O | X | O | • | C | Bot | 11.00 | ||||||||||||||||||||||||||||||||
| 10.50 | O | X | 4 | • | O | • | 7 | X | O | • | X | O | O | X | 10.50 | |||||||||||||||||||||||||||||||||||||
| 10.00 | O | • | • | • | A | C | X | O | • | • | X | O | X | 10.00 | ||||||||||||||||||||||||||||||||||||||
| 9.50 | • | O | B | O | X | O | X | • | X | • | X | O | B | • | 9.50 | |||||||||||||||||||||||||||||||||||||
| 9.00 | O | X | O | X | X | O | B | O | B | O | X | O | 5 | X | • | 9.00 | ||||||||||||||||||||||||||||||||||||
| 8.50 | O | X | 1 | X | O | X | O | X | A | O | X | O | X | 3 | X | O | A | • | 8.50 | |||||||||||||||||||||||||||||||||
| 8.00 | O | O | X | O | X | O | 8 | O | X | C | X | O | O | X | O | X | • | 8.00 | ||||||||||||||||||||||||||||||||||
| 7.50 | O | X | 2 | X | O | X | O | X | O | 8 | • | O | O | X | • | 7.50 | ||||||||||||||||||||||||||||||||||||
| 7.00 | O | 4 | X | O | X | 9 | O | 4 | • | 6 | • | 7.00 | ||||||||||||||||||||||||||||||||||||||||
| 6.50 | O | 6 | 7 | 1 | X | • | • | 6.50 | ||||||||||||||||||||||||||||||||||||||||||||
| 6.00 | O | X | 2 | X | • | 6.00 | ||||||||||||||||||||||||||||||||||||||||||||||
| 5.50 | O | X | 3 | • | 5.50 | |||||||||||||||||||||||||||||||||||||||||||||||
| 5.00 | 5 | • | 5.00 | |||||||||||||||||||||||||||||||||||||||||||||||||
| 20 | 21 | 22 | 23 | 24 |
| CEG Constellation Energy Corporation ($175.67) - Utilities/Electricity - CEG broke a double bottom at $178 for a second sell signal in July and marks the lowest chart level for the stock since March this year. The stock reversed into Os on the market RS chart last week, dropping the stock to a 4 for 5'er, and is within one box of reversing into O on the peer RS chart. From here, support now lies at $164, while the bullish support line resides at $138. |
| LSCC Lattice Semiconductor Corp ($55.40) - Semiconductors - LSCC moved lower Wednesday to break a spread triple bottom at $55, marking a fourth consecutive sell signal. This 0 for 5'er moved to a negative trend in May and sits near the bottom of the semiconductors sector RS matrix. The weight of the technical evidence is weak and deteriorating. Long exposure should be avoided. Further support can be seen at $54 with additional support at $52. Overhead resistance may be found at $59 with more notable resistance seen at $63 and $65. Note that earnings are expected on 7/29. |
| LW Lamb Weston Holdings Inc ($56.35) - Food Beverages/Soap - LW shares cratered on Wednesday after a disappointing earnings report. The stock was downgraded to a 2 for 5'er in April of this year, so those still long may consider selling into rallies. The 2022 lows are at around $50. |
| PKX POSCO (Korea) ADR ($62.88) - Steel/Iron - PKX returned to a sell signal on Wednesday when it broke a double bottom at $64. The move adds evidence to an already negative technical picture as PKX Is a 2 for 5'er that ranks in the bottom third of the steel/iron sector matrix. From here, the next level of support, which dates to March of last year, sits at $59. PKX is expected to report earnings on 7/25. |
| QCOM QUALCOMM Incorporated ($181.70) - Semiconductors - QCOM fell Wednesday to break a double bottom at $184 before falling to $182 intraday. This marks the third consecutive sell signal for this stock that has fallen to a 2 for 5 TA rating over the past week. The technical picture is weak and deteriorating. Further support may be seen at $178 with additional support seen at $158. Overhead resistance may be found at $196. Note that earnings are expected on 7/31. |
| ROST Ross Stores, Inc. ($142.98) - Retailing - ROST broke a double bottom at $142 to return to stock to a sell signal. This follows the 4 for 5'er rallying to a new all-time chart high at $152 earlier this month. Okay to continue to hold here. Support now lies at $138 and $128, while the bullish support line resides at $120. |
| SF Stifel Financial Corp ($84.28) - Wall Street - SF completed a shakeout pattern today as it broke a triple top buy signal at $87. In doing so, this 5 for 5'er, posted new all-time highs while sitting in the top quartile of the Wall Street sector. initial support now lies at $82 with further support at $77. |
| TSLA Tesla Inc. ($219.34) - Autos and Parts - TSLA reversed into Os and broke a double bottom at $236 to complete a bearish triangle as the stock fell to $216. The stock now resides within one box of reversing into Os on both the market and peer RS charts, leaving two potential attributes at risk. From here, support lies at prior resistance in the $200 range, while the bullish support line resides at $186. |
| WFRD Weatherford International Plc ($121.93) - Oil - WFRD fell to a sell signal on Wednesday when it broke a double bottom at $122. The technical picture for the stock remains positive as it is a 5 for 5'er that ranks third out of 60 names in the oil sector matrix. Wednesday's move sets up a potential shakeout pattern; the action phase of the pattern would come with a reversal up into Xs. Meanwhile, the pattern would be negated with a move to $118. |
| Name | Option Symbol | Action | Stop Loss |
|---|---|---|---|
| Citigroup, Inc. - $63.74 | O: 24J62.50D18 | Buy the October 62.50 calls at 3.95 | 58.00 |
| Name | Option | Action |
|---|---|---|
| The Trade Desk Inc ( TTD) | Sep. 95.00 Calls | Stopped at 90.00 (CP: 90.37) |
| Alphabet Inc. Class A ( GOOGL) | Oct. 175.00 Calls | Stopped at 13.65 (CP: 8.60) |
| Name | Option Symbol | Action | Stop Loss |
|---|---|---|---|
| Alibaba Group Holding Ltd (China) ADR - $75.92 | O: 24W80.00D15 | Buy the November 80.00 puts at 7.65 | 82.00 |
| Name | Option | Action |
|---|---|---|
| Caesars Entertainment Inc. ( CZR) | Sep. 40.00 Puts | Initiate an option stop loss of 4.20 (CP: 6.20) |
| Cognizant Technology Solutions ( CTSH) | Oct. 77.50 Puts | Initiate an option stop loss of 4.30 (CP: 6.30) |
| Name | Option Sym. | Call to Sell | Call Price | Investment for 500 Shares | Annual Called Rtn. | Annual Static Rtn. | Downside Protection |
|---|---|---|---|---|---|---|---|
| Best Buy Co., Inc. $ 88.95 | O: 24J87.50D18 | Oct. 87.50 | 5.55 | $ 41,303.90 | 20.65% | 23.75% | 5.30% |
| Name | Action |
|---|---|
| Abercrombie & Fitch Co. ( ANF) - 161.40 | Sell the September 175.00 Calls. |
| Airbnb, Inc. Class A ( ABNB) - 148.75 | Sell the October 155.00 Calls. |
| Sunrun Inc ( RUN) - 17.27 | Sell the October 18.00 Calls. |
| Pan American Silver Corp ( PAAS) - 22.92 | Sell the September 23.00 Calls. |
| Tapestry Inc. ( TPR) - 41.16 | Sell the November 42.50 Calls. |
| Name | Covered Write |
|---|---|
| Vistra Corp ( VST - 80.07 ) | October 90.00 covered write. |
Daily Equity & Market Analysis
Loading, Please Wait...
