Continued outperformance by small caps this week has brought further developments in relative strength (RS).
Check out this week's Major Index and DALI Overview (3: ).
After being only one of two indices to finish in positive territory last week, the Russell 2000 Index RUT again leads all US equity indices this week. In last week’s DALI feature, we noted where small caps, through the iShares Russell 2000 Index IWM, had begun to show improvement from a relative strength (RS) standpoint against other asset class ETF representatives. The continued outperformance by small caps this week has brought further developments in RS as the switch between international equities and commodities in DALI was ultimately caused by small caps' improvement against representatives from the two asset classes. Additionally, the RS in Xs for the S&P Small Cap 600 Index ^RSXSPSML reversed back into Xs following Monday’s action providing evidence on the individual stock level of the space’s positive near-term RS. For those not familiar with the RS in Xs indicator (RS in Xs (^RSX)), it measures the percentage of stocks (or ETFs/mutual funds) that are in a column of Xs on their market RS charts against the S&P 500 Equal Weight Index SPXEWI. Recall that when a market RS chart resides in Xs it means the stock is exhibiting a near-term trend of outperformance over SPXEWI, and with the reversal into Xs on the RS in Xs for the S&P 600 ^RSXSPSML chart, it indicates an increase in stocks showing those near-term trends of outperformance.
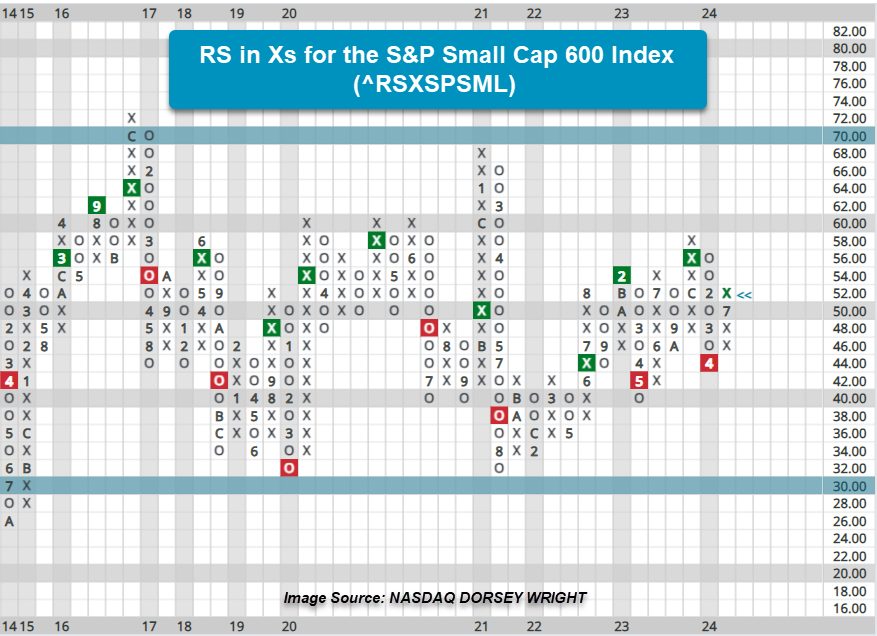
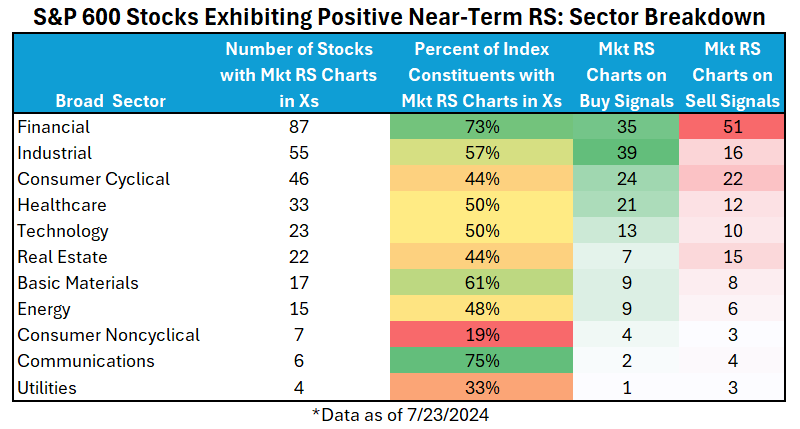
The table below breaks down those stocks by broad sector within the S&P 600 currently maintaining positive near-term market RS. The percent of total sector constituents is shown to provide a gauge for what broad sectors are contributing to the near-term increase in RS. The last two columns of the table show the number of those stocks with RS charts in Xs that maintain RS buy or sell signals, providing a barometer for how many stocks have shown or may be poised to show long-term positive RS against the market. Below are highlights from the data.
- As the RSXSPSML indicator shows, 52% of the stocks within the small-cap index exhibit positive near-term RS.
- Financial and Industrial provide the highest number of stocks and have more than half of the index constituents showing near-term positive RS. Financials have seen an increase of 30% since the beginning of Q3 in stocks exhibiting positive near-term RS.
- Technology, Basic Materials, Healthcare, and Communications are additional broad sectors with more than half of the constituents in the index maintaining positive near-term RS. Meanwhile, Consumer Cyclical, Energy, and Real Estate have just under half the index constituents showing positive near-term RS. Since the beginning of Q3, Technology, Basic Materials, Healthcare, and Real Estate have seen at least a 5% increase in stocks exhibiting near-term positive market RS.
- Consumer Noncyclical and Utilities continue to maintain a low percentage of stocks exhibiting near-term RS. Utilities have seen a slight uptick in stocks showing positive near-term RS, while Consumer Noncyclical is the only sector to have seen no additional stocks within the small cap index to show positive near-term market RS.
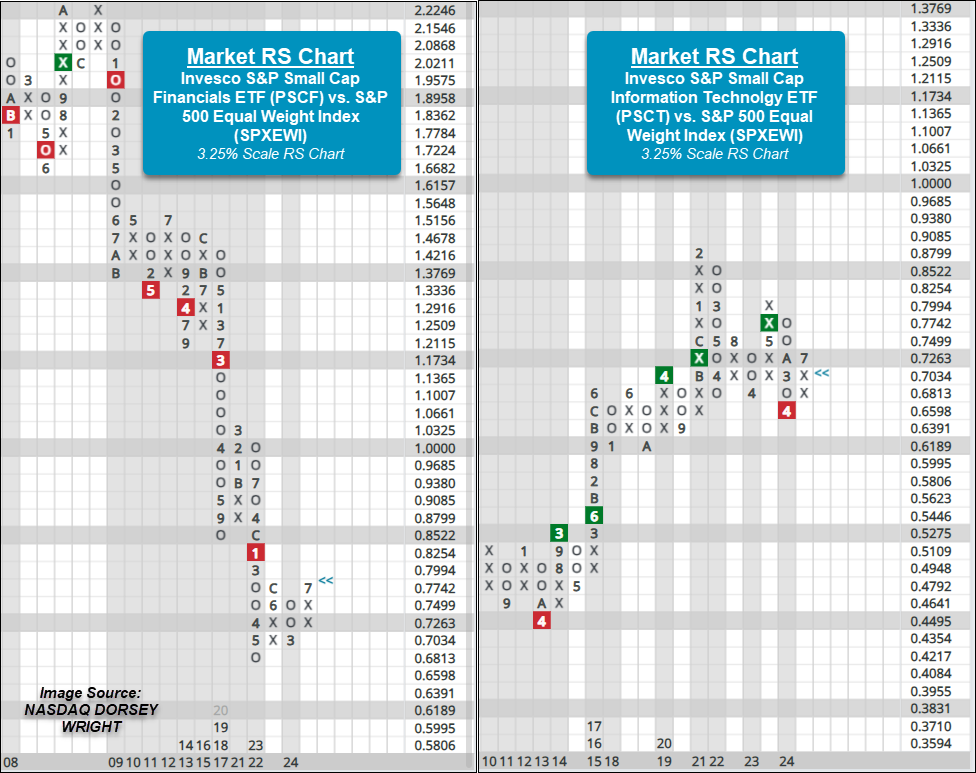
Within the Invesco small cap sector ETF lineup four sectors have exhibited or recently seen a change in near-term relative strength against the S&P 500 Equal Weight Index SPXEWI.
The two small cap sector ETFs that have seen recent changes to near-term RS are Financials PSCF and Technology PSCT as both reversed into Xs on their market RS charts during last week’s trading. Before the reversals back in Xs, Financials had been in Os since March this year while Technology had been in Os since December last year. While each ETF still resides on an RS sell signal, favoring the SPXEWI in the long term, recent action has brought the market RS chart of PSCF to within one box of an RS buy signal. Both ETFs possess acceptable fund scores with Financials PSCF registering its highest score since late-2016 at 4.61. PSCF currently trades at a multi-year high and in overbought territory, so those seeking exposure to the ETF are best served looking for price normalization at current levels or a pullback before adding. After reaching a multi-year high early last week at $51(one box below the all-time chart high), PSCT pulled back to $48.50 and actionable territory on the chart.
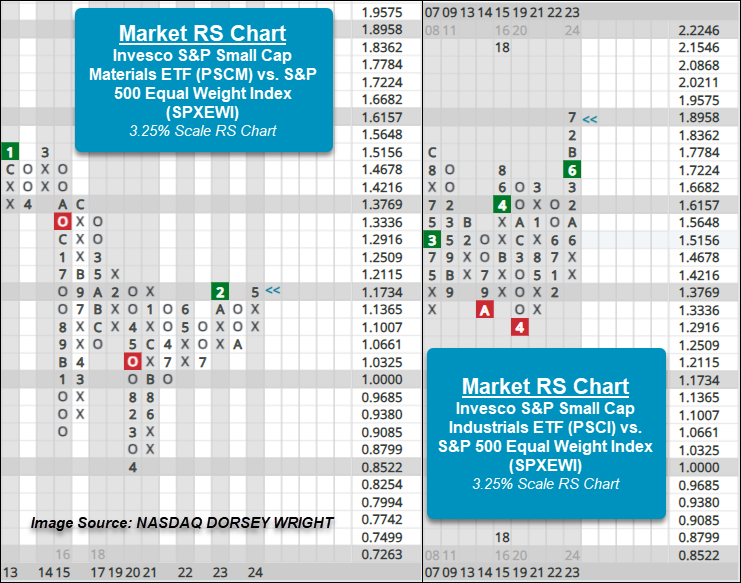
Industrials PSCI and Materials PSCM are the two additional small cap sector funds showing positive near-term market RS. Each ETF has also maintained a market RS buy signal, showing positive long-term RS, and traded in a positive trend on the default trend charts since 2023. The funds possess strong scores near 5.5 and currently trade at all-time chart highs. PSCI returned to a buy signal last week by completing a shakeout pattern while PSCM has maintained a buy signal since December last year. Those seeking exposure to PSCI may look to add on a pullback to the mid-$120s, while PSCM is actionable at current levels.