
Home Construction has seen a notable bump in breadth, which bodes well for future performance.
The home construction group has rallied to new highs following softer than anticipated CPI data and strong earnings from the largest home builder D.R. Horton (DHI). In the last two weeks, the bullish percent for the home construction group has increased from 32% to 84%. Movements of that magnitude are quite rare, with only three years since 1995 in which the Bullish Percent added fifty percentage points in two weeks: 2008, 2019, and 2020. Even gains of forty percentage points are uncommon, as there have only been eight other years with such instances.
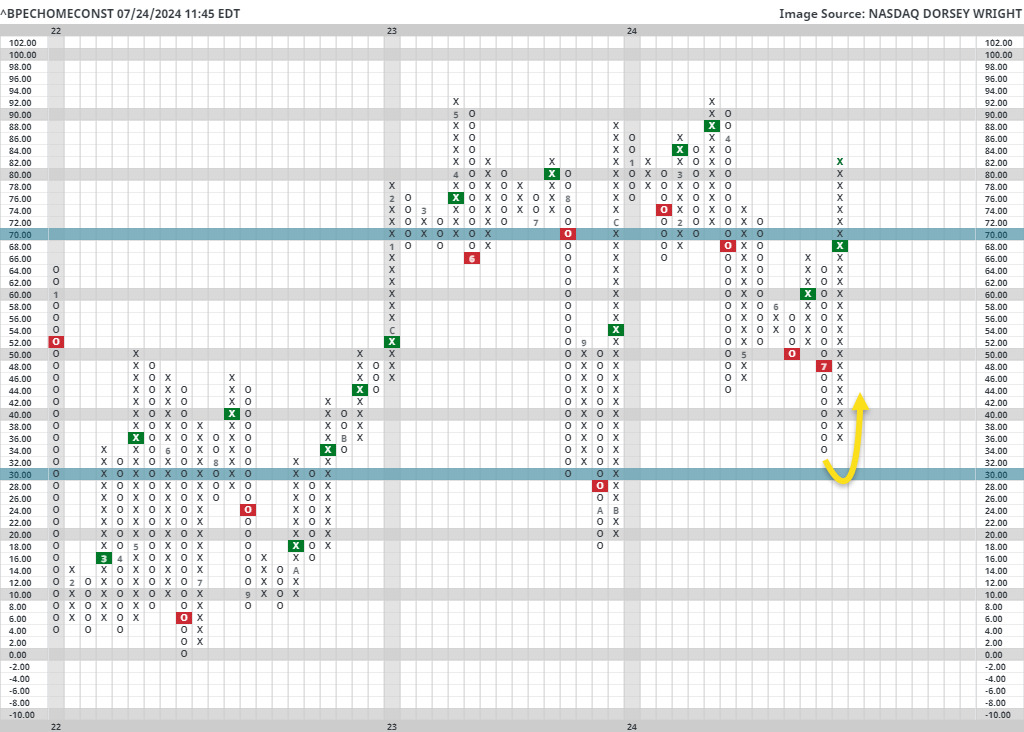
Home construction is considered a leading indicator, meaning its performance often precedes the overall economy. Consequently, we might expect increasing participation from homebuilders to foreshadow a strengthening market. Looking at forward returns when the Bullish Percent for Home Construction adds forty percentage points in two weeks, we find that the S&P 500 experiences above average returns, especially ninety days forward, as seen in the table below. Specifically, the market is up almost 90% of the time three months out, with average returns of 9.1%.
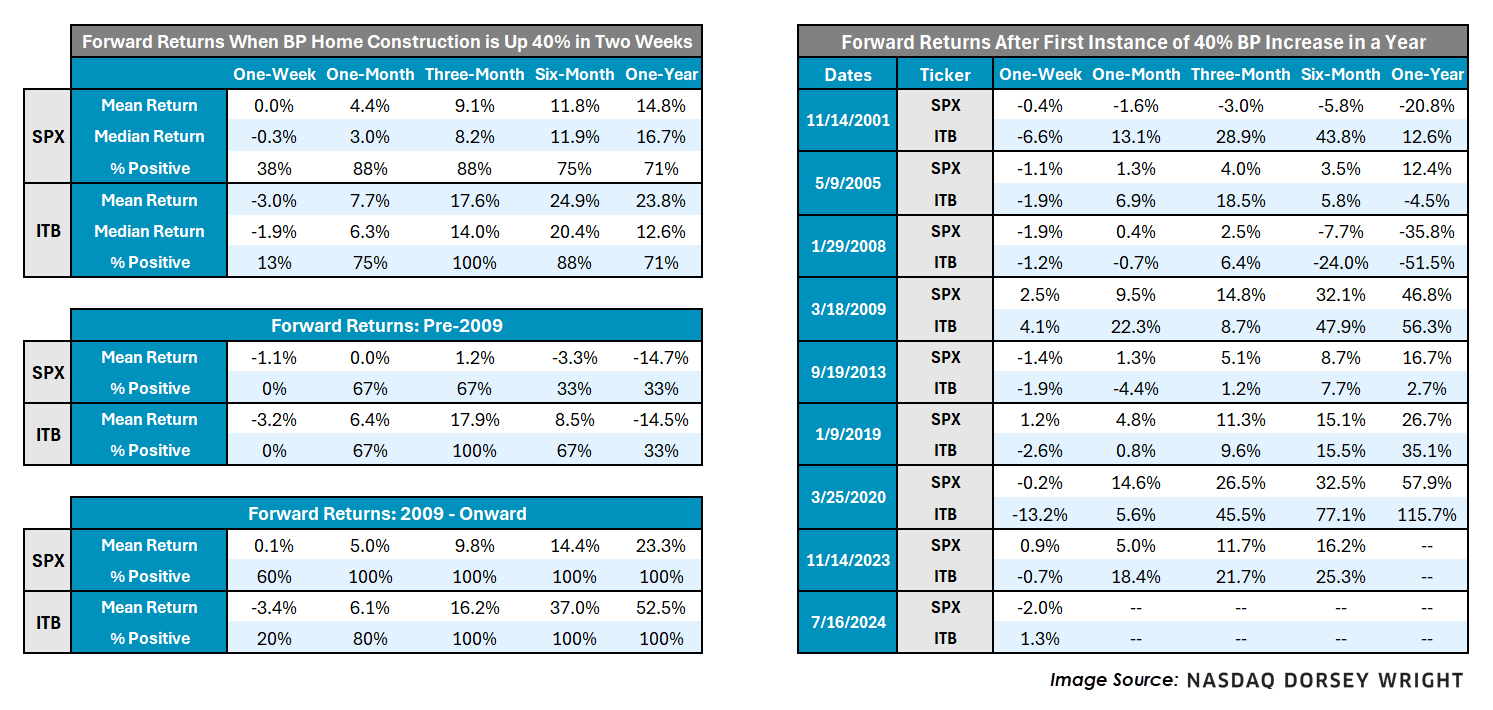
Arguably the most significant instance of a forty percentage point BP gain came in 2008, which saw a market decline of over 35% a year later, but more recent returns look quite different from before the financial crisis. Following BP gains of forty percentage points since the recession began to cool in 2009, the average one-year forward SPX return is 23.3%, the minimum one-year return is 16.7%, and 100% of instances saw positive returns after one month. Forward returns are even stronger for iShares U.S. Home Construction ETF (ITB), as the average one-year forward return is 24% – even including 2008. Most notably, three-month forward returns have been positive for ITB after every instance, averaging a 17.6% return. Since 2009, ITB’s performance has been even more impressive, with an average one-year forward return of 52%. In general, significant increases in home construction breath has been a positive sign for future performance.
That said, returns are highly volatile across all periods following those forty percentage point BP gains, and include the seismic drawdown of 2008. After said BP gains, the standard deviation of SPX one-year forward returns is 34%, around double the average of 17% for SPX since 1995. Returns are also skewed by the momentous performance following the COVID-19 plummet in March of 2020, so take performance numbers with a grain of salt.
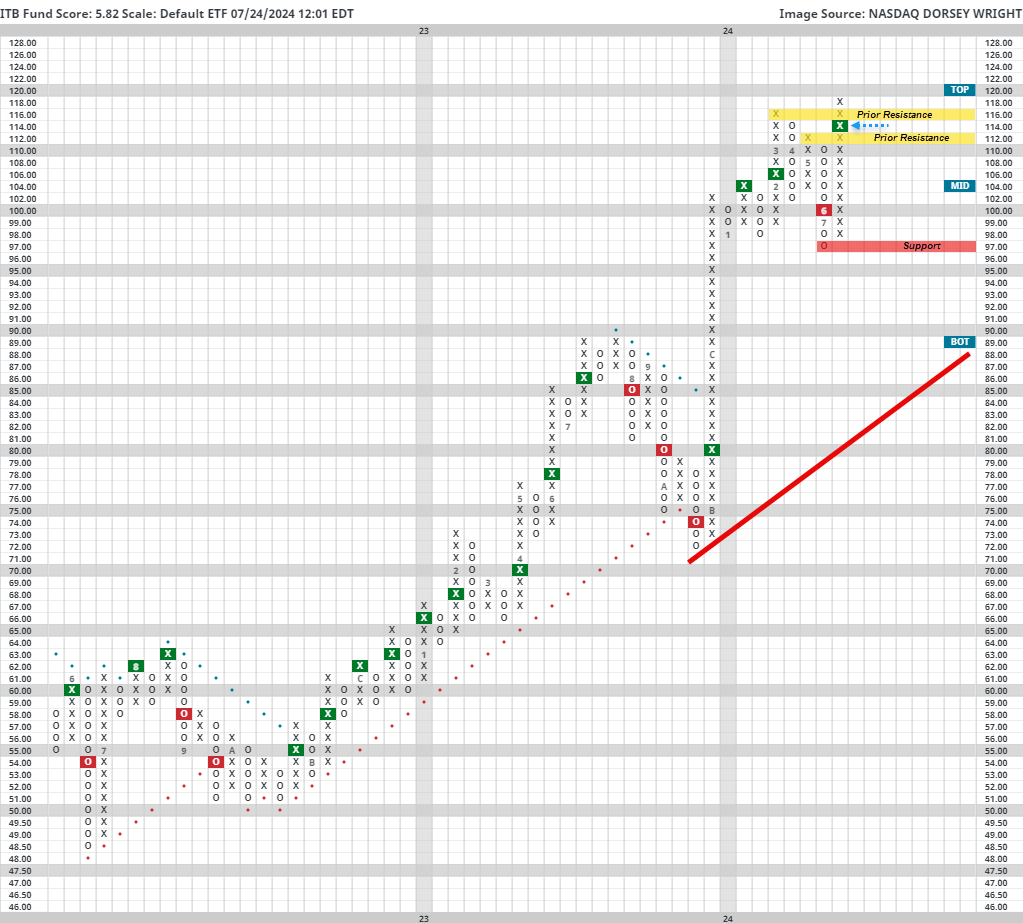
Regardless, ITB is a strong name to consider, carrying a near-perfect 5.82 fund score, recently breaking through all previous resistance to return to a buy signal. Additionally, the homebuilding group sits at first place in the group sector matrix rankings and has remained at the top spot since November of last year. Support does not start until $97, but prior resistance lies higher at $116 and $112, which can now be thought of as future support. However, those looking to add exposure should note the fund’s slightly overbought (OBOS) reading above 60%, as well as the potential for increased market volatility, if past trends persist.
