
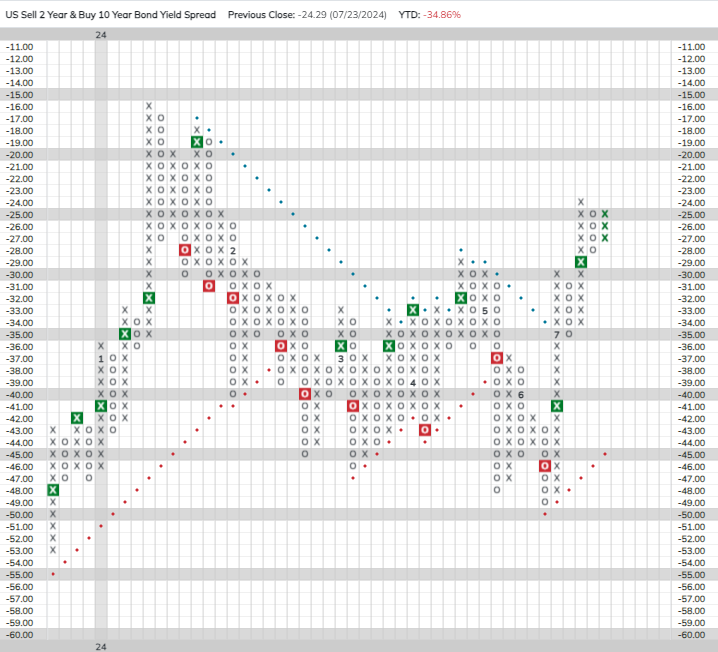
The Treasury yield curve has steepened recently as intermediate-term yields have fallen faster than long-term yields. The two-year/10-year spread is now the least inverted it has been since February.
Weekly Fixed Income Update Video (2:13)
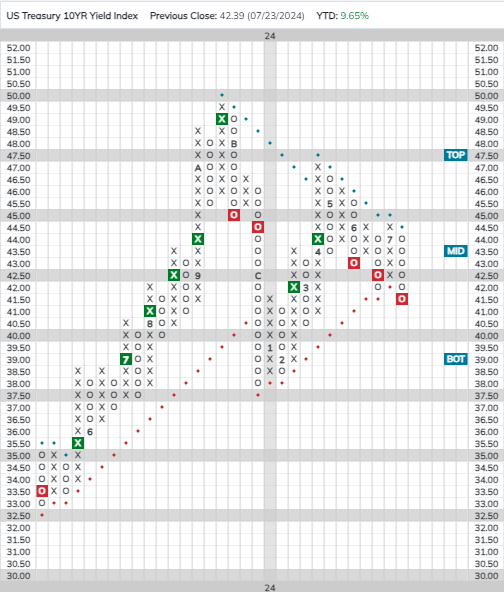
The 10-year US Treasury Yield Index (TNX) gave a third consecutive sell signal and violated its trend line last week, putting it back in a negative trend for the first time since April.
The Treasury yield curve has steepened recently as intermediate-term yields have fallen faster than long-term yields. The two-year/10-year spread is now the least inverted it has been since February. Long duration fixed income currently ranks above short-duration in the Asset Class Group Scores (ACGS) fixed income rankings, but with long-terms yields appearing to be more buoyant, short-term bonds currently may offer the better risk-reward profile.
The fed futures market is now pricing in a 100% chance of a September rate cut. On Friday, we’ll get our last look at inflation ahead of the Fed’s July meeting when the June PCE report is released. Assuming no uptick in inflation, FOMC members could use this meeting to signal their intent to lower rates in September.
The inverse fixed income group now has a -1.76 score direction, the second lowest score direction of all 134 groups in the ACGS system. The inverse group’s deeply negative score direction speaks to the recent improvement in the US fixed income market; however, many US core groups still sport less-than-ideal fund scores. Other than this, the fixed income rankings look largely the same as they did a week ago.
