Most Requested Symbols

Join us in Nashville this October!
France saw notable declines in June but has held steady since despite a fluctuating political environment.
The curve has an average reading of 25.15%.
Today's featured stock is The Trade Desk Inc (TTD).
CVNA, EAT, MA, NEM, and PSTG.
Call: Occidental Petroleum Corporation (OXY), Put: Shopify Inc (SHOP), Covered Write: Micron Technology, Inc. (MU)
NDW Morning Update Video - July 11, 2024
NDW Morning Update Video – July 11, 2024.
Click here to download MP3
Curious as to where the "Weight of the Evidence" stacks up across asset classes to start the second quarter? Check out NDW's update for Q2 2024, discussing where markets stand to open the back half of 2024, linked HERE
Weekly Momentum Update Video (2:27)
Weekly Size and Style Update Video (4:13)
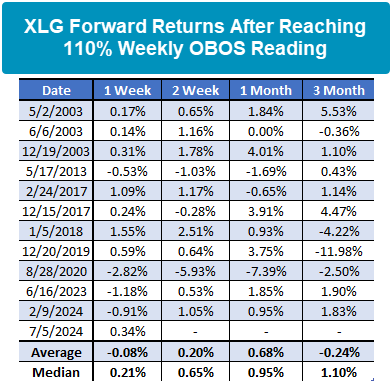
While the broad market stagnated in the second quarter, the mega caps continued to do well. The Invesco S&P 500 Top 50 ETF (XLG) gained 8.59% while the S&P 500 Equal Weight Index (SPXEWI) declined 3.09% in the second quarter. The strong performance by XLG has put it into heavily overbought territory with a weekly overbought/oversold reading of 117%. Going back to 2002, this is the 12th time XLG has reached the 110% overbought threshold. On average, returns are muted over the next three months while median returns are more positive. The average returns were driven down by a few occurrences, including January 2018, December 2019, and August 2020. In the context of today’s poor breadth, a slowdown in the mega caps could signal worse returns for the market. Overall, there isn’t much to suggest outsized returns in either direction when XLG becomes this overbought, but the main takeaway is that returns may level off over the next couple of months.


We’re pleased to announce that registration is open for Catapult 2024 presented by Nasdaq Dorsey Wright in Nashville from October 15-17. Register now to take advantage of early-bird pricing!
Join us at our revitalized fall conference for 3 days of in-depth sessions that will help you strengthen your business with scalable, repeatable processes and a clear value proposition for your clients.
Attendees will have the opportunity to hear from different members of the NDW team, including our portfolio managers and research analysts. We will also be joined be special guest speakers, including Phil Mackintosh, Head Economist at Nasdaq, Ryan Issaskainen, Senior VP & ETF Strategist at First Trust, and others!
You’ll learn:
Bringing someone from your office? Contact us for group discounts!
We look forward to seeing you!
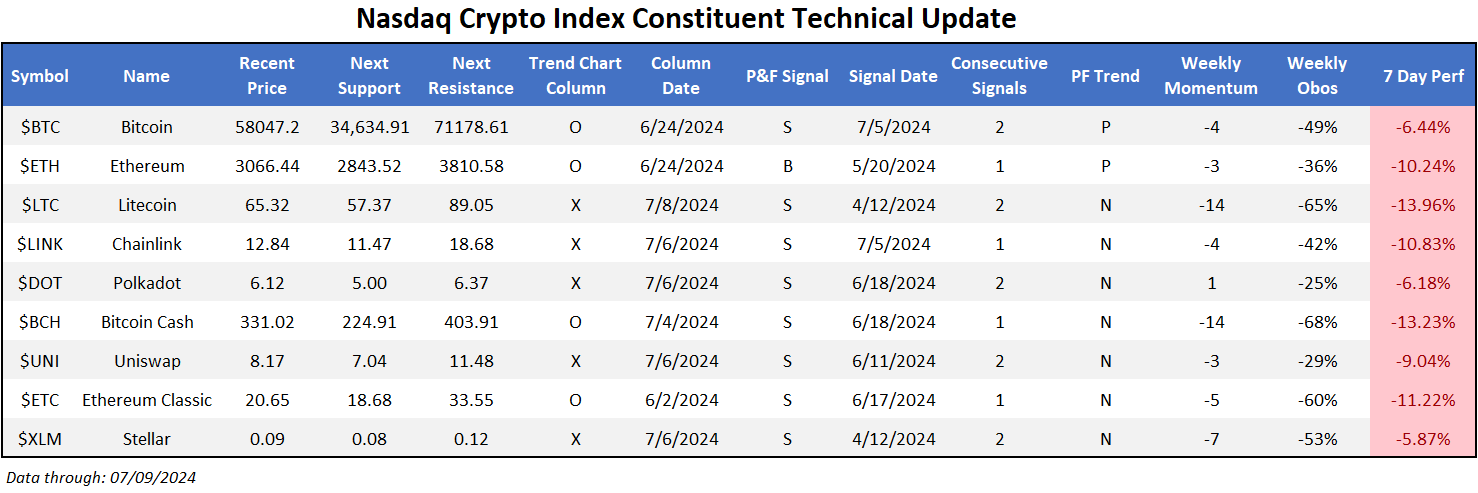
The broad crypto space finds itself in a bit of a tough position to open the back half of the year. Each coin within the Nasdaq Crypto Index (.NCI) moved lower over the last seven days, with some larger names falling as much as 15%. Previous reports have called for the need for extreme caution within the space as participation has been hard to come by- an idea present in today’s writeup as several coins break through more support on their default chart. Bitcoin moved back below what we have established as a key $60,000 mark for the second time in the last few months, posting a pair of consecutive sell signals for the first time since late 2022. While the last 24 hours have seen it rally back up towards that mark, the overall PnF picture is less than encouraging around current levels. Pair this with a recent return to a sell signal against cash proxy MNYMKT on a 5% relative strength chart, there is an argument to be had that Bitcoin has put in a top for now. The relative strength chart (pictured below) “tends to trend” with signals typically leading to more of that same type. While Bitcoin has certainly given headfakes before, price action today is presenting a picture increasingly difficult to defend.
While exposure to Bitcoin alone may not be an option for many investors, crypto-focused equities may be an option some have looked towards during the last year’s rally. COIN may have been an option due to its correlation with Bitcoin. While it is a 5/5’er, a quick look at a 5-point chart reveals what seems to be the bottom of a key range towards $200. If we do see continued deterioration for the crypto space, continue to watch relevant support levels for those equity positions you may have initiated as a crypto play during 2023’s rally. While a move past $200 may not lead to a fall into “unactionable” territory for the name from a technical attribute standpoint, it would act as confirmation that things are slowing down for the space.

Each week the analysts at NDW review and comment on all major asset classes in the global markets. Shown below is the summary or snapshot of the primary technical indicators we follow for multiple areas. Should there be changes mid-week we will certainly bring these to your attention via the report.
| Universe | BP Col & Level (actual) | BP Rev Level | PT Col & Level (actual) | PT Rev Level | HiLo Col & Level (actual) | HiLo Rev Level | 10 Week Col & Level (actual) | 10 Week Rev Level | 30 Week Col & Level (actual) | 30 Week Rev Level |
|---|---|---|---|---|---|---|---|---|---|---|
| ALL |
|
44% |
|
34% |
|
40% |
|
40% |
|
46% |
| NYSE |
|
54% |
|
58% |
|
58% |
|
42% |
|
54% |
| OTC |
|
40% |
|
28% |
|
34% |
|
40% |
|
42% |
| World |
|
46% |
|
38% |
|
|
|
44% |
|
50% |
Check out this week's Major Index and DALI Overview (3:06).
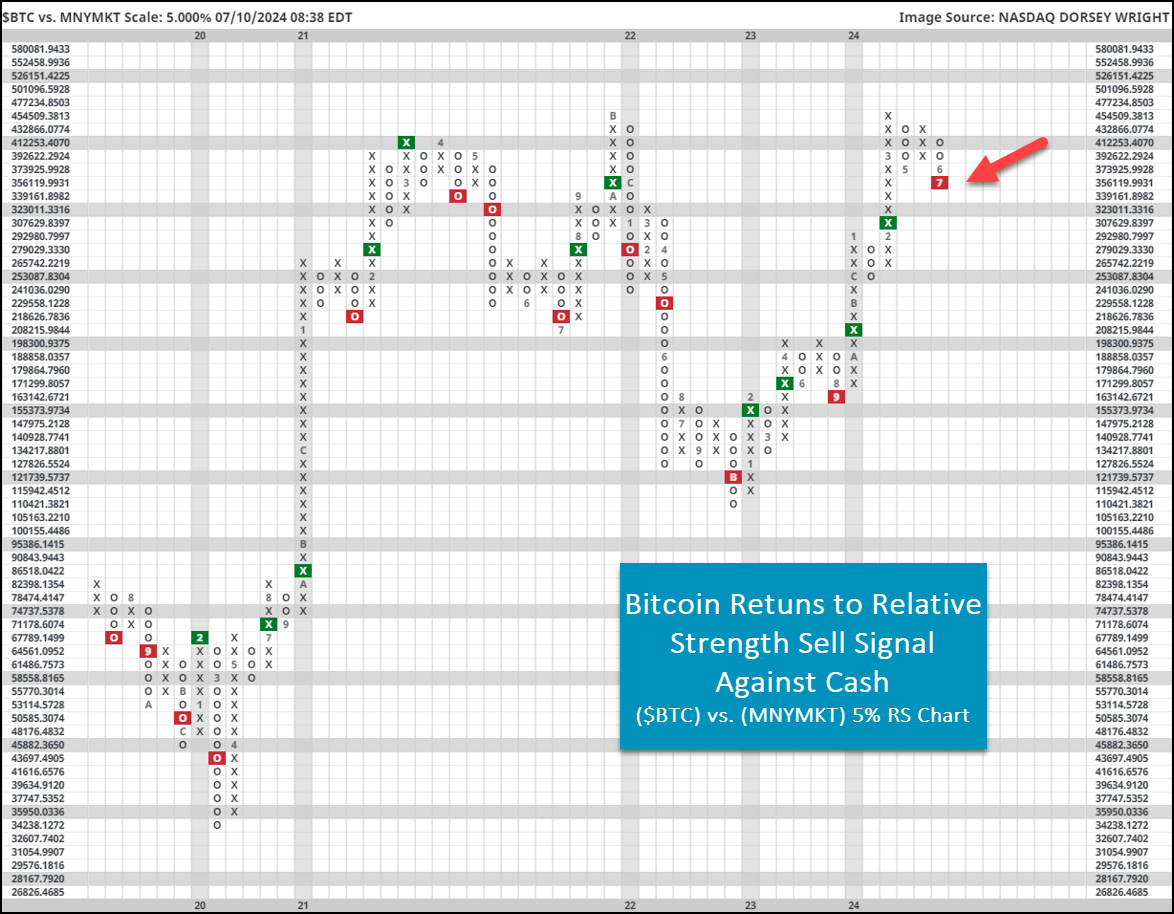
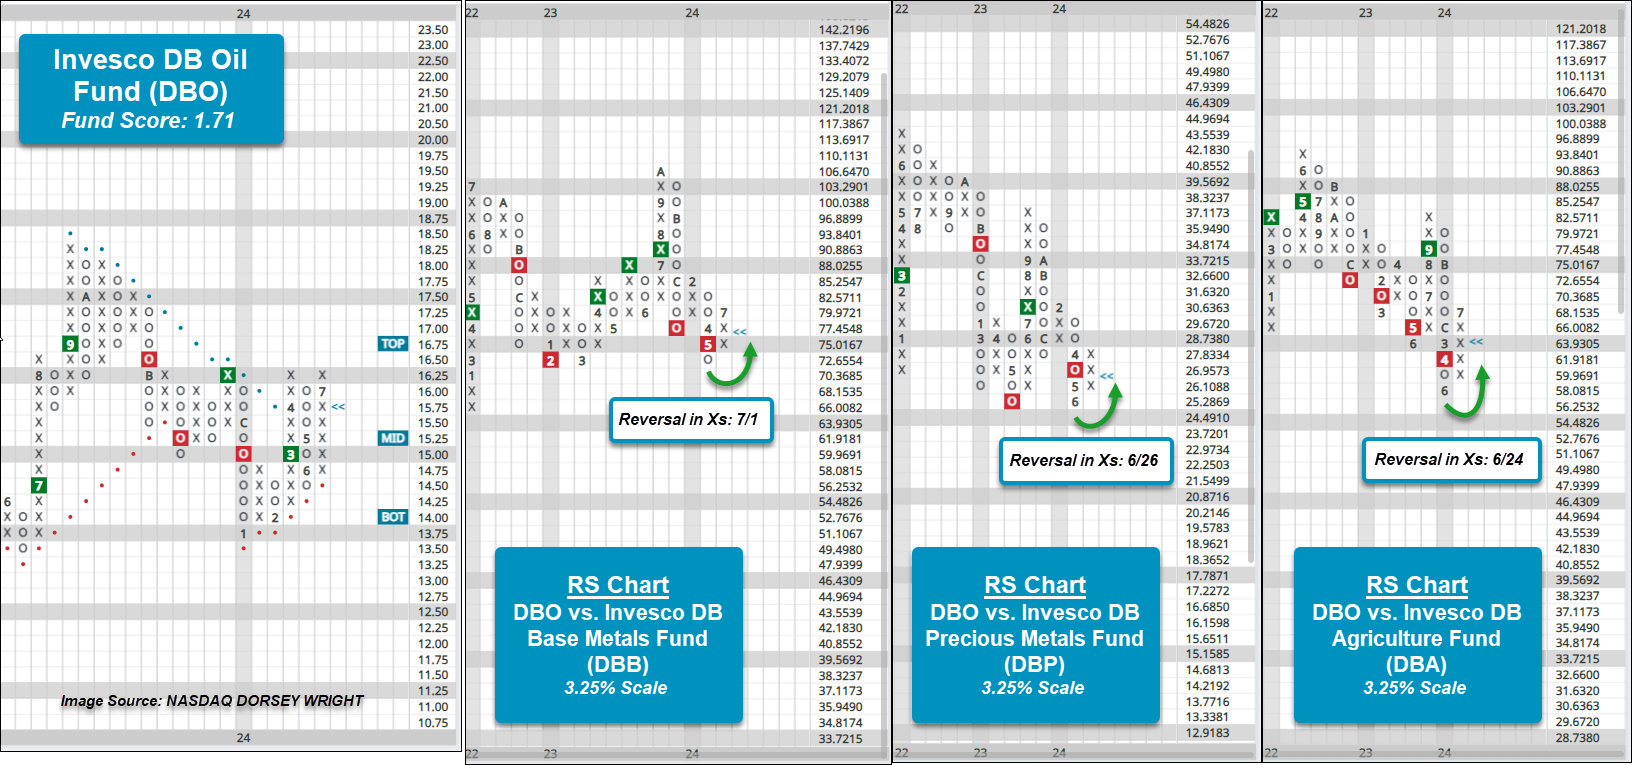
There haven’t been many changes to the DALI rankings since International Equities fell below Commodities to cause a shakeup in the upper half of the asset class rankings, but that doesn't mean there hasn’t been action transpiring under the hood. Within commodities, Energy has been a relative laggard against its counterparts in the asset class since April, but since early June, crude oil CL/ has seen improvement on its trend chart. Through the short time in July, crude is roughly flat for the month, which follows up 5.91% in June to have the commodity wrap Q2 down roughly 2%. This positive near action has again brought crude up from support in the lower-$70s to resistance in the mid-$80s. Over the past two years, the trading range that crude has traded in has only gotten tighter in 2024 – going from a range in the mid-$60s to mid-$90s in the latter part of 2022 through 2023 to the lower-$70s to mid-$80s now.
Crude’s recent improvement has provided some relative improvement within the DALI Commodity level, but precious and base metals possess the bulk of the total buy signals for the broader asset class. The RS charts below feature the Invesco DB Oil Fund DBO against the Invesco DB Base Metals DBB, Precious Metals DBP, and Agriculture DBA funds on a 3.25% scale chart. Though each chart still maintains an RS Sell signal, showing long-term weakness relative to other areas within commodities, each RS chart has moved back into a column of Xs within the past couple of weeks. Crude, and subsequently DBO’s improvement, has been enough to signal some near-term outperformance, but with crude (and DBO) both rallying to key resistance levels it will be intriguing to see what develops from here.
If crude is unable to move through current resistance, then the recent relative improvement is likely to wane. But a move past resistance – along with potentially other commodity counterparts pulling back or deteriorating – would provide potential fodder for further relative improvements. Until then, crude and other individual energy commodities continue to yield not much more than a short term trade. Those who may seek to monitor crude’s chart could set price or activity alerts for potential breakouts (and/or breakdowns).

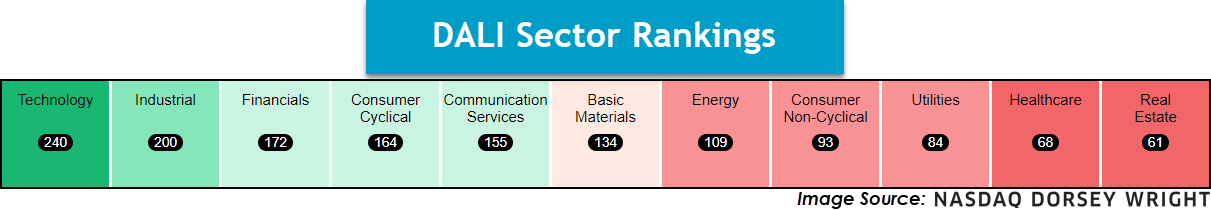
The past week saw no significant technical developments in the Technology, Industrial, Basic Materials, Energy, Utilities, Healthcare, or Real Estate Sectors. Those that saw noteworthy movement are included below, in order of their relative strength ranking in the DALI domestic equity sector rankings. Sector designations are based on DALI sector rankings and are as follows: 1 - 3 overweight, 4 - 7 equal-weight, and 8 - 11 underweight.
Financials – Overweight
Weekly Financials Video (3:10)
There haven’t been many, if any, major developments in the financials sector in the past week. However, big banks begin announcing earnings on Friday with JP Morgan (JPM), Wells Fargo (WFC), and Citigroup (C) as headliners. Like the rest of the market, strength in the sector resides in most of the largest names, so earnings on Friday will likely be amplified given the lack of strength elsewhere.
Consumer Discretionary – Equal Weight
Weekly Consumer Cyclical Video (3:54)
Discretionary stocks were positive over this past one week roll with XLY adding 1.8%. Tesla TSLA was a major contributor after surpassing Wall Street’s estimates for the companies Q2 deliveries. TJX and AMZN were also notable as they rallied to new chart highs. The Building subsector falls into the crosshairs again after ITB break through 2024 support on the trend chart. The positive trend (PT) and bullish percent (BP) indicators for the subsector also fell lower this week, though they still raise above their 2023 lows. Earnings begin for the broader sector this week with Delta DAL reporting on Thursday.
Communication Services – Equal Weight
Weekly Communication Services Video (2:55)
Communication Services remains in firm equal weight status to open the back half of the year as the space is led higher by tech focused names. META and NFLX posted buy signals on its default chart, while CHTR ran into some logical resistance on its default chart. Continue to add to larger names in the sector on logical pullbacks, and trim when possible for other technically weak options.
Consumer Staples – Underweight
Weekly Consumer Staples Video (1:52)
The consumer staples sector continues to rank low in DALI. Just 33% of non-cyclical stocks are in a relative strength column of X's (i.e., showing near-term outperformance) against the market, which is among the lowest levels in the past 20 years. Individual stock selection remains key and SFM is a name to consider.
International Equity Video Update - (3:09)
The tale of the tape between emerging and developed market international equities has shown increased dispersion over the past few weeks. Some focused emerging markets have climbed notably higher, including India (INDA), Taiwan (EWT), and South Korea (EWY). Each of these representatives have gained at least 5% over the last month, helping the broader emerging markets representative EEM climb to another double top formation last week.
Meanwhile, developed markets have not been so lucky, with weakness from France leading the charge lower. France held the second round of their National Assembly elections last weekend, which led to some surprising results. Before diving into the results and their implications, we will provide some background on the elections.
The French National Assembly can be viewed similarly to the House of Representatives in the US, and is one of the two parts of the French Parliament, alongside the French Senate. The French National Assembly elections use a two-round system. In the first round, any candidate who receives the votes of more than 12.5% of registered voters advances to the second round. If no candidate meets this threshold, the two candidates with the highest number of votes advance to the second round. In the second round, the candidate with the most votes is elected.
This all started earlier in June, after French President Emmanuel Macron dissolved parliament and called a surprise snap election after the far-right National Rally party gained more than double the votes of his centrist Renaissance party in the European Union parliamentary elections. That result and the subsequent snap-election announcement led to major selloffs across French equities. French investors, just like their domestic counterparts, do not respond well to uncertainty. The iShares MSCI France ETF EWQ fell from an all-time high of $42.50 down to support at $37.50, moving to a sell signal in the process. This support level from January is also near the consolidation point that EWQ experienced from May through August of 2023. We saw this same territory act as notable support as EWQ consolidated from all-time highs back in 2021. This would not add any significance to the support from a point and figure perspective, but the previous importance of this price point does raise its broader technical notoriety.
Leading up to the first round of the snap election on Sunday, June 30, EWQ held support and rebounded from an oversold position to the current chart level of $39. After the first round of the National Assembly election was completed last Sunday (6/30), the far-right National Rally party seemed poised to take over as the leading party for the first time in the country’s post-World War II electoral history. That did not have any technical impact on EWQ, as the default chart remained unchanged. In the second round of elections that took place on Sunday (7/7), the National Rally party ultimately fell into the third largest contingent, surprisingly falling behind left-wing and centrist parties. Again, we saw no change to the default chart of EWQ, it still sits at the $39 chart level reached on June 24.
The increased uncertainty across France led to a deterioration in the technical picture for EWQ, as the fund score dropped from an optimal level north of 4.00 to the current position at 2.86. However, we did not see the technical picture change during the “peak” uncertainty in France stemming from their snap-elections over the past two weeks. The political uncertainty in France did not produce as much relative strength deterioration as we saw from recent elections in other countries, like Mexico. We will undoubtedly see further headlines from France in the coming weeks, especially with the Summer Olympics kicking off in Paris at the end of this month. If the support at $37.50 continues to hold, France could be an interesting area to look toward for a potential rebound in the second half of the year. On the other hand, if that support level is violated, we could be looking at a potential test of the positive trend line that has been in place since November 2022.

Weekly Fixed Income Update Video (2:50)
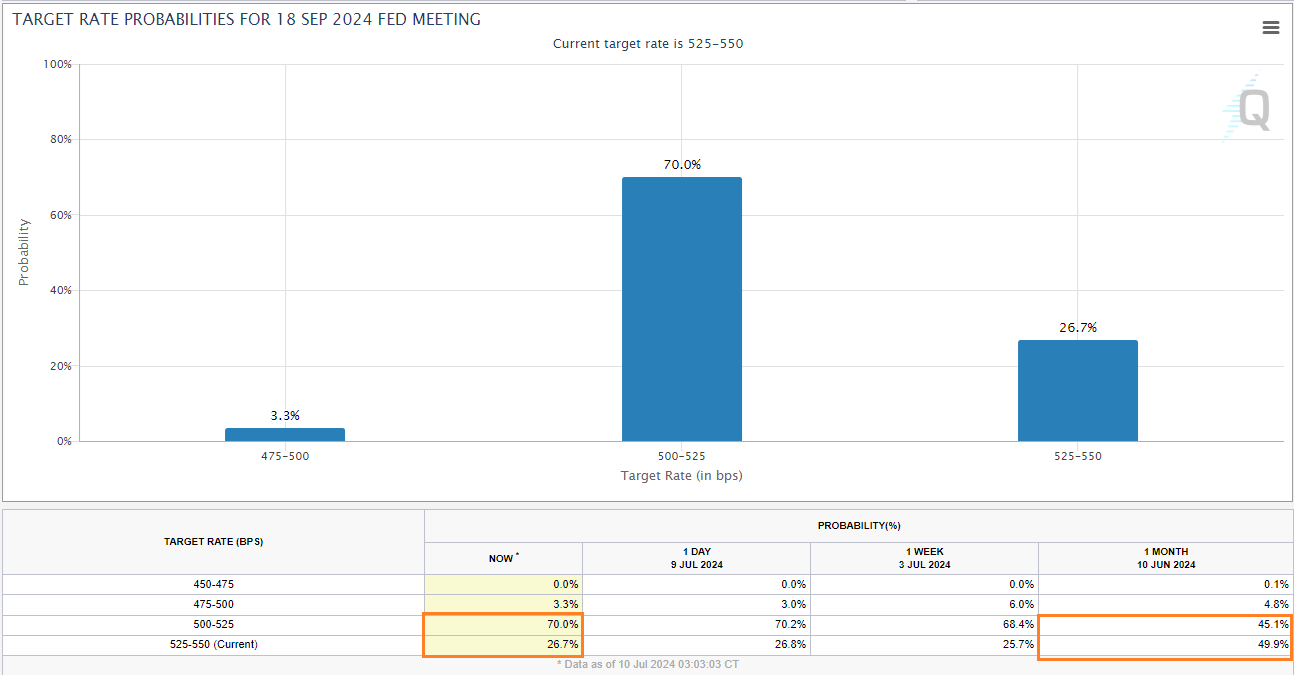
US Treasury yields were down over the last week and the US Treasury 10-year Yield Index (TNX) remains on two consecutive sell signals but has thus far maintained its positive trend. The June jobs report released last Friday showed that the unemployment rate had ticked up to 4.1%, raising expectations that the Fed will cut rates.
The fed futures market is now pricing in a better than 70% chance of a 25 bps cut at the September meeting. A month ago, those odds stood at right around 50%. The market is also pricing in a better than 70% chance of two rates cuts by the end of the year.
Although most areas of relative strength within fixed income remain outside the core, over the last few weeks we have seen improvement in some core groups. US Government-Agency is on the verge of crossing above the 3.0 score threshold for the first time since January. While investment grade corporates and general bond-long groups have crossed above the 2.5 threshold.

If the market continues to expect easing from the Fed, putting downward pressure on long-term rates, we are likely to see to see these groups continue to improve. We’ll get our next look at inflation on Thursday with the release of the CPI report. Another downtick in inflation would bolster the case for the Fed to lower rates.
Remember, these are technical comments only. Just as you must be aware of fundamental data for the stocks we recommend based on technical criteria in the report, so too must you be aware of important data regarding delivery, market moving government releases, and other factors that may influence commodity pricing. We try to limit our technical comments to the most actively traded contracts in advance of delivery, but some contracts trade actively right up to delivery while others taper off well in advance. Be sure you check your dates before trading these contracts. For questions regarding this section or additional coverage of commodities email will.gibson@nasdaq.com.
Data represented in the table below is through 7/9/2024:
Broad Market Commodities Report
| Symbol | Name | Price | PnF Trend | RS Signal | RS Col. | 200 Day MA | Weekly Mom |
|---|---|---|---|---|---|---|---|
| CL/ | Crude Oil Continuous | 81.41 | Positive | Buy | X | 79.25 | + 4W |
| DBLCIX | Deutsche Bank Liquid Commodities Index | 482.71 | Positive | Sell | O | 483.51 | + 2W |
| DWACOMMOD | DWA Continuous Commodity Index | 877.63 | Positive | Buy | O | 829.44 | - 5W |
| GC/ | Gold Continuous | 2360.10 | Positive | Buy | X | 2127.42 | + 1W |
| HG/ | Copper Continuous | 4.58 | Positive | Buy | X | 4.05 | - 7W |
| ZG/ | Corn (Electronic Day Session) Continuous | 394.00 | Negative | Sell | O | 452.56 | - 6W |
Weekly Commodities Video (2:32)
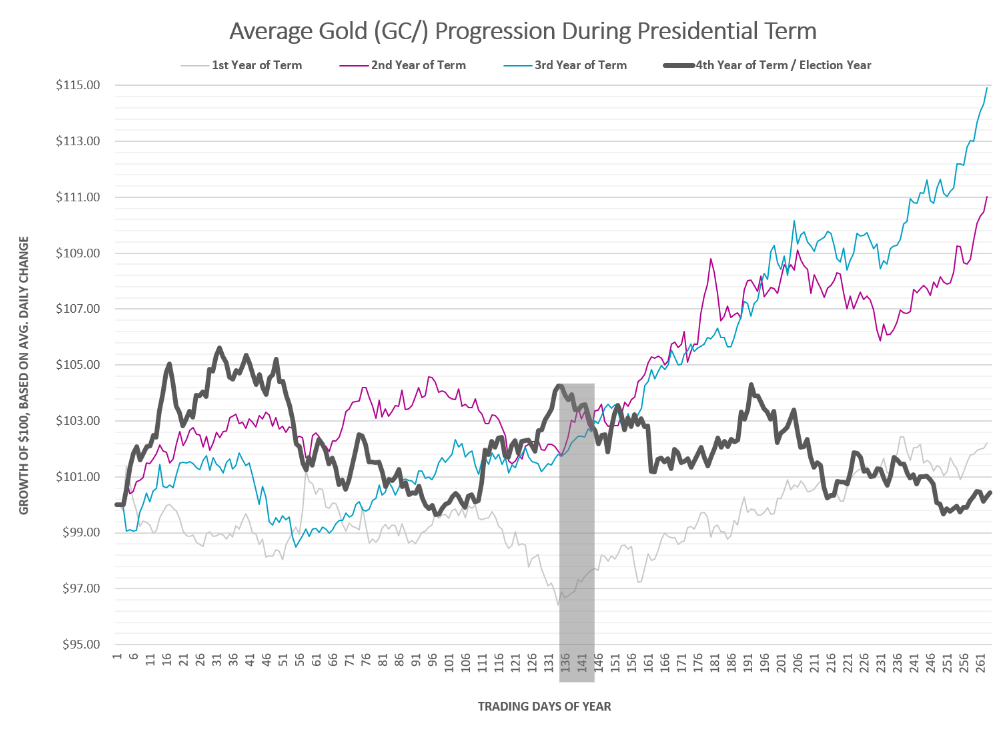
Gold boasts a 14% year-to-date (YTD) gain, but the precious metal has been consolidating since April. In fact, all of gold’s YTD return came between February 20th and April 12th.
We know that fear and real yields are common catalysts for gold, and are often intertwined. Since mid-April interest rates have gone virtually nowhere, inflation data has been relatively flat/down, and the major equity benchmarks have been drifting to all-time highs. Additionally, geopolitical headlines have been fewer and further between…a recipe for sluggish gold behavior.
That said, should any of those variables change gold could have a meaningful breakout – whether it be to the upside or downside.

What about the US presidential election? While certainly a potential catalyst for a gold breakout, history suggests it would be to the downside…which is perhaps a surprise. Markets are forward-looking, so maybe investors front run here too?
The progression chart below graphs the average change for gold continuous (GC/) each day, and then separates each into term year. The thick, black line below is the average progression during the fourth year of a president’s term/election year. We are about 140 days in currently.
Average Level
25.15
| < - -100 | -100 - -80 | -80 - -60 | -60 - -40 | -40 - -20 | -20 - 0 | 0 - 20 | 20 - 40 | 40 - 60 | 60 - 80 | 80 - 100 | 100 - > |
|---|---|---|---|---|---|---|---|---|---|---|---|
|
Buy signalVOOV
|
|||||||||||
|
Buy signalrsp
|
Buy signallqd
|
||||||||||
|
Sell signaliwm
|
Buy signalgld
|
Sell signalagg
|
|||||||||
|
Buy signalefa
|
Sell signalfxe
|
Buy signalief
|
Buy signalQQQ
|
||||||||
|
Buy signalIJH
|
Buy signalgcc
|
Sell signaltlt
|
Sell signalicf
|
Buy signalONEQ
|
|||||||
|
Buy signalijr
|
Buy signalgsg
|
Buy signaldia
|
Buy signalshy
|
Buy signalVOOG
|
|||||||
|
Buy signaldvy
|
Buy signaldx/y
|
Buy signalhyg
|
Buy signalUSO
|
Buy signaleem
|
Buy signalSPY
|
Buy signalXLG
|
|||||
| < - -100 | -100 - -80 | -80 - -60 | -60 - -40 | -40 - -20 | -20 - 0 | 0 - 20 | 20 - 40 | 40 - 60 | 60 - 80 | 80 - 100 | 100 - > |
| AGG | iShares US Core Bond ETF |
| USO | United States Oil Fund |
| DIA | SPDR Dow Jones Industrial Average ETF |
| DVY | iShares Dow Jones Select Dividend Index ETF |
| DX/Y | NYCE U.S.Dollar Index Spot |
| EFA | iShares MSCI EAFE ETF |
| FXE | Invesco CurrencyShares Euro Trust |
| GLD | SPDR Gold Trust |
| GSG | iShares S&P GSCI Commodity-Indexed Trust |
| HYG | iShares iBoxx $ High Yield Corporate Bond ETF |
| ICF | iShares Cohen & Steers Realty ETF |
| IEF | iShares Barclays 7-10 Yr. Tres. Bond ETF |
| LQD | iShares iBoxx $ Investment Grade Corp. Bond ETF |
| IJH | iShares S&P 400 MidCap Index Fund |
| ONEQ | Fidelity Nasdaq Composite Index Track |
| QQQ | Invesco QQQ Trust |
| RSP | Invesco S&P 500 Equal Weight ETF |
| IWM | iShares Russell 2000 Index ETF |
| SHY | iShares Barclays 1-3 Year Tres. Bond ETF |
| IJR | iShares S&P 600 SmallCap Index Fund |
| SPY | SPDR S&P 500 Index ETF Trust |
| TLT | iShares Barclays 20+ Year Treasury Bond ETF |
| GCC | WisdomTree Continuous Commodity Index Fund |
| VOOG | Vanguard S&P 500 Growth ETF |
| VOOV | Vanguard S&P 500 Value ETF |
| EEM | iShares MSCI Emerging Markets ETF |
| XLG | Invesco S&P 500 Top 50 ETF |
| Symbol | Company | Sector | Current Price | Action Price | Target | Stop | Notes |
|---|---|---|---|---|---|---|---|
| KRG | Kite Realty Group Trust | Real Estate | $21.76 | 19 - 21 | 34.50 | 16 | 5 for 5'er, 11 of 113 in REAL sector matrix, LT pos mkt RS, spread quintuple top, 4.65% yield, Earn. 7/30 |
| CCEP | Coca-Cola Europacific Partners PLC | Food Beverages/Soap | $72.22 | 60s | 97 | 56 | 5 for 5'er, top 25% of FOOD sector matrix, spread quad top, R-R~3.0, 3% yield |
| BAH | Booz Allen Hamilton Holding | Business Products | $154.39 | 140s | 193 | 114 | 5 for 5'er, top 25% of favored BUSI sector matrix, LT pos peer RS, pullback from ATH, 1.5% yield, Earn. 7/26 |
| LIN | Linde Plc | Chemicals | $431.20 | hi 410s - lo 460s | 572 | 360 | 5 TA rating, consec. buy signals, LT RS buy, buy-on-pullback |
| LPLA | LPL Investment Holdings Inc | Wall Street | $273.22 | hi 250s - lo 280s | 348 | 228 | 5 TA rating, top half FINA sector matrix, LT RS buy, consec. buy signals, recent pos. wkly. mom., Earn. 7/25 |
| HLI | Houlihan Lokey Inc | Banks | $135.02 | 120s - low 130s | 177 | 110 | 5 for 5'er, 14 of 122 in BANK sector matrix, LT pos mkt RS, spread triple top, R-R>2.0, 1.6% yield, Earn. 7/25 |
| AFL | AFLAC Incorporated | Insurance | $88.93 | 80s | 103 | 75 | 5 for 5'er, favored INSU sector matrix, spread triple top, 2.3% yield, Earn. 7/31 |
| ARMK | Aramark | Food Beverages/Soap | $32.43 | low 30s | 54 | 26 | 4 for 5'er, top third of FOOD sector matrix, LT pos mkt RS, spread triple top, R-R>3.0, Earn. 8/6 |
| LAMR | Lamar Advertising Company | Media | $118.53 | 110s | 129 | 100 | 5 for 5'er, top third of MEDI sector matrix, LT pos mkt RS, multiple buy signals, 4.5% yield, Earn. 8/1 |
| SPG | Simon Property Group, Inc. | Real Estate | $147.57 | hi 140s - lo 160s | 198 | 120 | 5 TA rating, top 10% of REAL sector matrix, LT RS buy, consec. buy signals, 5% yield, Earn. 7/31 |
| APO | Apollo Global Management Inc. | Wall Street | $116.68 | 108 - 116 | 140 | 94 | 5 for 5'er, LTpos mkt RS, top 10% of WALL sector matrix, spread triple top, pullback from ATH, 1.6% yield |
| CARR | Carrier Global Corp. | Building | $62.29 | hi 50s - low 60s | 91 | 52 | Spread quad top, pullback to prior resistance, R-R>2.5, Earn. 7/25 |
| FRPT | Freshpet Inc | Food Beverages/Soap | $129.43 | 120s | 172 | 102 | 5 for 5'er, #5 of 71 in FOOD sector matrix, buy on pullback, R-R~2.0 |
| BFH | Bread Financial Holdings Inc. | Business Products | $46.04 | low-to-mid 40s | 61 | 37 | 5 for 5'er, top 10% of favored BUSI sector matrix, recent RS buy, triple top, R-R>2.0, 1.9% yield, Earn. 7/25 |
| FORM | FormFactor Inc. | Semiconductors | $61.76 | mid 50s - lo 60s | 78 | 49 | 4 TA rating, top 20% of SEMI sector matrix, recent price normalization, LT positive trend, R-R>2, Earn. 7/31 |
| FLEX | Flex Ltd | Electronics | $29.30 | hi 20s - lo 30s | 55.50 | 23.50 | 5 TA rating, top 20% of ELEC sector matrix, buy-on-pullback, LT RS buy, R-R > 4, Earn. 7/24 |
| LZB | LA Z Boy Chair Company | Household Goods | $37.39 | mid-to-hi 30s | 56 | 31 | 4 for 5'er, top quartile of HOUS sector matrix, spread quad top, R-R>3.0, 2.2% yield |
| ELF | Elf Beauty Inc | Household Goods | $206.42 | mid 190s - mid 210s | 270 | 172 | 5 TA rating, top of the HOUS sector matrix, LT RS buy and positive trend, buy-on-pullback, R-R > 2, Earn. 8/6 |
| EXR | Extra Space Storage Inc. | Real Estate | $153.53 | 140s - 150s | 206 | 130 | 4 for 5'er, top third of REAL sector matrix, quad top breakout, R-R>2.0, 4.3% yield, Earn. 7/30 |
| CSL | Carlisle Cos Inc | Machinery and Tools | $407.60 | hi 380s - hi 420s | 500 | 348 | 5 TA rating, LT RS buy, LT pos. trend, top 10% of MACH sector matrix, buy-on-pullback, Earn. 7/24 |
| SKX | Skechers U.S.A, Inc. | Textiles/Apparel | $67.33 | hi 60s - low 70s | 96 | 55 | 5 for 5'er, top half of TEXT sector matrix, buy on pullback, R-R>2.5, Earn. 7/25 |
| ESTC | Elastic NV | Software | $112.38 | hi 100s - hi 110s | 151 | 92 | 4 TA rating, top 33% of SOFT sector matrix, recent pos. trend change, cosnec. buy signals, buy-on-pullback |
| TTD | The Trade Desk Inc | Internet | $101.52 | mid 90s - low 100s | 114 | 85 | 4 for 5'er, top 25% of INET sector matrix, bullish catapult, Earn. 8/7 |
| Symbol | Company | Sector | Current Price | Action Price | Target | Stop | Notes |
|---|---|---|---|---|---|---|---|
| MTCH | Match Group, Inc. | Leisure | $30.94 | (mid 30s) | 26 | 40 | 0 for 5'er, bottom half of INET sector matrix, LT neg trend & RS, Earn. 7/30 |
| SQ | Block Inc | Finance | $64.51 | (65 - 61) | 54 | 71 | 0 for 5'er, bottom third of FINA sector matrix, triple bottom, Earn. 8/1 |
| Symbol | Company | Sector | Current Price | Action Price | Target | Stop | Notes |
|---|---|---|---|---|---|---|---|
| MMC | Marsh & McLennan Companies, Inc. | Insurance | $211.80 | 190s - low 200s | 234 | 180 | Removed for earnings. Earn. 7/18 |
| JPM | J.P. Morgan Chase & Co. | Banks | $207.63 | lo 180s - hi 190s | 258 | 148 | Remove for earnings. Earn. 7/12 |
| AMP | Ameriprise Financial | Wall Street | $433.29 | 390s - 410s | 532 | 368 | Removed for earnings. Earn. 7/24 |
| OMF | OneMain Holdings Inc. | Finance | $47.00 | hi 40s - low 50s | 81 | 43 | Removed for earnings. Earn. 7/24 |
| HCA | HCA Healthcare Inc. | Healthcare | $316.91 | 304 - mid 330s | 400 | 260 | Removed for earnings. Earn. 7/23 |
| EVR | Evercore Inc. | Finance | $214.61 | hi 180s - low 200s | 262 | 166 | EVR has moved into heavily overbought territory, OK to hold here. Raise stop to $188.Earn. 7/24 |
| MCO | Moody's Corporation | Finance | $435.95 | 380s - 400s | 524 | 340 | MCO has moved into heavily overbought territory. OK to hold here. Raise stop to $360. Earn. 7/23 |
| BAC | Bank of America | Banks | $41.42 | hi 30s | $50/$65 | 34 | Removed for earnings.Earn. 7/16 |
| GOOGL | Alphabet Inc. Class A | Internet | $188.98 | mid 160s - lo 180s | 218 | 140 | GOOGL has moved into heavily overbought territory. OK to hold here. Raise stop to $162. Earn. 7/23 |
| DAL | Delta Air Lines Inc. | Aerospace Airline | $46.89 | hi 40s - lo 50s | 74 | 39 | Removed for earnings. Earn. 7/11 |
| AVY | Avery Dennison Corporation | Business Products | $213.00 | 210s - 220s | 270 | 192 | Removed for earnings. Earn. 7/23 |
| CDNS | Cadence Design Systems, Inc. | Software | $315.26 | mid 290s - low 320s | 392 | 248 | Removed for earnings. Earn. 7/22 |
| NFLX | NetFlix Inc. | Internet | $685.74 | 640s - 690s | 896 | 536 | Removed for earnings. Earn. 7/18 |
| MTSI | MACOM Technology Solutions Holdings Inc. | Semiconductors | $115.82 | 100 - 110 | 129 | 88 | MTSI has moved into heavily overbought territory. OK to hold here. Raise stop to $95. Earn. 8/1 |
| Comment | |||||||
|---|---|---|---|---|---|---|---|
|
|
|||||||
TTD The Trade Desk Inc R ($100.44) - Internet - TTD is a 4 for 5'er that ranks seventh out of 31 names in the internet sector matrix and sits one box away from returning to a market RS buy signal, which would promote it to a 5 for 5'er. In last week's trading, the stock gave a second consecutive buy signal when it completed a bullish catapult at $100. Long exposure may be added in the mid $90s to low $100s and we will set our initial stop at $85, a potential spread triple bottom break on TTD's default chart. We will use stock's previous high, $114, as our target price. TTD is expected to report earnings on 8/7.
| 24 | ||||||||||||||||||||||||||||||||||||||||||||||||||||
| 100.00 | 7 | 100.00 | ||||||||||||||||||||||||||||||||||||||||||||||||||
| 99.00 | X | X | 99.00 | |||||||||||||||||||||||||||||||||||||||||||||||||
| 98.00 | X | X | X | O | X | 98.00 | ||||||||||||||||||||||||||||||||||||||||||||||
| 97.00 | X | X | O | X | O | X | O | X | 97.00 | |||||||||||||||||||||||||||||||||||||||||||
| 96.00 | X | O | X | X | O | X | O | X | O | 96.00 | ||||||||||||||||||||||||||||||||||||||||||
| 95.00 | • | X | O | X | O | 6 | O | X | O | 95.00 | ||||||||||||||||||||||||||||||||||||||||||
| 94.00 | X | • | X | O | X | O | X | O | X | Mid | 94.00 | |||||||||||||||||||||||||||||||||||||||||
| 93.00 | X | O | • | X | O | O | X | O | X | • | 93.00 | |||||||||||||||||||||||||||||||||||||||||
| 92.00 | X | O | • | X | X | O | O | X | • | 92.00 | ||||||||||||||||||||||||||||||||||||||||||
| 91.00 | X | O | • | X | O | X | O | • | 91.00 | |||||||||||||||||||||||||||||||||||||||||||
| 90.00 | X | O | • | • | X | O | X | • | 90.00 | |||||||||||||||||||||||||||||||||||||||||||
| 89.00 | X | O | X | • | • | X | O | X | X | • | 89.00 | |||||||||||||||||||||||||||||||||||||||||
| 88.00 | X | O | X | O | X | • | X | O | X | O | X | • | 88.00 | |||||||||||||||||||||||||||||||||||||||
| 87.00 | X | O | X | O | X | O | • | X | O | X | O | X | • | 87.00 | ||||||||||||||||||||||||||||||||||||||
| 86.00 | X | O | 3 | X | 4 | X | O | • | 5 | O | O | • | 86.00 | |||||||||||||||||||||||||||||||||||||||
| 85.00 | • | X | O | X | O | X | O | O | X | X | • | 85.00 | ||||||||||||||||||||||||||||||||||||||||
| 84.00 | • | X | O | X | X | O | X | O | X | O | X | • | 84.00 | |||||||||||||||||||||||||||||||||||||||
| 83.00 | • | X | O | X | O | X | O | X | O | X | O | X | • | 83.00 | ||||||||||||||||||||||||||||||||||||||
| 82.00 | • | X | O | X | O | X | O | X | O | X | O | X | • | 82.00 | ||||||||||||||||||||||||||||||||||||||
| 81.00 | X | • | • | X | O | O | O | X | O | X | O | X | • | 81.00 | ||||||||||||||||||||||||||||||||||||||
| 80.00 | X | O | X | • | X | • | X | O | X | O | X | O | • | 80.00 | ||||||||||||||||||||||||||||||||||||||
| 79.00 | X | O | X | O | X | O | • | • | X | O | X | O | X | • | 79.00 | |||||||||||||||||||||||||||||||||||||
| 78.00 | X | O | X | O | X | O | • | X | • | X | O | X | O | X | • | Bot | 78.00 | |||||||||||||||||||||||||||||||||||
| 77.00 | • | O | X | O | O | • | X | O | • | X | O | • | O | • | 77.00 | |||||||||||||||||||||||||||||||||||||
| 76.00 | O | X | X | O | • | X | O | • | X | • | • | 76.00 | ||||||||||||||||||||||||||||||||||||||||
| 75.00 | O | X | O | X | O | X | O | • | X | X | • | 75.00 | ||||||||||||||||||||||||||||||||||||||||
| 74.00 | O | X | O | X | O | X | O | • | X | O | X | • | 74.00 | |||||||||||||||||||||||||||||||||||||||
| 73.00 | O | O | X | O | X | O | • | X | O | X | • | 73.00 | ||||||||||||||||||||||||||||||||||||||||
| 72.00 | O | B | O | X | X | O | X | • | X | O | • | 72.00 | ||||||||||||||||||||||||||||||||||||||||
| 71.00 | O | X | O | X | O | X | 1 | X | O | X | X | • | 71.00 | |||||||||||||||||||||||||||||||||||||||
| 70.00 | O | X | O | X | O | X | O | X | O | X | O | X | X | • | 70.00 | |||||||||||||||||||||||||||||||||||||
| 69.00 | O | X | O | X | X | C | X | O | X | O | X | O | X | O | X | • | 69.00 | |||||||||||||||||||||||||||||||||||
| 68.00 | O | X | O | X | O | X | O | O | X | O | O | X | O | X | • | 68.00 | ||||||||||||||||||||||||||||||||||||
| 67.00 | O | X | O | X | O | X | O | X | 2 | O | • | 67.00 | ||||||||||||||||||||||||||||||||||||||||
| 66.00 | O | X | O | X | O | X | O | X | • | • | 66.00 | |||||||||||||||||||||||||||||||||||||||||
| 65.00 | O | O | X | O | • | O | X | • | 65.00 | |||||||||||||||||||||||||||||||||||||||||||
| 64.00 | O | X | • | O | X | • | 64.00 | |||||||||||||||||||||||||||||||||||||||||||||
| 63.00 | O | X | • | O | X | • | 63.00 | |||||||||||||||||||||||||||||||||||||||||||||
| 62.00 | O | X | • | O | • | 62.00 | ||||||||||||||||||||||||||||||||||||||||||||||
| 61.00 | O | • | • | 61.00 | ||||||||||||||||||||||||||||||||||||||||||||||||
| 24 |
| CVNA Carvana Company ($130.78) - Autos and Parts - CVNA broke a double bottom at $130 for a third buy signal since June as the stock rallied to match its recent high at $136. The stock is a 5 for 5'er that ranks 2nd (out of 51) in the Autos and Parts sector matrix. Okay to consider in the mid-$120 to mid-$130s. Initial support lies at $122, while additional can be found at $102 and $98. |
| EAT Brinker International Inc ($65.45) - Restaurants - EAT broke a double bottom at $65 to return to a sell signal after the stock rallied to a multi-year chart high at $76. The stock remains a 5 for 5'er that ranks 2nd (out of 28) in the Restaurants sector matrix. From here, support on the default chart isn't done until the mid to lower $40s, while support on the more sensitive 0.50 point per box chart lies at $60.50 and $56.50. |
| MA Mastercard Incorporated Class A ($429.66) - Finance - MA shares moved lower today to break a double bottom at $432 to mark its first sell signal. This 5 for 5'er has been in a positive trend since December and on an RS buy signal versus the market since August 2011. MA shares are trading below the middle of their trading band with a weekly overbought/oversold reading of -13%. From here, support is offered at $360. Earnings are expected on 7/25. |
| NEM Newmont Corp ($45.54) - Precious Metals - NEM gave a second consecutive buy signal on Wednesday when it broke a double top at $45, where it now sits against its bearish resistance line. The technical picture for NEM remains negative as the stock is a 1 for 5'er that ranks 15th out 17 names in the precious metals sector matrix. A move to $46 would return NEM a positive trend and promote it to a 2 for 5'er. |
| PSTG Pure Storage ($67.44) - Semiconductors - PSTG moved higher Wednesday to break a double top at $67. This 5 for 5'er moved to a positive trend in June and sits in the top quartile of the semiconductors sector RS matrix. The weight of the evidence is positive here and is improving once again. Initial support can be seen at $61 with further support offered at $59. Note the potential for further overhead resistance may be found at $70. |
| Name | Option Symbol | Action | Stop Loss |
|---|---|---|---|
| Occidental Petroleum Corporation - $61.19 | OXY2420I62.5 | Buy the September 62.50 calls at 2.10 | 58.00 |
| Name | Option | Action |
|---|---|---|
| Bank of America ( BAC) | Sep. 37.00 Calls | Raise the option stop loss to 3.20 (CP: 5.20) |
| Morgan Stanley ( MS) | Sep. 95.00 Calls | Initiate an option stop loss of 7.60 (CP: 9.60) |
| Visa Inc. ( V) | Oct. 270.00 Calls | Stopped at 260.00 (CP: 260.49) |
| American Express Company ( AXP) | Oct. 230.00 Calls | Raise the option stop loss to 16.15 (CP: 18.15) |
| Trane Technologies PLC ( TT) | Dec. 330.00 Calls | Initiate an option stop loss of 31.20 (CP: 33.20) |
| Name | Option Symbol | Action | Stop Loss |
|---|---|---|---|
| Shopify Inc - $65.48 | SHOP2420U65 | Buy the September 65.00 puts at 5.15 | 69.00 |
| Name | Option | Action |
|---|---|---|
| Starbucks Corporation ( SBUX) | Sep. 80.00 Puts | Raise the option stop loss to 6.70 (CP: 8.70) |
| DoorDash, Inc. Class A ( DASH) | Nov. 115.00 Puts | Raise the option stop loss to 14.65 (CP: 16.65) |
| Name | Option Sym. | Call to Sell | Call Price | Investment for 500 Shares | Annual Called Rtn. | Annual Static Rtn. | Downside Protection |
|---|---|---|---|---|---|---|---|
| Micron Technology, Inc. $ 131.14 | MU2418J140 | Oct. 140.00 | 12.30 | $ 62,682.40 | 38.65% | 31.49% | 7.94% |
| Name | Action |
|---|---|
| Abercrombie & Fitch Co. ( ANF) - 179.24 | Sell the September 175.00 Calls. |
| Vistra Corp ( VST) - 91.40 | Sell the October 90.00 Calls. |
| NRG Energy, Inc. ( NRG) - 79.26 | Sell the September 80.00 Calls. |
| Seagate Technology ( STX) - 104.35 | Sell the September 105.00 Calls. |
| Micron Technology, Inc. ( MU) - 131.14 | Sell the October 140.00 Calls. |
| Dell Technologies Inc Class C ( DELL) - 145.74 | Sell the October 145.00 Calls. |
| Airbnb, Inc. Class A ( ABNB) - 152.45 | Sell the October 155.00 Calls. |
| Eldorado Gold Corporation ( EGO) - 16.04 | Sell the October 16.00 Calls. |
| NetApp, Inc. ( NTAP) - 132.09 | Sell the December 140.00 Calls. |
| Name | Covered Write |
|---|---|
| Teradyne, Inc. ( TER - 153.48 ) | October 150.00 covered write. |
Daily Equity & Market Analysis
Loading, Please Wait...
