Crude has shown improvement over the past month or so. But has relative improvement begun to transpire for the commodity?
Check out this week's Major Index and DALI Overview (3:06).
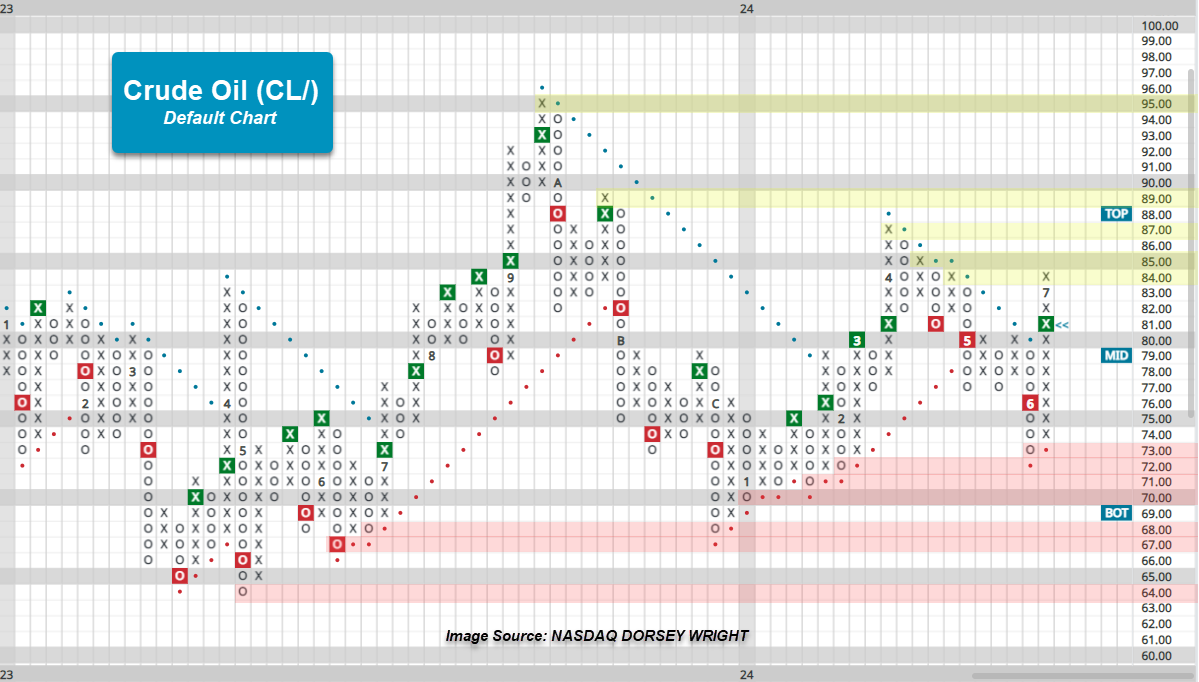
There haven’t been many changes to the DALI rankings since International Equities fell below Commodities to cause a shakeup in the upper half of the asset class rankings, but that doesn't mean there hasn’t been action transpiring under the hood. Within commodities, Energy has been a relative laggard against its counterparts in the asset class since April, but since early June, crude oil CL/ has seen improvement on its trend chart. Through the short time in July, crude is roughly flat for the month, which follows up 5.91% in June to have the commodity wrap Q2 down roughly 2%. This positive near action has again brought crude up from support in the lower-$70s to resistance in the mid-$80s. Over the past two years, the trading range that crude has traded in has only gotten tighter in 2024 – going from a range in the mid-$60s to mid-$90s in the latter part of 2022 through 2023 to the lower-$70s to mid-$80s now.
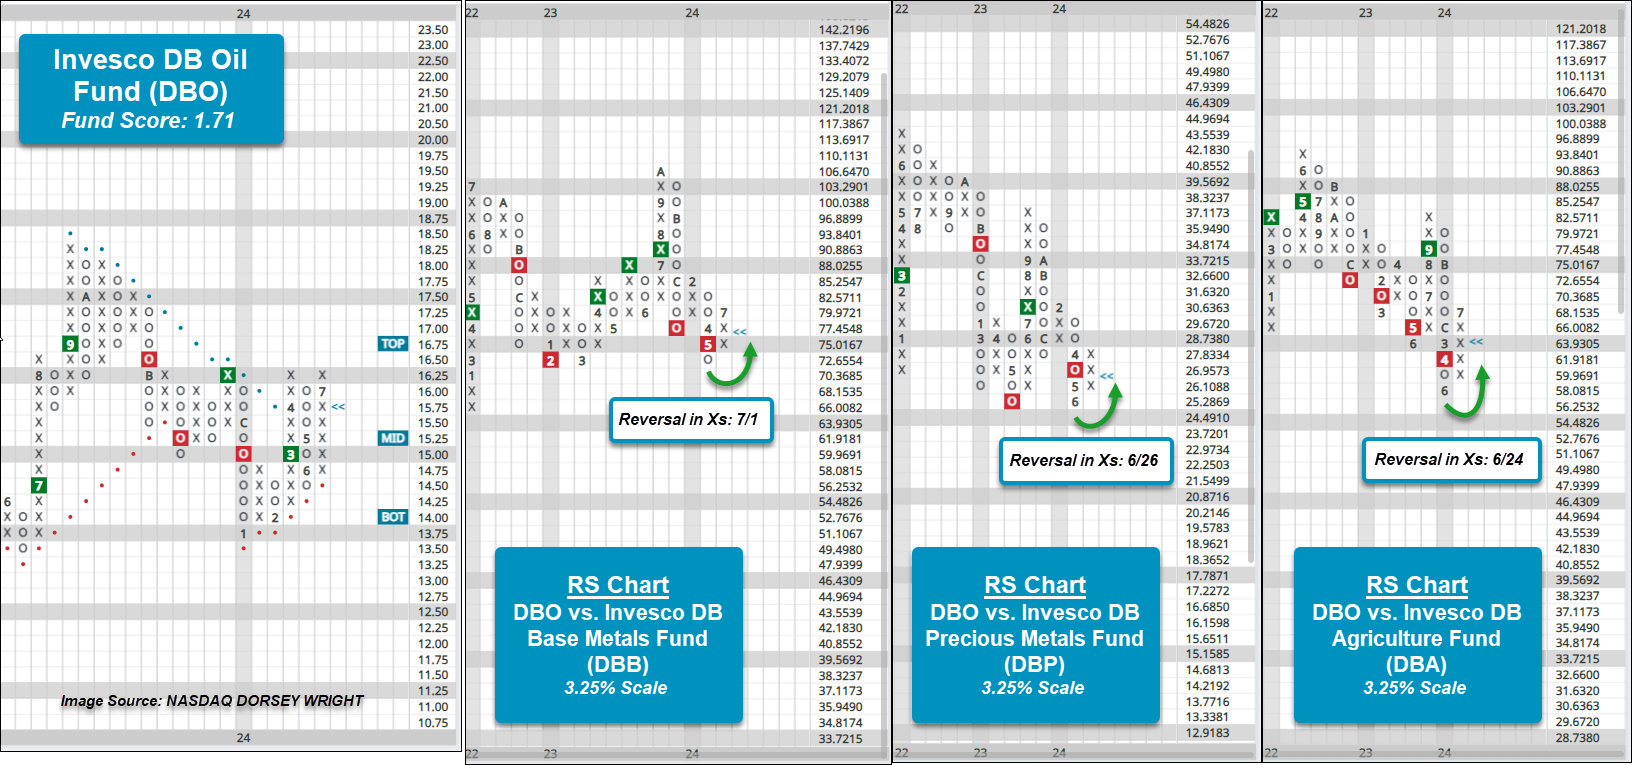
Crude’s recent improvement has provided some relative improvement within the DALI Commodity level, but precious and base metals possess the bulk of the total buy signals for the broader asset class. The RS charts below feature the Invesco DB Oil Fund DBO against the Invesco DB Base Metals DBB, Precious Metals DBP, and Agriculture DBA funds on a 3.25% scale chart. Though each chart still maintains an RS Sell signal, showing long-term weakness relative to other areas within commodities, each RS chart has moved back into a column of Xs within the past couple of weeks. Crude, and subsequently DBO’s improvement, has been enough to signal some near-term outperformance, but with crude (and DBO) both rallying to key resistance levels it will be intriguing to see what develops from here.
If crude is unable to move through current resistance, then the recent relative improvement is likely to wane. But a move past resistance – along with potentially other commodity counterparts pulling back or deteriorating – would provide potential fodder for further relative improvements. Until then, crude and other individual energy commodities continue to yield not much more than a short term trade. Those who may seek to monitor crude’s chart could set price or activity alerts for potential breakouts (and/or breakdowns).