Most Requested Symbols

Notable technical developments are included from Industrials, Consumer Discretionary and Financials.
Mexico, Colombia, and Peru have all shown relative strength improvement over the past month, continuing themes of strength.
The curve has an average reading of 36.23%.
Today's featured stock is Blueprint Medicines Corp (BPMC).
BBWI, BOOT, IFF, MRK, SPT, and W
Call: CSX Corporation (CSX), Put: United Airlines Holdings Inc. (UAL), Covered Write: Lyft Inc Class A (LYFT)
NDW Morning Update Video - March 28, 2024
NDW Morning Update Video – March 28, 2024.
Click here to download MP3
Chicago RS Institute: Register to join us in person for a 3-hour educational symposium on relative strength investing. This event is for financial advisors and will offer 3 hours of CFP/CIMA credit.
When: April 23, 2024, 8 AM CT - 11 AM CT
Where: 1 South Wacker Drive, Chicago, IL, 60606
Who: Speakers include...
John Lewis, CMT, Senior Portfolio Manager; Andy Hyer, CFP, CIMA, CMT, Client Portfolio Manager; Ian Saunders, Senior Research Analyst
Cost: Free! Breakfast will also be provided.
Registration is limited to the first 75 advisors, so be sure to act fast!
Today's Weekly Analyst Rundown video has been separated into shorter, individual videos, in addition to the long-form video that is still found at the beginning of this report. Each asset class will be included at the top of the corresponding featured article today, and each sector that saw notable movement will have a video recording included in the US Sector Update or the Were You Aware. The Fund Score update will be included in tomorrow's Fund Score Overview article. The sections of the video that do not have a corresponding article are included below:
Weekly Momentum Update Video (2:36)
Weekly Size & Style Update Video (1:31)
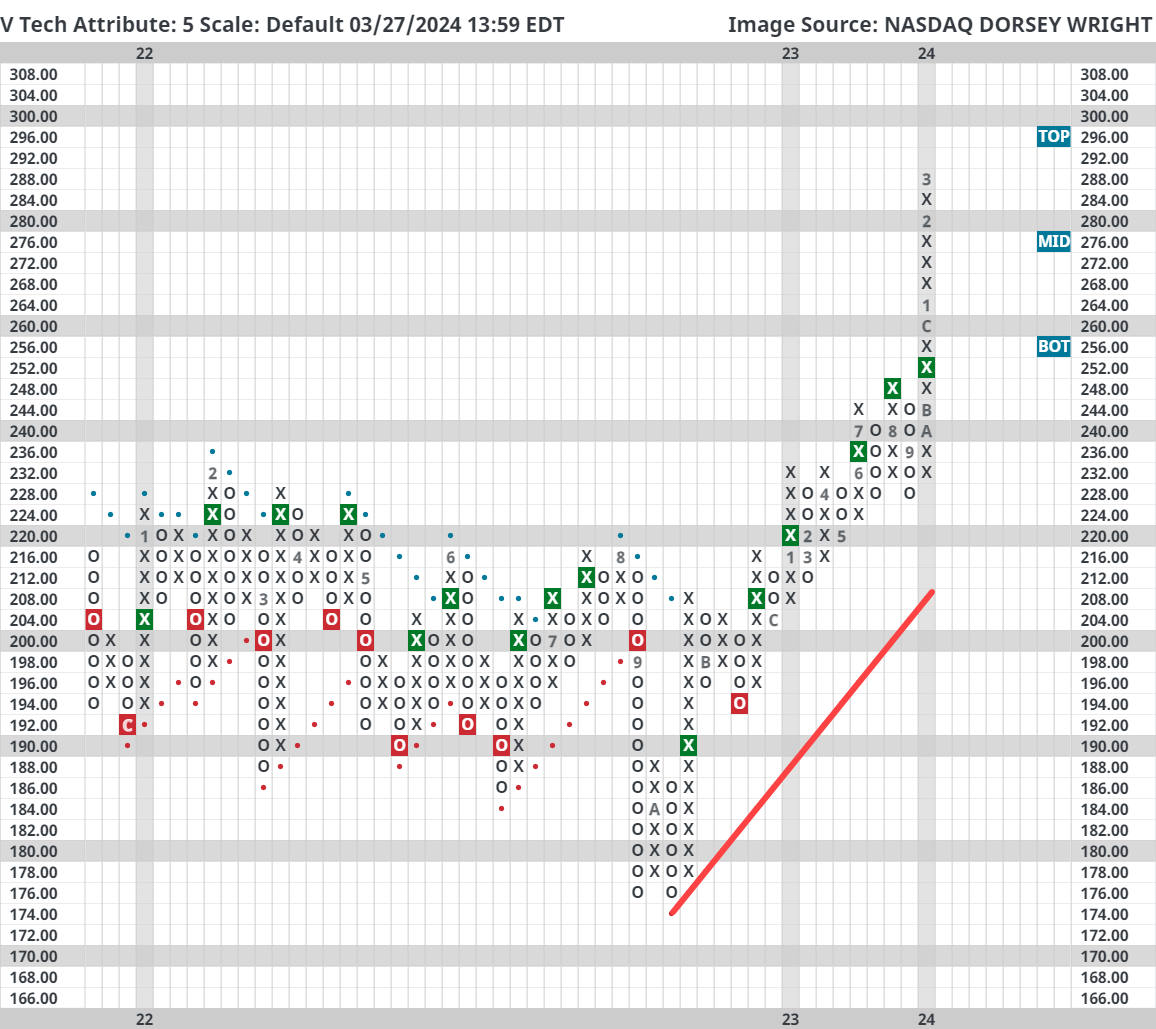
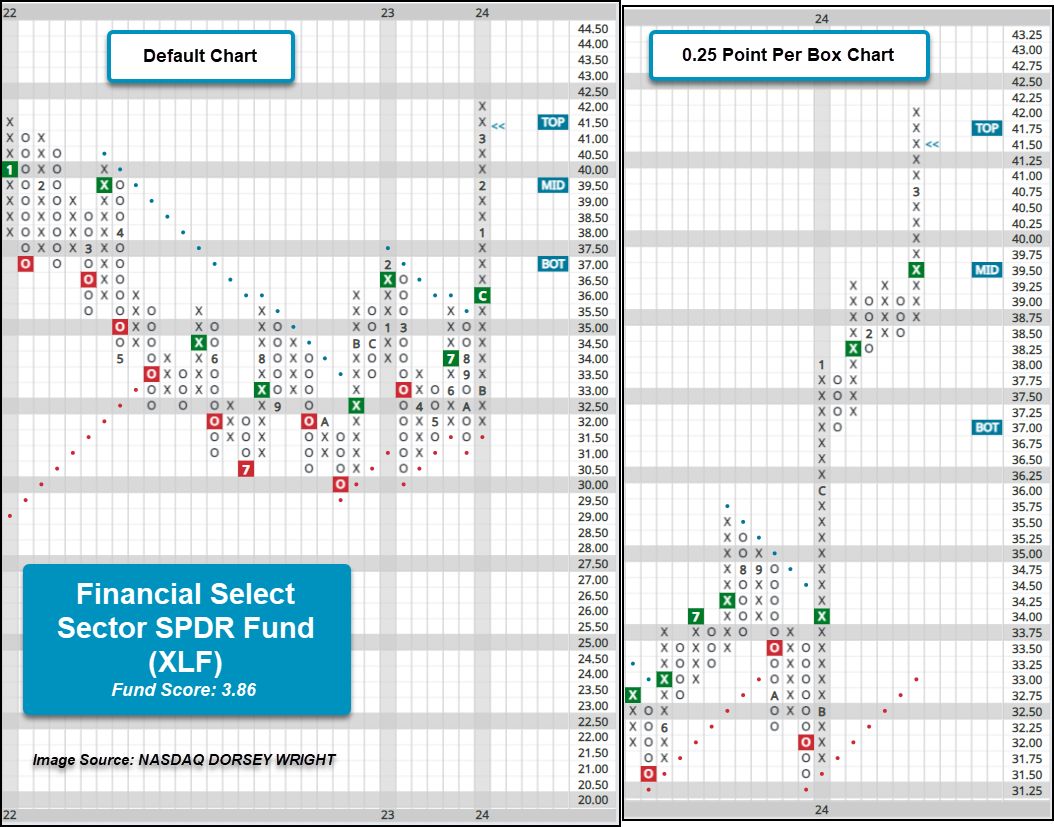
Visa (V) and Mastercard (MA) reached a $30 billion settlement to limit credit and debit card fees for merchants. The settlement still needs court approval but would resolve most claims in litigation that began in 2005. If the court approval goes through, then Visa and Mastercard would reduce their swipe rates by a few basis points and cap rates for five years. The lower swipe rates and pause in any increases will likely lower costs for businesses and potentially consumers (Reuters). The case doesn’t seem to have had much of an impact on MA and V as neither stock had any outsized moves on the news. V has been a perfect 5 for 5’er since October 2022 and MA has had at least four technical attributes since November 2022. The Financial Select Sector SPDR Fund (XLF) has V and MA as its third and fourth-largest holdings, respectively. V and MA make up more than 15% of XLF’s underlying exposure.

Weekly Cryptocurrency Update (1:34)
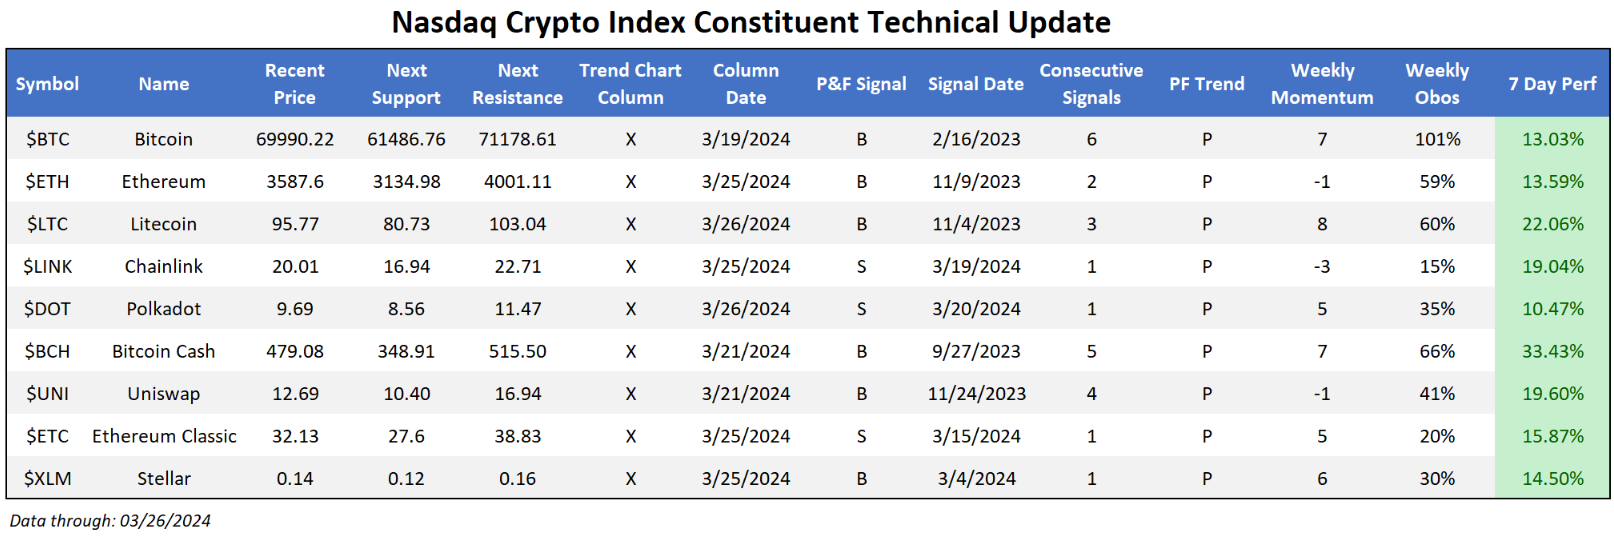
It was a positive week for the Nasdaq Crypto Index (NCI), seeing each constituent advance more than 13%. This coincided with many coins bouncing off relevant support (something mentioned last week as an important point to watch in the near-term) as all members now sit in columns of X’s on their default 5% chart. Perhaps more important for the long-term is the test (and subsequent rally) of $60,000 mark for crypto king Bitcoin. Bulls seem keen to defend this mark, establishing a bit of a range (roughly 17%-19%) between this near-term support and all-time highs above around $73,000. Regardless, bulls should consider this week’s action across the index as a sign of further confirmation of the space’s continued viability.
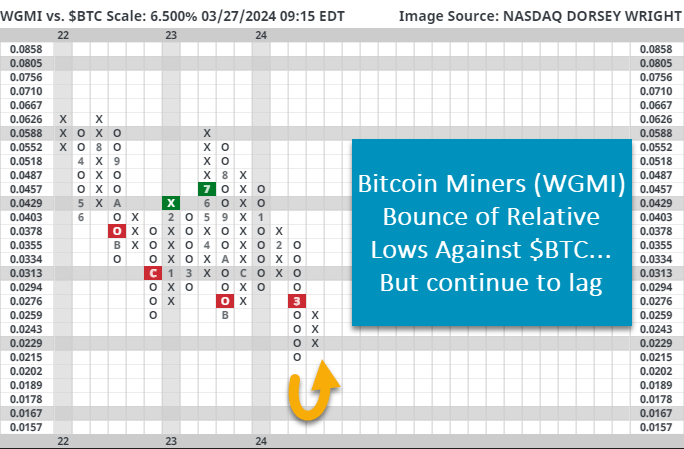
Today’s report will focus on the recent underperformance of Bitcoin Miners against Bitcoin itself. Looking at miners proxy WGMI, one can see a distinct YTD performance lag (1.22% for WGMI vs. 65.54% for Bitcoin) between the 2 names. While there are several possible reasons for the difference, perhaps the most fundamentally sound is the upcoming Bitcoin Halving. Rewards for mining additional Bitcoin will be cut in half, while the efforts, costs, and labor of mining will most likely stay the same. This compression of mining rewards could put continued pressure on the mining industry- despite interest in the sector being drummed up by the recently approved spot ETFs. From a technical standpoint, a simple Relative Strength (RS) relationship between WGMI & $BTC reveals the mining proxy bouncing off of relative lows against Bitcoin. This action coincides with the fund returning to a buy signal against SPXEWI, pushing its fund score higher. While positive, there is still plenty of work to be done before one would say relative strength within the crypto space sits with the miners. Both fundamental and technical question marks in play make simply buying $BTC a better option for now, but this near-term improvement for WGMI is something to watch as we approach the upcoming halving.
Each week the analysts at NDW review and comment on all major asset classes in the global markets. Shown below is the summary or snapshot of the primary technical indicators we follow for multiple areas. Should there be changes mid-week we will certainly bring these to your attention via the report.
| Universe | BP Col & Level (actual) | BP Rev Level | PT Col & Level (actual) | PT Rev Level | HiLo Col & Level (actual) | HiLo Rev Level | 10 Week Col & Level (actual) | 10 Week Rev Level | 30 Week Col & Level (actual) | 30 Week Rev Level |
|---|---|---|---|---|---|---|---|---|---|---|
| ALL |
|
50% |
|
34% |
|
74% |
|
48% |
|
50% |
| NYSE |
|
54% |
|
50% |
|
82% |
|
64% |
|
66% |
| OTC |
|
38% |
|
28% |
|
62% |
|
50% |
|
44% |
| World |
|
48% |
|
38% |
|
|
|
48% |
|
48% |

Check out this week's Major Index and DALI Overview (3:30)
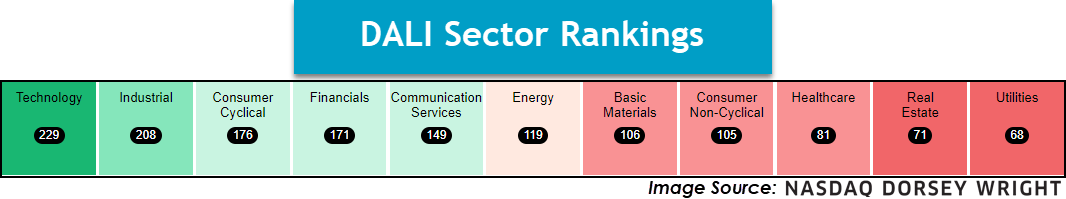
With US Equities indices trading near all-time highs in most cases, Domestic Equities maintains its firm lead over International Equities and Commodities. Under the hood of Domestic Equities, there haven’t been any changes to the sector rankings since early February – which is good news for momentum/RS-based strategies as they can capitalize on leadership trends. But while there haven’t necessarily been changes to the rankings, that doesn’t mean there haven’t been tally signals exchange among the underlying sector representatives. With the first quarter of 2024 nearing a close and next week’s report consisting of quarterly performance reviews, we wanted to take time to note where relative improvement and deterioration have occurred within the sector rankings.

While the above image highlights the lack of ranking changes since February, the daily sector tally (or buy signal) counts show what action has transpired during March. Technology continues to maintain its lead among the sectors and has shown relative improvement during March as it picked up another seven signals. Tech is only the second most improved sector in March as Financials has added another eight tally signals during March to be the most improved. Financials now ranks as the second most improved sector within DALI rankings year-to-date and continues to be supported by the Finance and Insurance subsectors. Although Consumer Discretionary currently ranks as the second worst performing SPDR ETF on an absolute basis during March, down 1.12%, subsectors like Homebuilding, Leisure, and Autos and Parts, provided for some relative improvement. Discretionary maintains as the third most improved sector from a relative standpoint during March and on a year-to-date basis.
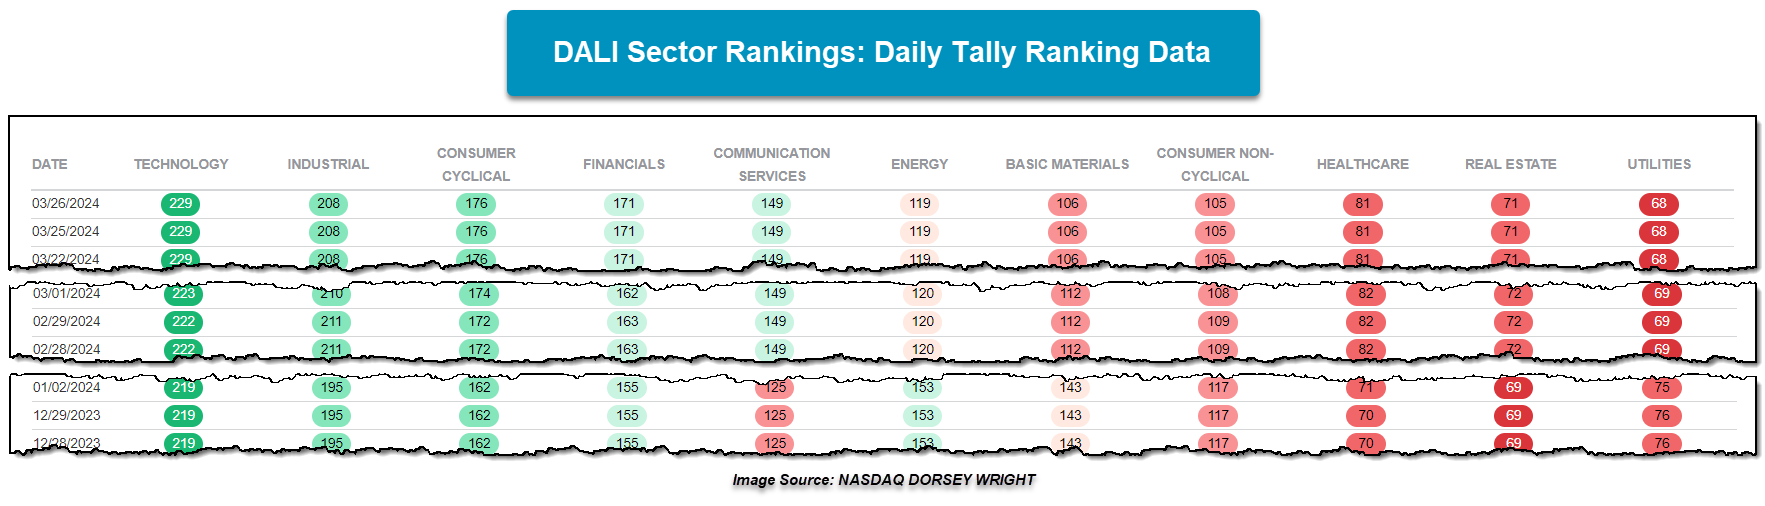
Beyond the three aforementioned sectors above, pretty much all other sectors – except Industrials – have shed just one tally signal during March. As of Tuesday’s close, Industrials stands as the sector with the most relative deterioration in the sector rankings during March, albeit in a small way, with a loss of three tally signals.
On an absolute basis, laggard sectors like Energy XLE and Basic Materials XLB have been the best-performing ETFs during March, up 7.43% and 4.31%, but have yet to make relative gains. Additionally, each fund has rallied to resistance, but it is worth noting that XLB is testing its all-time chart high. While Materials looks to be the fifth SPDR fund to mark a new all-time high, Financials XLF became the fourth SPDR fund to do so with action over this past week. During last Friday’s trading, XLF rallied above the $42 level to mark a new all-time high for the first time in roughly 26 months. On the default chart, XLF has maintained a buy signal since July of last year and shifted back into a positive trend following a second buy signal in December. XLF’s fund score resides at 3.86, near a two-year high, and is coupled with an intensely positive score direction of 2.98. The fund has been in a column of Xs on its default trend chart since November 2023 and now trades almost 25% above current support levels. On the more sensitive 0.25 point per box chart, support can be found in the lower-$38 range at $37. The fund’s rally has put XLF in overbought territory so those seeking exposure may look to add on a pullback into the $40 to $41 range.
The past week saw no significant technical developments in the Technology, Communication Services, Energy, Basic Materials, Consumer Non-Cyclicals, Healthcare, Real Estate or Utilities Sectors. Those that saw noteworthy movement are included below, in order of their relative strength ranking in the DALI domestic equity sector rankings. Sector designations are based on DALI sector rankings and are as follows: 1 - 3 overweight, 4 - 7 equal-weight, and 8 - 11 underweight.
Industrial- Overweight, Improving
Weekly Industrial Update Video (2:34)
The sector continues to improve, as small-caps continue to flex their muscles in comparison to the rest of the small-cap representatives. Look towards PSCI for exposure to the space. XLI remains an option as well. UPS and FDX were notable movers for the last seven days. UPS struggled on the back of their investor day and remains a name to avoid. FDX is a technically weak stock but should remain on a laundry list if it can pick up additional technical attribute points.
Consumer Cyclical- Overweight
Weekly Consumer Cyclical Update Video (4:04)
Consumer Discretionary – Overweight – The Consumer Discretionary Select Sector SPDR Fund XLY was the best-performing sector fund over this past week's roll as it added 99 basis points and caused the fund to reverse back into Xs at $184. Domino’s Pizza DPZ was a notable upside mover as it gave a third buy signal and rallied to a 52-week high upon analyst upgrades. Dave & Buster’s PLAY fell on analyst downgrades but initiated a shakeout pattern (a bullish pattern) in a stock that possesses a 5 attribute rating and is pulling back from multi-year highs. Five Below FIVE and Lululemon LULU both had notable technical breakdowns following earnings last week, while Academy Sports & Outdoors ASO was able to maintain its positive technical picture following an earning miss and return to a sell signal.
Financials – Equal Weight
Weekly Financials Update Video (2:12)
Financials continued to show signs of strength over the past week. The Financial Select SPDR Fund (XLF) notched a new all-time high and is now sitting at $42 on its trend chart. Like many other names, XLF trades on a stem and in heavily overbought territory. This may be a concern in the short term, but the technical picture is still positive. Visa (V) and Mastercard (MA) reached a $30 billion settlement to limit credit and debit card fees for merchants. The stocks seemed to be unaffected by the news, but it is one of the antitrust announcements in history.

International Equity Weekly Video (3:03)
Latin American representatives have shown increased dispersion over the past month, with relatively smaller representatives accounting for most of the relative strength improvement. This is not visible for those simply following the iShares S&P Latin America 40 ETF ILF. Even though that fund shows a strong 4.22 fund score sitting in a positive trend and on a buy signal, we have not seen the default chart move since January. Even more, the fund is about flat over the past 30 days, posting a return of just 0.07% (through 3/26). Brazil makes up the largest weighting of this fund by far, accounting for over 50% of the underlying exposure, which has not helped the fund over the past month. The iShares MSCI Brazil ETF EWZ has returned -2.60% over the past 30 days, notably underperforming other Latin American countries like Mexico (FLMX) at a gain of 2.90%, Colombia (GXG) 6.65%, and Peru (EPU) at 9.81%. Today, we will highlight the technical pictures of those other representatives as potential opportunities to look toward in the second quarter given their recent improvement and higher rankings in our NDW Country Index Matrix Rankings.
Mexico has been one of the most consistent relative strength names in international equities over the past two years, as it has remained in the top quartile of our NDW RS Country Matrix Rankings since February 2022. That 25-month stint is longer than any other current country inside the top ten, speaking to its resiliency. Of course, having one country sit so high in the rankings for so long begs the question of when this streak will end, as it cannot go on forever. However, it is important to remember that we are in the business of buying winners, and you will be hard-pressed to find a more consistent winner than Mexico. When that changes, so will our rankings, but the current technical picture for our southern neighbor does not suggest any pending declines on the horizon.
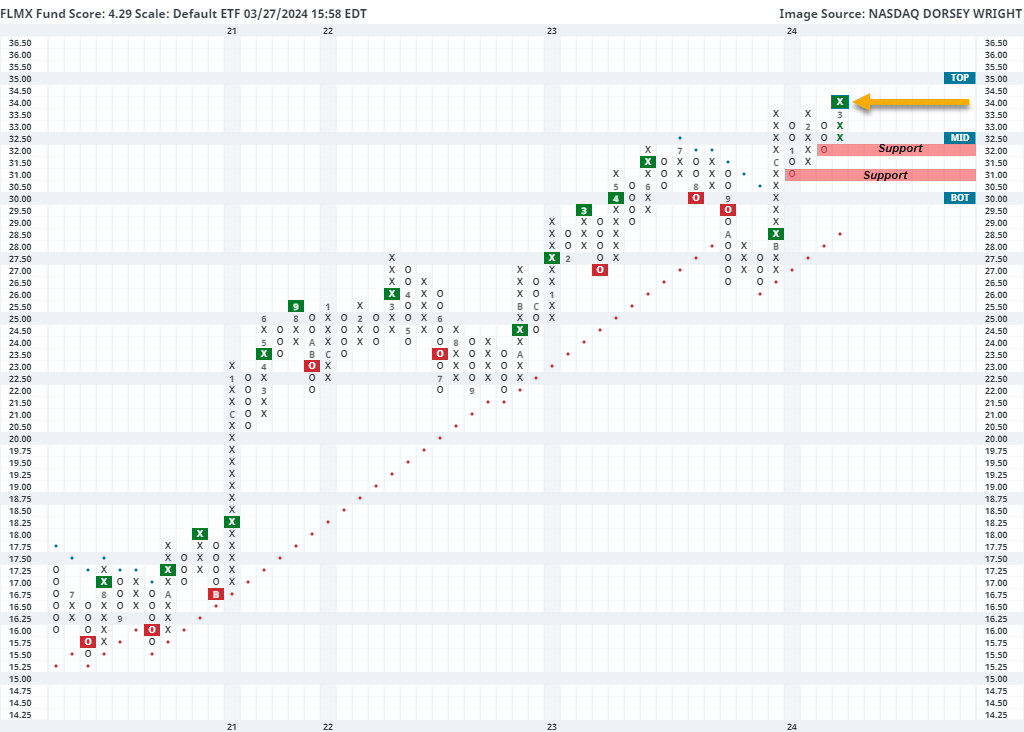
The Franklin FTSE Mexico ETF FLMX pushed higher Wednesday to break a triple top at $34, marking its highest level in over a decade. The fund has maintained an RS buy signal against the S&P Equal Weight Index SPXEWI since May 2022, helping it reach a robust 4.29 recent fund score posting that is paired with a strongly positive score direction. FLMX has not shown the same level of improvement so far in 2024 that we saw in the final few months of 2023, however, this week’s breakout provides further confirmation of an already positive technical backdrop. The fund still sits in an actionable trading range, with a weekly overbought/oversold reading of about 59% at the time of this writing. Weekly momentum also just flipped back to positive, suggesting the potential for further upside from here. Those looking to add exposure to Mexico may consider the fund on this breakout, with initial support seen at $32 and further support seen at $31. Note that FLMX is also a holding in the Franklin International Rotation Model (Franklin Report).
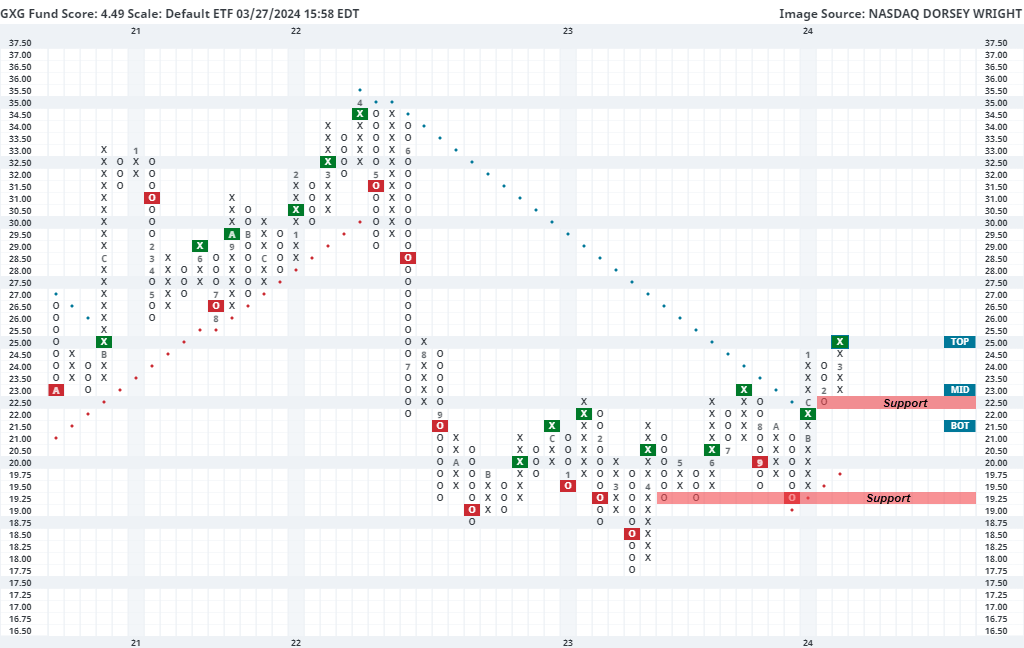
Colombia has shown consistent relative strength improvement since it began ascending from the last ranked position in our NDW Country Index Matrix ranking one year ago. Moving from the 42nd position in March 2023 all the way to the 4th position by March 2024 is no small feat. The Global X MSCI Colombia ETF GXG has also been indicative of this strength, with the fund pushing higher Wednesday to give a second consecutive buy signal at $25. GXG carries a strong 4.49 fund score paired with a sharply positive 2.73 score direction. We saw it move back to an RS buy signal against the market in January and saw weekly momentum recently flip positive, suggesting the potential for further upside from here. The fund also carries a 6.94% yield. Note that the recent appreciation has left GXG on a stem, with an intraday weekly overbought/oversold reading north of 93% at the time of this writing Wednesday. Those looking to add exposure may be best served to wait for a pullback or normalization in the trading band. Initial support can be seen at $22.50 with further support offered at $19.75 and $19.25.
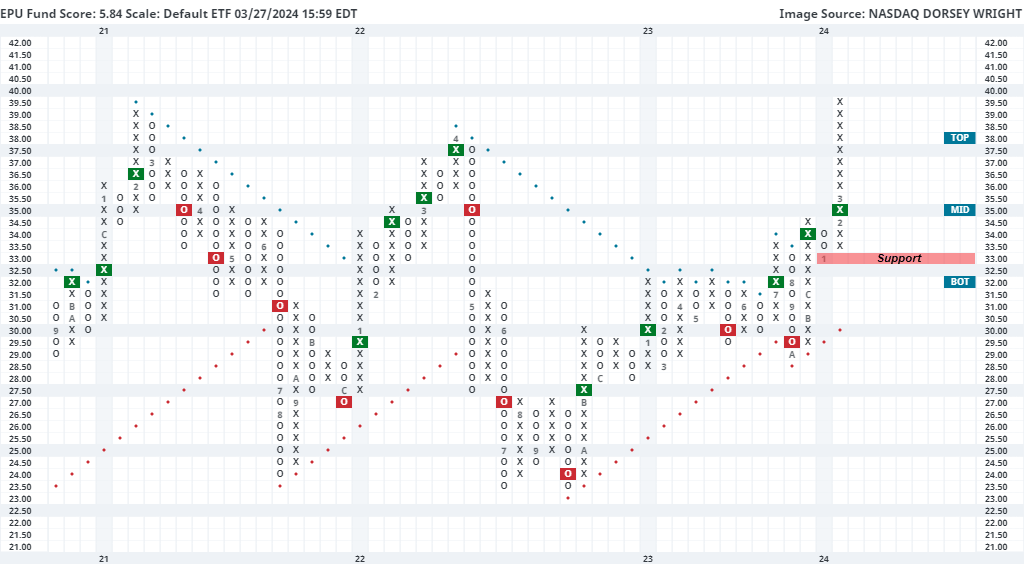
The final country we will highlight today is Peru, which is the lowest ranked of today’s three countries in focus at the 12th position out of the 42 countries in the NDW Country Index Matrix Ranking. Still, 12th is not bad, and we have seen Peru climb four positions in the past month, a greater rise than Mexico or Colombia have experienced in the past two months. This rapid appreciation has been seen on the default chart of the iShares MSCI Peru and Global Exposure ETF EPU, which climbed to a multi-year high of $39.50 earlier this month after reversing higher from the $33 position in February. EPU carries a near-perfect 5.84 fund score paired with a positive 2.35 score direction. This drastic appreciation has left EPU in an extended position, with a weekly overbought/oversold reading north of 100%. Initial support is also not seen until $33. Those looking to add exposure toward EPU may want to wait for some consolidation given the extended technical position. Remember, securities can pullback through price or pullback in time, as sideways movement around the current level would also lead to a normalization in the trading band. Further overhead resistance may be seen around $40 with additional resistance near $44.50.
Weekly Fixed Income Update Video (2:11)
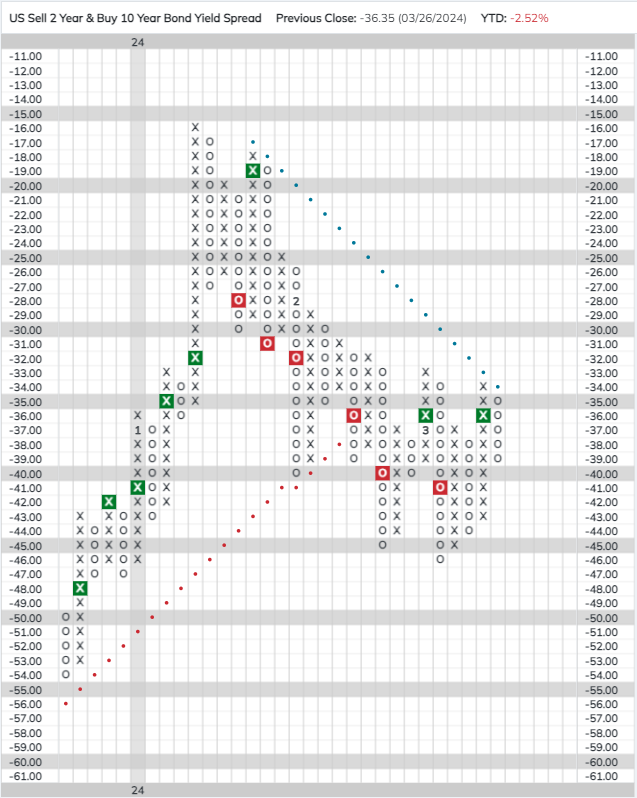
US Treasury yields were down slightly over the last week following the Fed’s March meeting. As discussed last week, the statement of econ projections released following the meeting showed the FOMC median projection is still for roughly three 25 bps cuts this year. However, members’ median projection for the fed funds rate in 2025, 2026, and the longer term increased, indicating their estimate of the neutral rate has risen. The change in projections could help support relatively higher yields in longer maturities, potentially helping to normalize the yield curve which has been inverted since 2022. Thus far, the two/10-year Treasury yield spread (USYC2Y10) has not moved significantly, remaining in roughly the same range it has been in for the last few weeks.
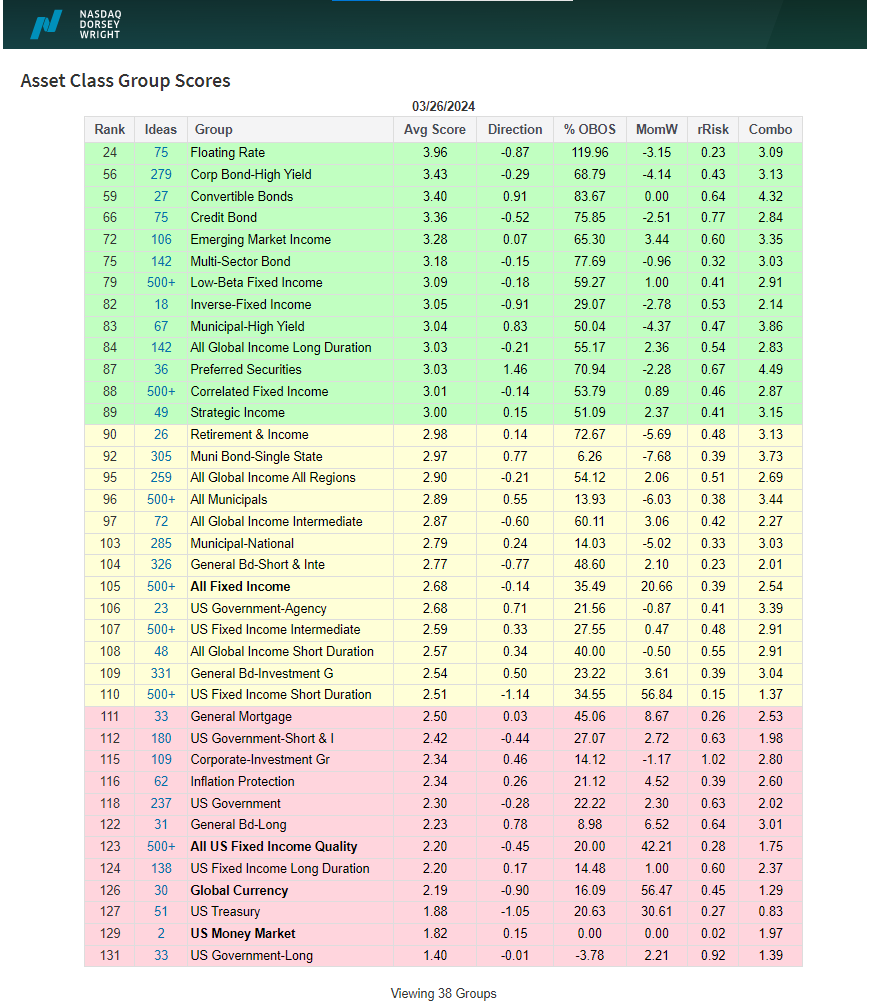
For those wondering how to position in the current market, your best bet may be to look to short-duration bonds and funds. Short-duration US fixed income currently outscores long-duration US fixed income, with an average score of 2.51 vs. 2.20. The possibility that there could be more support for higher yields at the long end of the curve adds another reason to favor short duration over long; and, at least for the time being, short duration US Treasuries still generally offer higher yields than their long-term counterparts - another point in favor of exposure to short maturities.
The fixed income rankings in the Asset Class Group Scores (ACGS) look largely the same as they have for the last couple of months. Floating rates and high yields sit atop the rankings, while most core groups still sit in the red zone with scores below 2.5.
Remember, these are technical comments only. Just as you must be aware of fundamental data for the stocks we recommend based on technical criteria in the report, so too must you be aware of important data regarding delivery, market moving government releases, and other factors that may influence commodity pricing. We try to limit our technical comments to the most actively traded contracts in advance of delivery, but some contracts trade actively right up to delivery while others taper off well in advance. Be sure you check your dates before trading these contracts. For questions regarding this section or additional coverage of commodities email will.gibson@nasdaq.com.
Data represented in the table below is through 3/26/2024:
Broad Market Commodities Report
| Symbol | Name | Price | PnF Trend | RS Signal | RS Col. | 200 Day MA | Weekly Mom |
|---|---|---|---|---|---|---|---|
| CL/ | Crude Oil Continuous | 81.62 | Positive | Buy | X | 78.31 | + 15W |
| DBLCIX | Deutsche Bank Liquid Commodities Index | 477.44 | Positive | Sell | O | 486.14 | + 4W |
| DWACOMMOD | DWA Continuous Commodity Index | 843.57 | Positive | Buy | O | 805.69 | + 12W |
| GC/ | Gold Continuous | 2177.20 | Positive | Sell | O | 1984.48 | + 5W |
| HG/ | Copper Continuous | 4.00 | Positive | Sell | O | 3.78 | + 7W |
| ZG/ | Corn (Electronic Day Session) Continuous | 432.50 | Negative | Sell | O | 480.54 | + 4W |
Weekly Commodities Video (1:43)
Historical data suggests that copper and emerging markets move in parallel. In other words, when copper prices rise, we have typically seen emerging markets appreciate and vice versa. Why?
Like everything else in financial markets, there are many possible variables at play. That said, one of the clearer economic rationales is that many emerging market countries are large exporters of copper and China is reportedly one of the largest consumers (Source: oec.world). So, if the Chinese economic outlook improves then its demand for copper will assumably grow, fueling demand for the emerging market exporting countries. This is probably an oversimplification, but it gets the idea across the line.
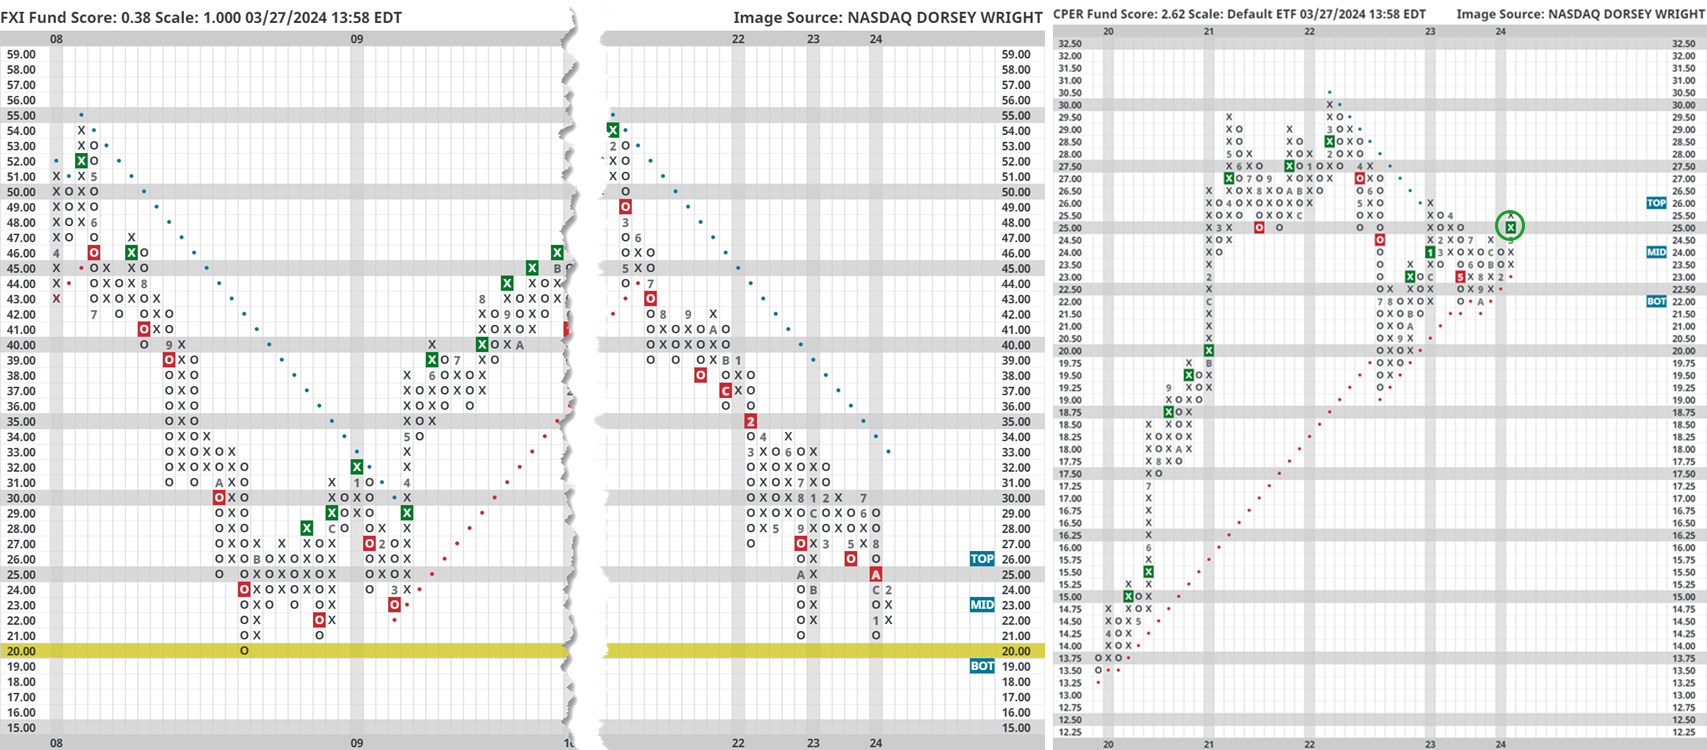
Regardless of the underlying fundamental rationale, the price trend is rather convincing. The left-hand chart below overlays the iShares Emerging Markets ETF (EEM) with the United States Copper Index Fund (CPER) since March 2014. Note that 20-year and since inception charts tell the same story. The right-hand chart below overlays the iShares Emerging Markets ex China ETF (EMXC) with CPER since July 2017 (launch of EMXC).

As seen above, copper and emerging markets often move in parallel (at least during prolonged periods of time). This is especially important to remember today because China is currently fighting to stay above 15-year lows (left-hand chart below) and copper recently returned to a Point & Figure buy signal after nearly falling into a negative trend last year (right-hand chart below).
Should copper push past January and April 2023 resistance, the China contrarian trade could have some tangential confirmation.
Average Level
36.23
| < - -100 | -100 - -80 | -80 - -60 | -60 - -40 | -40 - -20 | -20 - 0 | 0 - 20 | 20 - 40 | 40 - 60 | 60 - 80 | 80 - 100 | 100 - > |
|---|---|---|---|---|---|---|---|---|---|---|---|
|
Buy signalshy
|
Buy signaldvy
|
||||||||||
|
Sell signalief
|
Buy signaldx/y
|
Buy signalgsg
|
Buy signalspy
|
||||||||
|
Buy signaltlt
|
Buy signaliwm
|
Buy signaleem
|
Buy signalrsp
|
||||||||
|
Sell signallqd
|
Buy signalQQQ
|
Buy signalUSO
|
Buy signalIJH
|
||||||||
|
Sell signalfxe
|
Buy signalhyg
|
Buy signaldia
|
Buy signalvoog
|
Buy signalVOOV
|
|||||||
|
Buy signalicf
|
Sell signalagg
|
Buy signalijr
|
Buy signaloneq
|
Buy signalXLG
|
Buy signalefa
|
Buy signalgld
|
Sell signalgcc
|
||||
| < - -100 | -100 - -80 | -80 - -60 | -60 - -40 | -40 - -20 | -20 - 0 | 0 - 20 | 20 - 40 | 40 - 60 | 60 - 80 | 80 - 100 | 100 - > |
| AGG | iShares US Core Bond ETF |
| USO | United States Oil Fund |
| DIA | SPDR Dow Jones Industrial Average ETF |
| DVY | iShares Dow Jones Select Dividend Index ETF |
| DX/Y | NYCE U.S.Dollar Index Spot |
| EFA | iShares MSCI EAFE ETF |
| FXE | Invesco CurrencyShares Euro Trust |
| GLD | SPDR Gold Trust |
| GSG | iShares S&P GSCI Commodity-Indexed Trust |
| HYG | iShares iBoxx $ High Yield Corporate Bond ETF |
| ICF | iShares Cohen & Steers Realty ETF |
| IEF | iShares Barclays 7-10 Yr. Tres. Bond ETF |
| LQD | iShares iBoxx $ Investment Grade Corp. Bond ETF |
| IJH | iShares S&P 400 MidCap Index Fund |
| ONEQ | Fidelity Nasdaq Composite Index Track |
| QQQ | Invesco QQQ Trust |
| RSP | Invesco S&P 500 Equal Weight ETF |
| IWM | iShares Russell 2000 Index ETF |
| SHY | iShares Barclays 1-3 Year Tres. Bond ETF |
| IJR | iShares S&P 600 SmallCap Index Fund |
| SPY | SPDR S&P 500 Index ETF Trust |
| TLT | iShares Barclays 20+ Year Treasury Bond ETF |
| GCC | WisdomTree Continuous Commodity Index Fund |
| VOOG | Vanguard S&P 500 Growth ETF |
| VOOV | Vanguard S&P 500 Value ETF |
| EEM | iShares MSCI Emerging Markets ETF |
| XLG | Invesco S&P 500 Top 50 ETF |
| Symbol | Company | Sector | Current Price | Action Price | Target | Stop | Notes |
|---|---|---|---|---|---|---|---|
| KRG | Kite Realty Group Trust | Real Estate | $20.91 | 19 - 21 | 34.50 | 16 | 5 for 5'er, 11 of 113 in REAL sector matrix, LT pos mkt RS, spread quintuple top, 4.65% yield |
| OEC | Orion SA | Chemicals | $23.25 | 22 - 24 | 45.50 | 19 | 4 for 5'er, top third of CHEM sector matrix, LT pos mkt RS, spread quad top, R-R>5 |
| MNST | Monster Beverage Corp. | Food Beverages/Soap | $59.32 | mid-to-hi 50s | 70 | 47 | 5 for 5'er, top third of FOOD sector matrix, LT pos mkt RS |
| ROP | Roper Technologies Inc. | Software | $554.43 | 510s - 540s | 648 | 432 | 4 for 5'er, top half of favored SOFT sector matrix, LT pos mkt RS, quad top breakout |
| NUE | Nucor Corporation | Steel/Iron | $194.06 | 170s - 180s | 234 | 150 | 4 for 5'er, top half of STEE sector matrix, spread triple top, pullback from ATH, 1.2% yield, Earn. 4/22 |
| TPX | Tempur Sealy International Inc. | Household Goods | $56.07 | 49 - 53 | 80 | 41 | 5 for 5'er, top 25% of HOUS sector matrix, LT pos mkt RS, R-R>3.0 |
| BYD | Boyd Gaming Corp | Gaming | $65.65 | 61 - hi 60s | 87 | 52 | 4 TA rating, top 33% of GAME sector matrix, LT RS buy, buy-on-pullback, Earn. 4/23 |
| CCEP | Coca-Cola Europacific Partners PLC | Food Beverages/Soap | $71.48 | 60s | 97 | 56 | 5 for 5'er, top 25% of FOOD sector matrix, spread quad top, R-R~3.0, 3% yield |
| CXT | Crane NXT Co. | Electronics | $59.95 | hi 50s - low 60s | 76 | 48 | Top half of MACH sector matrix, bullish catapult |
| ODFL | Old Dominion Freight Line, Inc. | Transports/Non Air | $433.62 | 400s - 430s | 516 | 356 | 4 for 5'er, favored TRAN sector matrix, LT pos mkt RS, bullish triangle, Earn. 4/24 |
| SPB | Spectrum Brands Holdings | Food Beverages/Soap | $88.26 | hi 70s - mid 80s | 112 | 65 | 4 TA rating, top quartile of FOOD sector RS matrix, consec. buy signals, buy-on-pullback, R-R > 2 |
| ANSS | Ansys Inc | Software | $350.15 | 330s - 350s | 412 | 300 | 5 for 5'er, favored SOFT sector matrix, triple top, LT pos mkt RS, good R-R |
| MMC | Marsh & McLennan Companies, Inc. | Insurance | $203.37 | 190s - low 200s | 234 | 180 | 5 for 5'er, favored INSU sector, LT pos mkt RS, quad top breakout, 1.4% yield, Earn. 4/18 |
| IT | Gartner, Inc. | Business Products | $475.45 | 440s - 470s | 556 | 380 | 5 for 5'er, top 20% of favored BUSI sector matrix, LT pos mkt RS, quad top breakout |
| BLMN | Bloomin' Brands Inc | Restaurants | $27.75 | hi 20s - low 30s | 41 | 24 | 5 for 5'er, #10 of 27 in REST sector matrix, LT pos mkt RS, quintuple top, R-R>2.0, 3.2% yield |
| EAT | Brinker International Inc | Restaurants | $47.46 | mid 40s - lo 50s | 75 | 37 | 5 TA rating, top 25% of REST sector matrix, LT RS buy, consec. buy signals, R-R > 2.5 |
| HEI | Heico Corporation | Aerospace Airline | $190.48 | 184 - hi 190s | 262 | 152 | 5 TA rating, top half of AERO sector matrix, LT RS buy, near-term consolidation |
| HRB | H&R Block, Inc. | Business Products | $47.42 | mid 40s - lo 50s | 71 | 39 | 5 TA rating, top 33% of BUSI sector matrix, LT pos trend, LT pos. mkt. RS, buy-on-pullback, R-R > 2 |
| IOT | Samsara, Inc. Class A | Software | $39.40 | hi 30s | 65 | 30 | 5 for 5'er, top 20% of favored SOFT sector matrix, spread quad top, R-R>3.0 |
| ANET | Arista Networks Inc | Internet | $297.83 | 280s - 300s | 364 | 252 | 5 for 5'er, #7 of 48 in favored INET sector matrix, LT pos mkt RS, quad top breakout |
| FND | Floor & Decor Holdings Inc | Retailing | $127.86 | lo 120s - lo 130s | 168 | 100 | 5 TA rating, top 20% of RETA sector matrix, pos. mkt. RS, buy-on-pullback |
| BPMC | Blueprint Medicines Corp. | Biomedics/Genetics | $89.73 | hi 80s - low 90s | 109 | 80 | 4 for 5'er, top third of favored BIOM sector matrix, triple top breakout |
| Symbol | Company | Sector | Current Price | Action Price | Target | Stop | Notes |
|---|
| Comment | |||||||
|---|---|---|---|---|---|---|---|
|
|
|||||||
BPMC Blueprint Medicines Corp. R ($94.21) - Biomedics/Genetics - BPMC is a 4 for 5'er that ranks in the top third of the favored biomedics/genetics sector matrix. After giving four consecutive sell signals on its default chart, BPMC broke out to the upside in Tuesday's trading when it completed a triple top at $92. Long exposure may be added in the upper $80s to low $90s and we will set our initial stop at $80 which would take out multiple levels of support on BPMC's chart, including its bullish support line. We will use the bullish price objective, $109, as our target price.
| 24 | ||||||||||||||||||||||||||||||||||||||||||||||||||||
| 100.00 | X | 100.00 | ||||||||||||||||||||||||||||||||||||||||||||||||||
| 99.00 | X | O | 99.00 | |||||||||||||||||||||||||||||||||||||||||||||||||
| 98.00 | X | O | X | 98.00 | ||||||||||||||||||||||||||||||||||||||||||||||||
| 97.00 | X | O | X | O | 97.00 | |||||||||||||||||||||||||||||||||||||||||||||||
| 96.00 | X | O | 3 | O | 96.00 | |||||||||||||||||||||||||||||||||||||||||||||||
| 95.00 | X | O | X | O | 95.00 | |||||||||||||||||||||||||||||||||||||||||||||||
| 94.00 | X | X | X | O | X | O | X | 94.00 | ||||||||||||||||||||||||||||||||||||||||||||
| 93.00 | X | O | 1 | X | O | X | O | O | X | O | 93.00 | |||||||||||||||||||||||||||||||||||||||||
| 92.00 | X | O | X | O | X | O | X | O | X | O | X | X | 92.00 | |||||||||||||||||||||||||||||||||||||||
| 91.00 | X | O | X | O | X | O | X | O | X | O | X | O | X | X | X | 91.00 | ||||||||||||||||||||||||||||||||||||
| 90.00 | X | O | O | X | O | X | O | X | O | X | O | X | O | X | O | X | 90.00 | |||||||||||||||||||||||||||||||||||
| 89.00 | X | O | X | O | X | O | O | X | O | X | O | X | O | X | 89.00 | |||||||||||||||||||||||||||||||||||||
| 88.00 | X | X | O | X | O | X | O | O | X | O | X | O | X | 88.00 | ||||||||||||||||||||||||||||||||||||||
| 87.00 | X | O | X | O | X | X | O | X | O | O | X | O | 87.00 | |||||||||||||||||||||||||||||||||||||||
| 86.00 | X | X | O | X | O | X | O | X | O | X | O | X | Mid | 86.00 | ||||||||||||||||||||||||||||||||||||||
| 85.00 | X | O | X | O | O | X | X | O | X | O | X | O | 85.00 | |||||||||||||||||||||||||||||||||||||||
| 84.00 | X | O | X | O | X | O | X | X | O | X | O | X | • | 84.00 | ||||||||||||||||||||||||||||||||||||||
| 83.00 | X | O | O | X | O | X | O | X | O | X | O | X | • | 83.00 | ||||||||||||||||||||||||||||||||||||||
| 82.00 | X | O | X | O | X | O | X | O | X | O | X | • | 82.00 | |||||||||||||||||||||||||||||||||||||||
| 81.00 | X | O | X | O | X | O | O | X | O | • | 81.00 | |||||||||||||||||||||||||||||||||||||||||
| 80.00 | X | O | X | O | X | O | X | X | • | 80.00 | ||||||||||||||||||||||||||||||||||||||||||
| 79.00 | X | O | X | O | O | 2 | O | X | • | 79.00 | ||||||||||||||||||||||||||||||||||||||||||
| 78.00 | X | O | X | O | X | O | X | X | • | 78.00 | ||||||||||||||||||||||||||||||||||||||||||
| 77.00 | X | O | O | X | O | X | O | X | • | 77.00 | ||||||||||||||||||||||||||||||||||||||||||
| 76.00 | X | O | O | X | O | X | • | 76.00 | ||||||||||||||||||||||||||||||||||||||||||||
| 75.00 | X | X | O | X | O | X | • | 75.00 | ||||||||||||||||||||||||||||||||||||||||||||
| 74.00 | X | X | O | X | O | X | O | X | • | 74.00 | ||||||||||||||||||||||||||||||||||||||||||
| 73.00 | X | O | X | O | X | O | O | • | 73.00 | |||||||||||||||||||||||||||||||||||||||||||
| 72.00 | C | O | X | O | • | 72.00 | ||||||||||||||||||||||||||||||||||||||||||||||
| 71.00 | X | O | • | 71.00 | ||||||||||||||||||||||||||||||||||||||||||||||||
| 70.00 | X | • | 70.00 | |||||||||||||||||||||||||||||||||||||||||||||||||
| 69.00 | X | • | 69.00 | |||||||||||||||||||||||||||||||||||||||||||||||||
| 68.00 | X | • | 68.00 | |||||||||||||||||||||||||||||||||||||||||||||||||
| 67.00 | X | • | 67.00 | |||||||||||||||||||||||||||||||||||||||||||||||||
| 66.00 | X | • | 66.00 | |||||||||||||||||||||||||||||||||||||||||||||||||
| 65.00 | • | X | • | 65.00 | ||||||||||||||||||||||||||||||||||||||||||||||||
| 64.00 | • | X | • | 64.00 | ||||||||||||||||||||||||||||||||||||||||||||||||
| 63.00 | • | X | • | Bot | 63.00 | |||||||||||||||||||||||||||||||||||||||||||||||
| 62.00 | • | X | • | 62.00 | ||||||||||||||||||||||||||||||||||||||||||||||||
| 61.00 | • | X | X | • | 61.00 | |||||||||||||||||||||||||||||||||||||||||||||||
| 60.00 | • | B | O | X | • | 60.00 | ||||||||||||||||||||||||||||||||||||||||||||||
| 59.00 | • | X | O | X | • | 59.00 | ||||||||||||||||||||||||||||||||||||||||||||||
| 58.00 | • | • | X | O | X | • | 58.00 | |||||||||||||||||||||||||||||||||||||||||||||
| 57.00 | X | • | X | O | • | 57.00 | ||||||||||||||||||||||||||||||||||||||||||||||
| 56.00 | X | O | X | • | 56.00 | |||||||||||||||||||||||||||||||||||||||||||||||
| 55.00 | X | O | X | • | 55.00 | |||||||||||||||||||||||||||||||||||||||||||||||
| 54.00 | X | X | O | • | 54.00 | |||||||||||||||||||||||||||||||||||||||||||||||
| 53.00 | X | O | X | • | 53.00 | |||||||||||||||||||||||||||||||||||||||||||||||
| 52.00 | 9 | O | X | X | • | 52.00 | ||||||||||||||||||||||||||||||||||||||||||||||
| 51.00 | X | O | X | O | X | X | X | • | 51.00 | |||||||||||||||||||||||||||||||||||||||||||
| 50.00 | X | O | X | O | X | O | X | O | X | • | 50.00 | |||||||||||||||||||||||||||||||||||||||||
| 49.00 | X | O | A | X | O | X | O | X | • | 49.00 | ||||||||||||||||||||||||||||||||||||||||||
| 48.00 | O | X | O | O | X | • | 48.00 | |||||||||||||||||||||||||||||||||||||||||||||
| 47.00 | O | X | O | X | • | 47.00 | ||||||||||||||||||||||||||||||||||||||||||||||
| 46.00 | O | O | X | • | 46.00 | |||||||||||||||||||||||||||||||||||||||||||||||
| 45.00 | O | X | • | 45.00 | ||||||||||||||||||||||||||||||||||||||||||||||||
| 44.00 | O | • | 44.00 | |||||||||||||||||||||||||||||||||||||||||||||||||
| 24 |
| BBWI Bath & Body Works Inc. ($49.01) - Retailing - BBWI broke a double top at $49 for a third consecutive buy signal as the stock rallied to match the February 2023 chart high. The stock is a 4 for 5'er that ranks in the top quintile of the Retailing sector matrix and is accompanied by a yield of roughly 1.7%. Okay to consider here on the breakout or on a pullback to $46 on the chart. From here, a move to $50 would mark a multi-year high. Initial support lies at $44 while additional can be found at $41. |
| BOOT Boot Barn Holdings Inc ($91.14) - Retailing - BOOT reversed back into Xs and broke a double top at $89 to return to a buy signal as the stock rallied to $91. The stock is a 5 for 5'er that ranks in the top half of the Retailing sector matrix. Monthly momentum has also flipped back positive. Okay to consider here on the breakout or on a pullback to $88 on the chart. Initial support lies at $85, while additional can be found at $83. |
| IFF International Flavors & Fragrances Inc. ($85.64) - Food Beverages/Soap - Since our last comment, the technical picture has materially improved for IFF. The stock is now a 3 for 5'er and recently broke out of a trading range; that said, we would like to see follow through to relative strength buy signals. The next level of resistance is positioned at $88. Support is offered at $81. |
| MRK Merck & Co., Inc. ($131.82) - Drugs - MRK shares moved higher today to break a double top at $132 to mark its second consecutive buy signal and a new all-time high. This 4 for 5'er has been in a positive trend since October 2022 but on an RS sell signal versus the market since April 2021. MRK shares are trading near the top of their trading band. From here, support is offered at $120. |
| SPT Sprout Social Inc Class A ($60.07) - Software - SPT moved higher Wednesday to break a double top at $62, which also returned the stock to a positive trend and promotes it to a 4 for 5 TA rating. This ends a streak of three consecutive sell signals over the past several weeks, indicating that demand may be taking back control of the price action. Initial support is now seen at $55. |
| W Wayfair Inc. ($67.57) - Retailing - W broke a triple top at $67 for a fifth consecutive buy signal since February as the stock rallied to $69 to match the December 2023 chart high. W is a 5 for 5'er that ranks in the top quartile of the Retailing sector matrix. Monthly momentum has flipped back positive. Okay to consider here on the breakout or on a pullback to $66 on the chart. From here, a move to 470 would mark a 52-week high. Initial support lies at $63, while additional can be found at $59 and $58, the bullish support line. |
| Name | Option Symbol | Action | Stop Loss |
|---|---|---|---|
| CSX Corporation - $36.63 | CSX2421F37.5 | Buy the June 37.50 calls at 1.20 | 33.00 |
| Name | Option | Action |
|---|---|---|
| Capital One Financial Corporation ( COF) | Jun. 135.00 Calls | Raise the option stop loss to 12.50 (CP: 13.50) |
| The TJX Companies, Inc. ( TJX) | Jun. 95.00 Calls | Initiate an option stop loss of 6.15 (CP: 8.15) |
| Name | Option Symbol | Action | Stop Loss |
|---|---|---|---|
| United Airlines Holdings Inc. - $47.11 | UAL2419S47 | Buy the July 47.00 puts at 3.55 | 51.00 |
| Name | Option | Action |
|---|---|---|
| Realty Income Corporation ( O) | May. 55.00 Puts | Stopped at 2.40 (CP: 2.30) |
| Alcoa Inc. ( AA) | Jun. 30.00 Puts | Stopped at 33.00 (CP: 33.02) |
| Air Products & Chemicals, Inc. ( APD) | Jun. 250.00 Puts | Stopped at 17.20 (CP: 15.00) |
| The Boeing Company ( BA) | Jul. 195.00 Puts | Stopped at 14.15 (CP: 13.70) |
| Name | Option Sym. | Call to Sell | Call Price | Investment for 500 Shares | Annual Called Rtn. | Annual Static Rtn. | Downside Protection |
|---|---|---|---|---|---|---|---|
| Lyft Inc Class A $ 19.64 | LYFT2419G20 | Jul. 20.00 | 2.63 | $ 8,394.15 | 57.59% | 45.99% | 12.56% |
| Name | Action |
|---|---|
| Uber Technologies, Inc. ( UBER) - 77.91 | Sell the June 80.00 Calls. |
| Applied Materials, Inc. ( AMAT) - 206.67 | Sell the June 210.00 Calls. |
| Palantir Technologies Inc. Class A ( PLTR) - 24.89 | Sell the June 26.00 Calls. |
| Advanced Micro Devices, Inc. ( AMD) - 177.87 | Sell the June 180.00 Calls. |
| Hewlett Packard Enterprise Company ( HPE) - 17.69 | Sell the August 18.00 Calls. |
| Ally Financial Inc. ( ALLY) - 39.18 | Sell the June 40.00 Calls. |
| Block Inc ( SQ) - 83.80 | Sell the July 87.50 Calls. |
| Name | Covered Write |
|---|---|
| Cleveland-Cliffs Inc. ( CLF - 21.57 ) | June 21.00 covered write. |
| Carnival Corporation ( CCL - 17.03 ) | June 16.00 covered write. |
| Bath & Body Works Inc. ( BBWI - 47.98 ) | June 47.50 covered write. |
Daily Equity & Market Analysis
Loading, Please Wait...
