Copper and emerging markets typically move in parallel, an especially important relationship to note right now as China looks for a bottom and copper recently broke out.
Remember, these are technical comments only. Just as you must be aware of fundamental data for the stocks we recommend based on technical criteria in the report, so too must you be aware of important data regarding delivery, market moving government releases, and other factors that may influence commodity pricing. We try to limit our technical comments to the most actively traded contracts in advance of delivery, but some contracts trade actively right up to delivery while others taper off well in advance. Be sure you check your dates before trading these contracts. For questions regarding this section or additional coverage of commodities email will.gibson@nasdaq.com.
Data represented in the table below is through 3/26/2024:
Broad Market Commodities Report
Portfolio View - Commodity Indices
| Symbol | Name | Price | PnF Trend | RS Signal | RS Col. | 200 Day MA | Weekly Mom |
|---|---|---|---|---|---|---|---|
| CL/ | Crude Oil Continuous | 81.62 | Positive | Buy | X | 78.31 | + 15W |
| DBLCIX | Deutsche Bank Liquid Commodities Index | 477.44 | Positive | Sell | O | 486.14 | + 4W |
| DWACOMMOD | DWA Continuous Commodity Index | 843.57 | Positive | Buy | O | 805.69 | + 12W |
| GC/ | Gold Continuous | 2177.20 | Positive | Sell | O | 1984.48 | + 5W |
| HG/ | Copper Continuous | 4.00 | Positive | Sell | O | 3.78 | + 7W |
| ZG/ | Corn (Electronic Day Session) Continuous | 432.50 | Negative | Sell | O | 480.54 | + 4W |
Weekly Commodities Video (1:43)
Historical data suggests that copper and emerging markets move in parallel. In other words, when copper prices rise, we have typically seen emerging markets appreciate and vice versa. Why?
Like everything else in financial markets, there are many possible variables at play. That said, one of the clearer economic rationales is that many emerging market countries are large exporters of copper and China is reportedly one of the largest consumers (Source: oec.world). So, if the Chinese economic outlook improves then its demand for copper will assumably grow, fueling demand for the emerging market exporting countries. This is probably an oversimplification, but it gets the idea across the line.
Regardless of the underlying fundamental rationale, the price trend is rather convincing. The left-hand chart below overlays the iShares Emerging Markets ETF (EEM) with the United States Copper Index Fund (CPER) since March 2014. Note that 20-year and since inception charts tell the same story. The right-hand chart below overlays the iShares Emerging Markets ex China ETF (EMXC) with CPER since July 2017 (launch of EMXC).

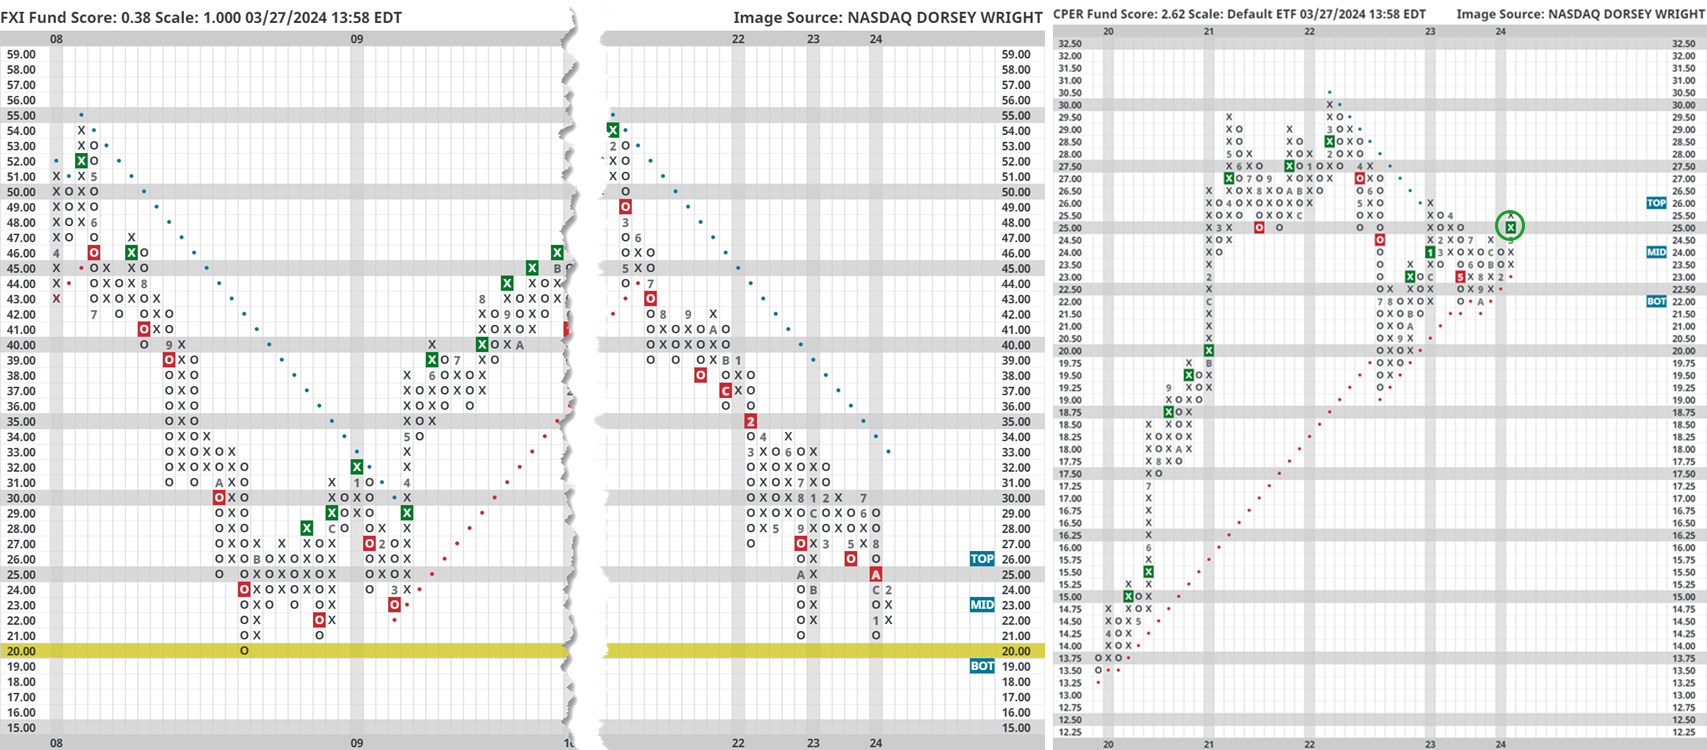
As seen above, copper and emerging markets often move in parallel (at least during prolonged periods of time). This is especially important to remember today because China is currently fighting to stay above 15-year lows (left-hand chart below) and copper recently returned to a Point & Figure buy signal after nearly falling into a negative trend last year (right-hand chart below).
Should copper push past January and April 2023 resistance, the China contrarian trade could have some tangential confirmation.