With the first quarter of 2024 nearing a close and next week’s report consisting of quarterly performance reviews, we wanted to take time to note where relative improvement and deterioration have occurred within the sector rankings.
Check out this week's Major Index and DALI Overview (3:30)
With US Equities indices trading near all-time highs in most cases, Domestic Equities maintains its firm lead over International Equities and Commodities. Under the hood of Domestic Equities, there haven’t been any changes to the sector rankings since early February – which is good news for momentum/RS-based strategies as they can capitalize on leadership trends. But while there haven’t necessarily been changes to the rankings, that doesn’t mean there haven’t been tally signals exchange among the underlying sector representatives. With the first quarter of 2024 nearing a close and next week’s report consisting of quarterly performance reviews, we wanted to take time to note where relative improvement and deterioration have occurred within the sector rankings.

While the above image highlights the lack of ranking changes since February, the daily sector tally (or buy signal) counts show what action has transpired during March. Technology continues to maintain its lead among the sectors and has shown relative improvement during March as it picked up another seven signals. Tech is only the second most improved sector in March as Financials has added another eight tally signals during March to be the most improved. Financials now ranks as the second most improved sector within DALI rankings year-to-date and continues to be supported by the Finance and Insurance subsectors. Although Consumer Discretionary currently ranks as the second worst performing SPDR ETF on an absolute basis during March, down 1.12%, subsectors like Homebuilding, Leisure, and Autos and Parts, provided for some relative improvement. Discretionary maintains as the third most improved sector from a relative standpoint during March and on a year-to-date basis.
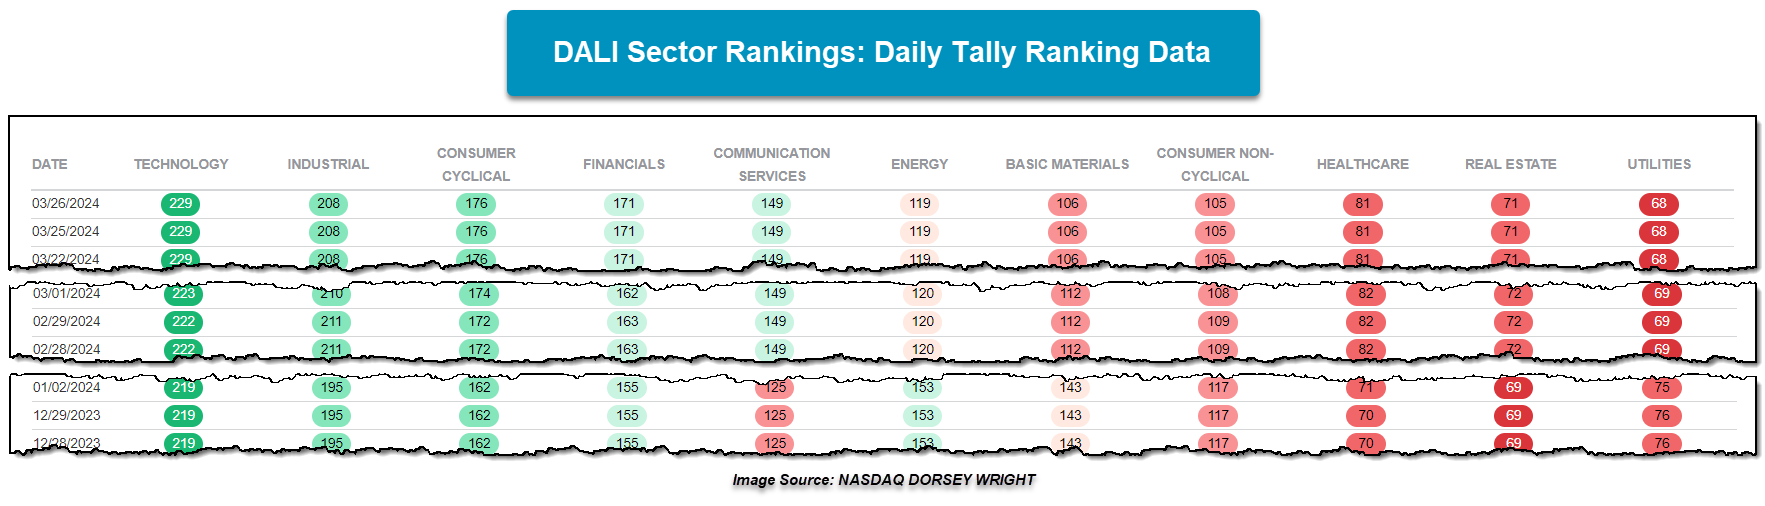
Beyond the three aforementioned sectors above, pretty much all other sectors – except Industrials – have shed just one tally signal during March. As of Tuesday’s close, Industrials stands as the sector with the most relative deterioration in the sector rankings during March, albeit in a small way, with a loss of three tally signals.
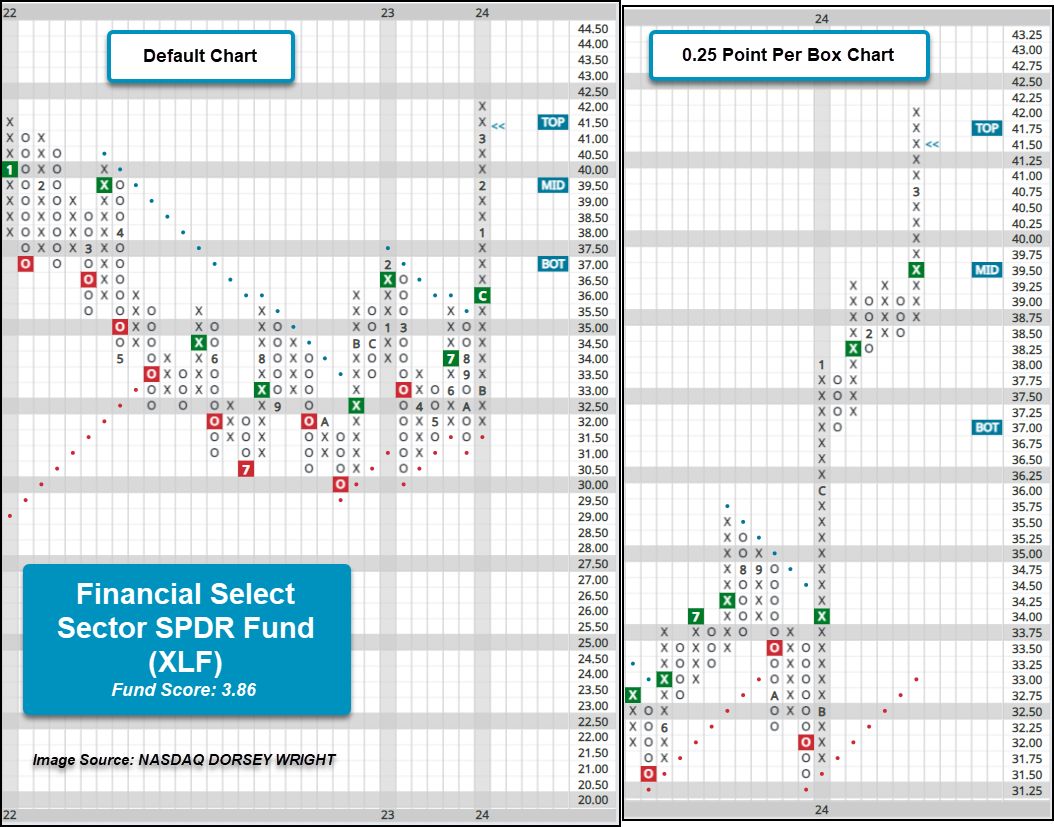
On an absolute basis, laggard sectors like Energy XLE and Basic Materials XLB have been the best-performing ETFs during March, up 7.43% and 4.31%, but have yet to make relative gains. Additionally, each fund has rallied to resistance, but it is worth noting that XLB is testing its all-time chart high. While Materials looks to be the fifth SPDR fund to mark a new all-time high, Financials XLF became the fourth SPDR fund to do so with action over this past week. During last Friday’s trading, XLF rallied above the $42 level to mark a new all-time high for the first time in roughly 26 months. On the default chart, XLF has maintained a buy signal since July of last year and shifted back into a positive trend following a second buy signal in December. XLF’s fund score resides at 3.86, near a two-year high, and is coupled with an intensely positive score direction of 2.98. The fund has been in a column of Xs on its default trend chart since November 2023 and now trades almost 25% above current support levels. On the more sensitive 0.25 point per box chart, support can be found in the lower-$38 range at $37. The fund’s rally has put XLF in overbought territory so those seeking exposure may look to add on a pullback into the $40 to $41 range.