Most Requested Symbols

Save the date for Catapult 2024, our refreshed annual conference that will be held October 15 - 17, 2024, in Nashville! Registration is opening soon.
The curve has an average reading of 35.98%.
Today's featured stock is Advanced Micro Devices, Inc. (AMD).
CSGP, ADBE, ETSY, HAL, DVN, & WLK.
Call: T-Mobile (TMUS); Put: JD.COM Inc (JD); Covered Write: Macerich Co (MAC).
NDW Morning Update Video - March 18, 2024
NDW Morning Update Video – March 18, 2024.
Click here to download MP3
European equities have been on quite the run over the past several weeks. The Dow Jones STOXX 600 Price Index SXXP has advanced for eight consecutive weeks, notching an improvement of 7.92% over that span. There have only been five other periods that have seen as long or a longer stretch of gains for SXXP dating back to the origin of our data in 1999. The most recent ended on 5/18/2018, which saw the index rise 7.89%. Prior to that, we saw another 8-week period end on 6/6/2014, then two 11 week stretches in 2012 and 2005, and the longest duration at 12 consecutive weeks of improvement end in January 2006. Since these dates inherently highlight at least a near-term price peak, running forward performance after the streaks end shows some near-term consolidation that averages a loss of almost 1% over the following week. However, seeing long streaks of gains may be a good sign for further long-term improvement in Europe. As we get 6 months out from the ending of these streaks, four out of the five other instances showed improvement in SXXP, at an average return of 2.22%, besting the average 6-month return from any date (1.34%). That improves drastically as we look one year out, with every instance except for 2018 showing a double-digit gain for SXXP after the positive return streak ended.
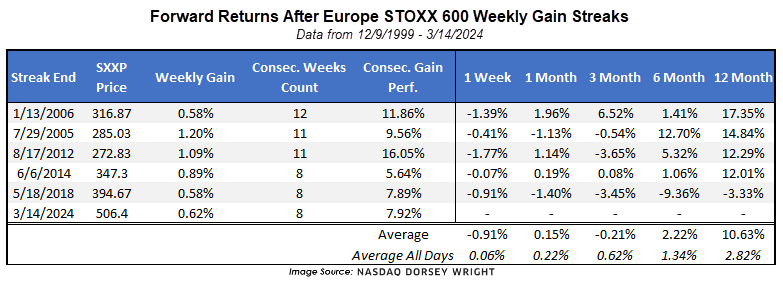
Reviewing past performance can help provide perspective on what we might expect moving forward, but we know that no two instances are going to be alike. We also have a very limited sample size of extended gains for the STOXX 600 Index, and international equities showed weaker relative strength when compared to domestic equities throughout most of our lookback window. Still, the consistent improvement in Europe should at least be on your radar in the back half of March.
The STOXX 600 Index SXXP just reached a new all-time high last week as the chart crossed above the early 2022 peak in the high $490s to its current position at $505. The technical picture is perhaps better viewed through the 5-point chart, which shows consistent directional movement over the past few years. After reaching the $495 point in January 2022, SXXP entered a clearly defined negative trend along with most global equities throughout 2022. The index then bottomed at $380 in October, moved into a positive trend by November, and rose higher until August, when the U.S. dollar showed a sharp reversal in its directional movement. After uncertainty through October 2023, the last few months have seen sharp improvement, as demonstrated by the consecutive weekly gain streak. Should that streak end, the first level of support would not be seen until around $465, which is also just below the rally highs from 2023. Further support from there can be seen around $430 from last October.


Sir John Templeton is attributed with the quote, “Bull markets are born on pessimism, grow on skepticism, mature on optimism, and die on euphoria.” While an agreeable quote, in the moment it is extremely difficult to identify a crowd that’s overly pessimistic, skeptical, optimistic, or euphoric. Hindsight is (usually) 20/20. As students of the market, we can study patterns of investor behavior and more easily highlight times when things were stretched, but again, when it comes to the present it seems far more unclear.
Investor sentiment surveys, like the popular American Association of Individual Investors (AAII) Weekly Survey, give an idea of where the pendulum might sit between greed and fear. The key word is might because what people say and what people do can be two very different things. For example, investors might say they are bearish on the stock market for the next six months but still buy equities anytime the S&P 500 drops 5%.
Or, as observed throughout 2022, bearish sentiment might be loudly prevalent, yet equity exposure remains high for lack of better alternatives. There are also the rhetorical questions, “Why would smart money tell “dumb” money what they’re doing?” Questions like this are fading, but the point is that sentiment and actual supply/demand for equities (or any asset) can easily diverge.
So, what is our reason for looking at sentiment data today? Sentiment readings are often best used as contrarian signals at the extremes. Put more directly, if everyone gets on one side of the boat it will sink – an excess of bullish expectations is bearish while an excess of bearish expectations is bullish…or so we are trained to think.
Last week (3/6) over 50% of AAII Members felt the stock market would be higher in six months, and for the prior three weeks at least 40% of Members were bullish/felt the same. That magnitude and persistence of bullish sentiment is surprisingly rare as seen on the Point & Figure chart below which plots the four-week average AAII Bulls reading.
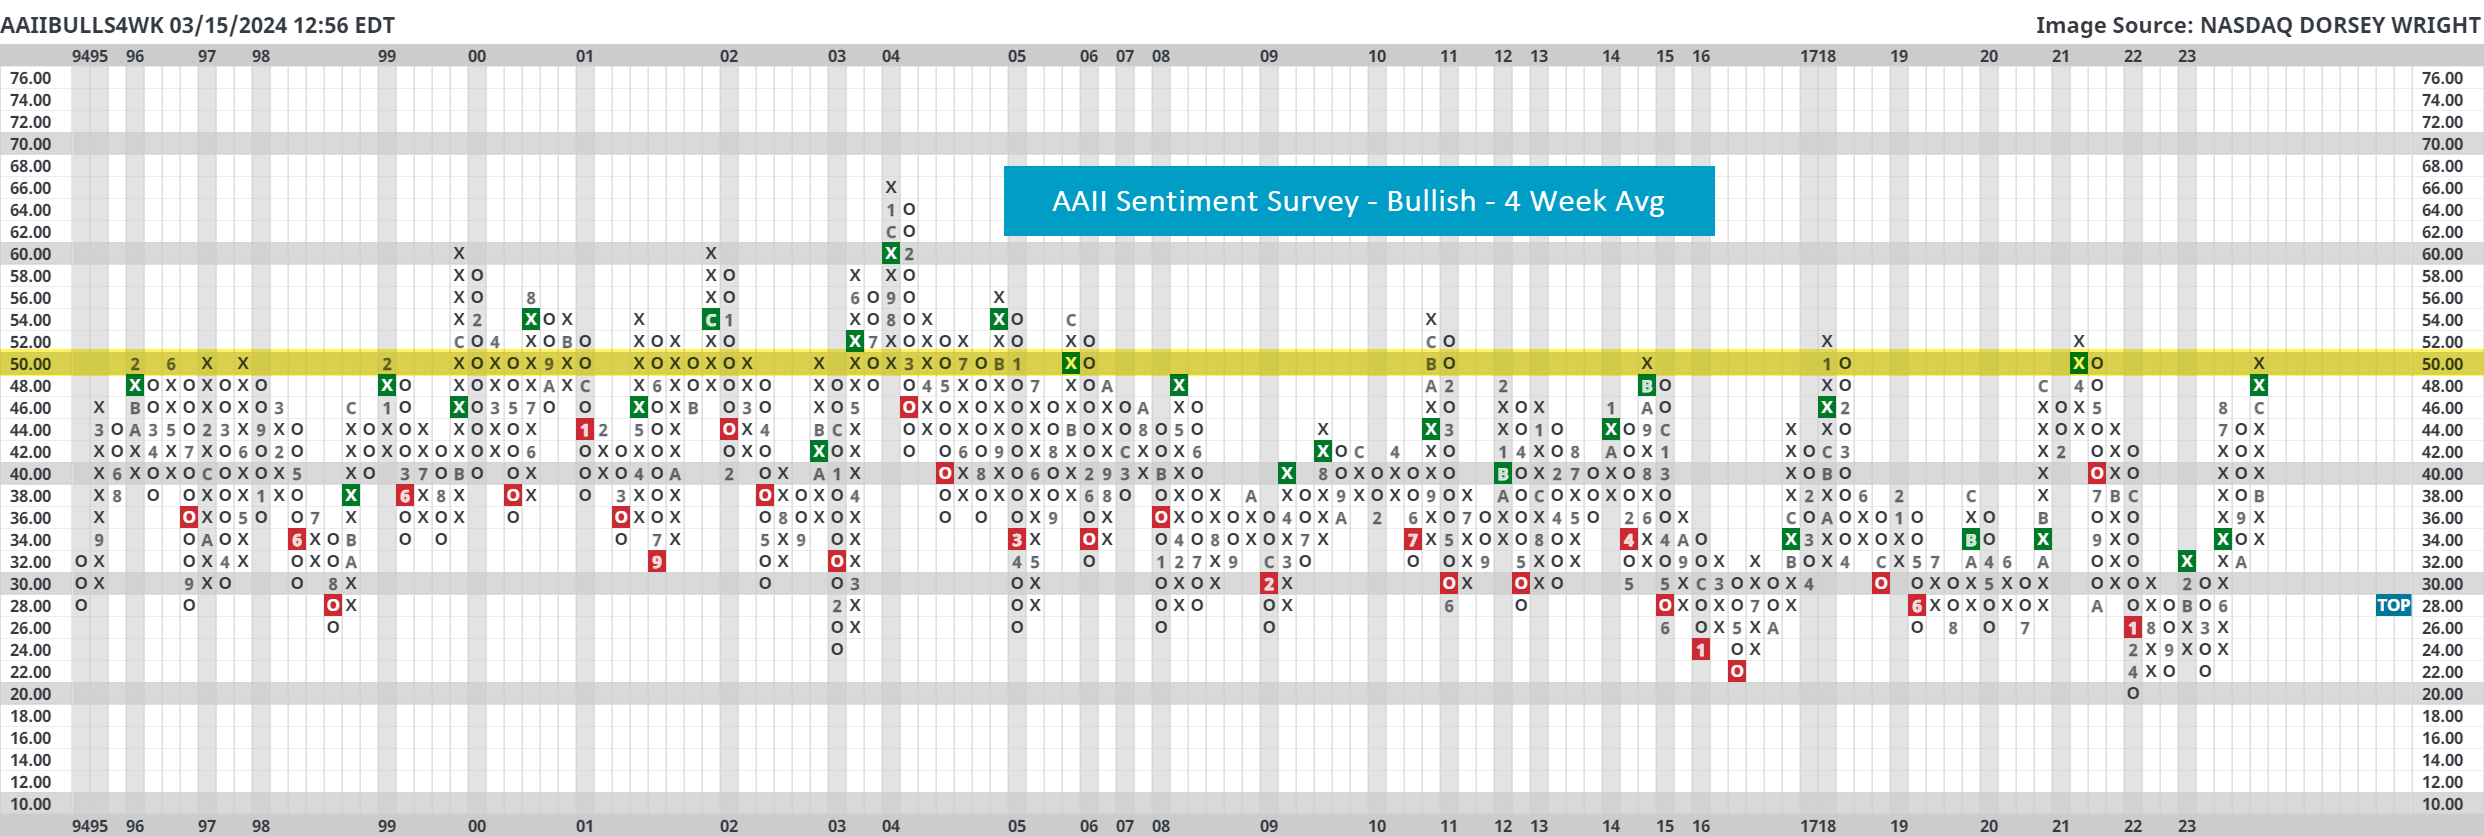
Trips to the 50% level are few and far between. On December 21st of 2023, the four-week AAII Bulls reading eclipsed 50% for the first time since April 2021, and the chart remains there today. Before April 2021 it last crossed 50% on January 2018. As you may expect, this reading reached the 50% threshold much more often in the early 2000s and 1990s.
Based off first glance, a 50% AAII Bulls four-week average would seem bearish for markets going forward. To use our earlier analogy, it appears as if everyone is on one side of the boat…and by a large amount compared to history.
The table below lists each of the dates that the AAII Bulls 4-Week Average Chart (AAIIBULLS4WK) first charted 50% and forward performance after each of those instances. Note that we removed duplicate occurrences within six months and all returns shown include the reinvestment of dividends. Also, recognize that the S&P 500 Equal Weight Index (SPXEWI) data began in 1990. We summarized our takeaways below the table.
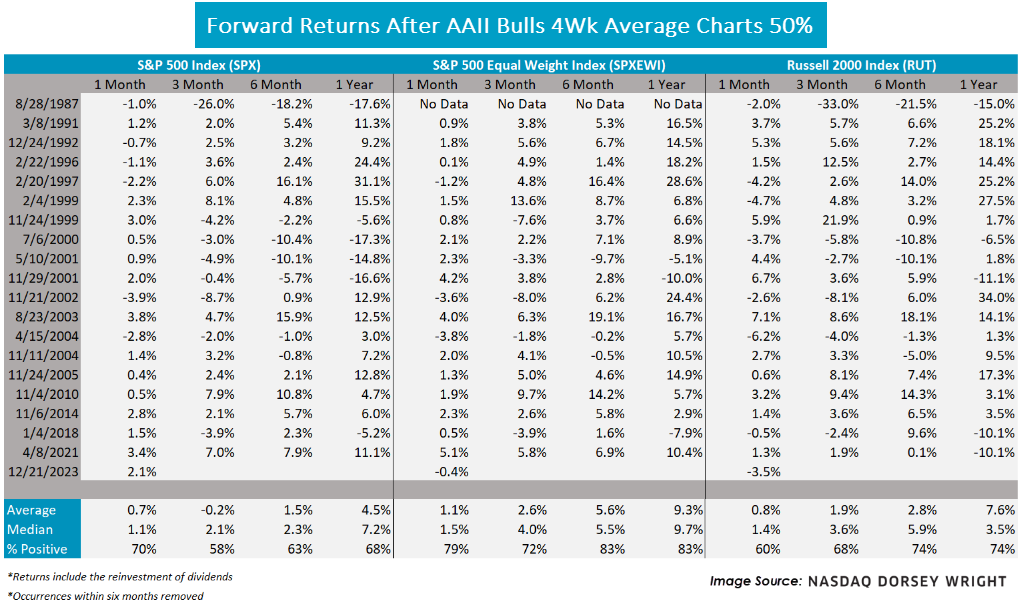
As markets rise investor sentiment tends to follow. In modern English, some would attribute this to FOMO (Fear of Missing Out). That said, returns seem to be milder on average compared to washout scenarios which makes sense because markets likely ran up ahead of these extremely bullish sentiment readings. So, the point today is to not be scared of lofty sentiment readings; furthermore, perhaps in a strange way, some amount of FOMO is good for equities. If there is no fear of missing out, then demand could run dry.

| Symbol | Name | Price | Yield | PnF Trend | RS Signal | RS Col. | Fund Score | 200 Day MA | Weekly Mom |
|---|---|---|---|---|---|---|---|---|---|
| DIA | SPDR Dow Jones Industrial Average ETF Trust | 390.07 | 1.74 | Positive | Sell | X | 4.08 | 356.08 | - 10W |
| EEM | iShares MSCI Emerging Markets ETF | 41.02 | 2.63 | Positive | Sell | O | 2.61 | 39.29 | + 5W |
| EFA | iShares MSCI EAFE ETF | 78.86 | 2.90 | Positive | Sell | X | 4.08 | 72.46 | + 4W |
| FM | iShares Frontier and Select EM ETF | 27.86 | 3.51 | Positive | Sell | O | 3.23 | 26.44 | + 3W |
| IJH | iShares S&P MidCap 400 Index Fund | 58.56 | 1.40 | Positive | Buy | O | 4.48 | 52.60 | + 4W |
| IJR | iShares S&P SmallCap 600 Index Fund | 105.68 | 1.32 | Positive | Sell | O | 2.66 | 100.02 | - 1W |
| QQQ | Invesco QQQ Trust | 439.14 | 0.58 | Positive | Buy | X | 5.62 | 386.42 | - 4W |
| RSP | Invesco S&P 500 Equal Weight ETF | 164.74 | 1.58 | Positive | Sell | O | 3.15 | 150.21 | + 4W |
| SPY | SPDR S&P 500 ETF Trust | 514.95 | 1.30 | Positive | Sell | X | 4.58 | 456.06 | - 2W |
| XLG | Invesco S&P 500 Top 50 ETF | 41.80 | 0.89 | Positive | Buy | X | 5.82 | 36.41 | - 2W |
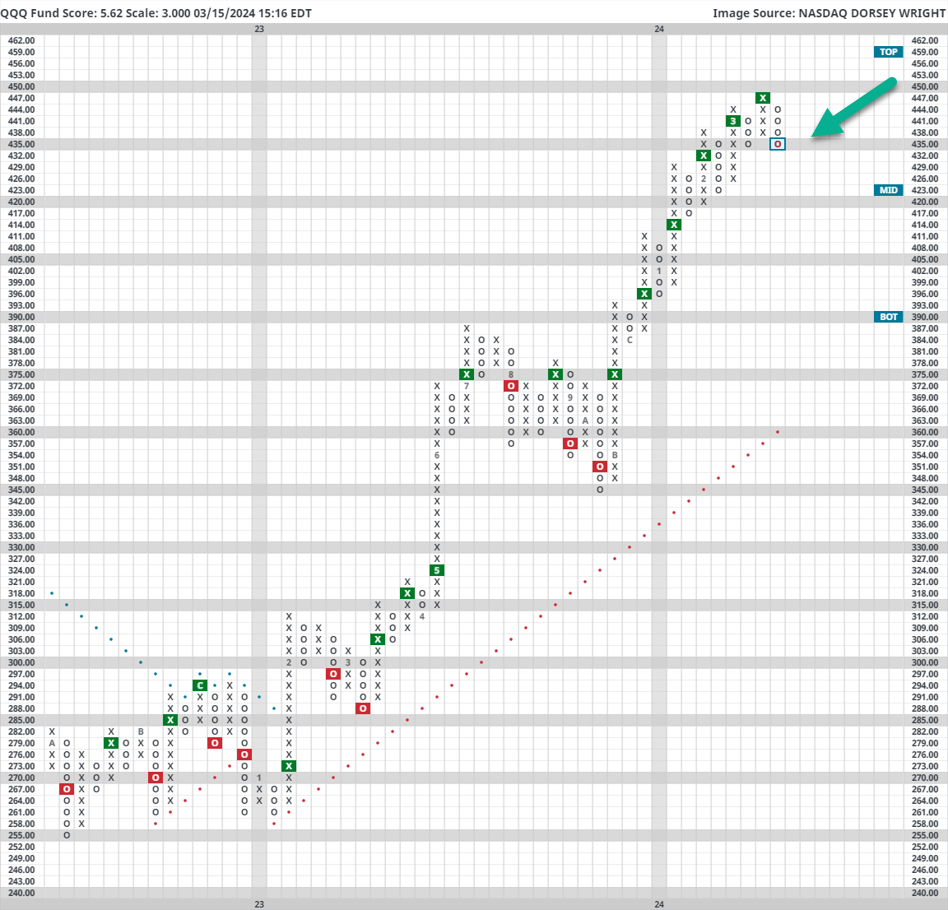
Featured Chart- Invesco QQQ 3-Point Chart
There were no notable changes to any of the major market ETF default charts over the last seven days. However, as other asset classes begin to show some signs of technical improvement, it can be useful to monitor those areas that have been holding strength for quite some time. While still extended on its default chart, the 3-point chart for QQQ reveals a slight pullback to relevant support nearby. While by no means concerning, NDW analysts would like to see risk-on assets continue higher after a healthy pullback. QQQ maintains a strong 5.62 fund score and is on a string of 6 consecutive buy signals on this sensitive 3-point chart, so while the path of least resistance is higher continue to monitor QQQ as a tech-focused proxy.
Average Level
35.98
| < - -100 | -100 - -80 | -80 - -60 | -60 - -40 | -40 - -20 | -20 - 0 | 0 - 20 | 20 - 40 | 40 - 60 | 60 - 80 | 80 - 100 | 100 - > |
|---|---|---|---|---|---|---|---|---|---|---|---|
|
Buy signalQQQ
|
|||||||||||
|
Buy signaldia
|
Buy signalvoog
|
||||||||||
|
Buy signaldvy
|
Buy signaleem
|
||||||||||
|
Sell signalagg
|
Buy signalhyg
|
Buy signaloneq
|
Buy signalIJH
|
Buy signalspy
|
|||||||
|
Buy signalshy
|
Sell signaltlt
|
Buy signaldx/y
|
Buy signalicf
|
Buy signalUSO
|
Buy signalrsp
|
Buy signalefa
|
Buy signalgld
|
||||
|
Sell signalief
|
Sell signallqd
|
Buy signalijr
|
Sell signalfxe
|
Buy signaliwm
|
Buy signalgsg
|
Buy signalXLG
|
Buy signalVOOV
|
Sell signalgcc
|
|||
| < - -100 | -100 - -80 | -80 - -60 | -60 - -40 | -40 - -20 | -20 - 0 | 0 - 20 | 20 - 40 | 40 - 60 | 60 - 80 | 80 - 100 | 100 - > |
| AGG | iShares US Core Bond ETF |
| USO | United States Oil Fund |
| DIA | SPDR Dow Jones Industrial Average ETF |
| DVY | iShares Dow Jones Select Dividend Index ETF |
| DX/Y | NYCE U.S.Dollar Index Spot |
| EFA | iShares MSCI EAFE ETF |
| FXE | Invesco CurrencyShares Euro Trust |
| GLD | SPDR Gold Trust |
| GSG | iShares S&P GSCI Commodity-Indexed Trust |
| HYG | iShares iBoxx $ High Yield Corporate Bond ETF |
| ICF | iShares Cohen & Steers Realty ETF |
| IEF | iShares Barclays 7-10 Yr. Tres. Bond ETF |
| LQD | iShares iBoxx $ Investment Grade Corp. Bond ETF |
| IJH | iShares S&P 400 MidCap Index Fund |
| ONEQ | Fidelity Nasdaq Composite Index Track |
| QQQ | Invesco QQQ Trust |
| RSP | Invesco S&P 500 Equal Weight ETF |
| IWM | iShares Russell 2000 Index ETF |
| SHY | iShares Barclays 1-3 Year Tres. Bond ETF |
| IJR | iShares S&P 600 SmallCap Index Fund |
| SPY | SPDR S&P 500 Index ETF Trust |
| TLT | iShares Barclays 20+ Year Treasury Bond ETF |
| GCC | WisdomTree Continuous Commodity Index Fund |
| VOOG | Vanguard S&P 500 Growth ETF |
| VOOV | Vanguard S&P 500 Value ETF |
| EEM | iShares MSCI Emerging Markets ETF |
| XLG | Invesco S&P 500 Top 50 ETF |

| Symbol | Company | Sector | Current Price | Action Price | Target | Stop | Notes |
|---|---|---|---|---|---|---|---|
| KRG | Kite Realty Group Trust | Real Estate | $20.78 | 19 - 21 | 34.50 | 16 | 5 for 5'er, 11 of 113 in REAL sector matrix, LT pos mkt RS, spread quintuple top, 4.65% yield |
| ING | Ing Groep N.V. -Sponsored (Netherlands) ADR | Insurance | $15.26 | 13.50 - 15 | 27 | 12 | 4 for 5'er, triple top, R-R>5, 6% yield |
| OEC | Orion SA | Chemicals | $22.41 | 22 - 24 | 45.50 | 19 | 4 for 5'er, top third of CHEM sector matrix, LT pos mkt RS, spread quad top, R-R>5 |
| MNST | Monster Beverage Corp. | Food Beverages/Soap | $60.32 | mid-to-hi 50s | 70 | 47 | 5 for 5'er, top third of FOOD sector matrix, LT pos mkt RS |
| RUSHA | Rush Enterprises, Inc. | Autos and Parts | $48.38 | 43 - hi 40s | 81 | 37 | 5 TA rating, top 33% of AUTO sector matrix, LT RS buy, R-R > 3.5 |
| INTU | Intuit Inc. | Software | $650.04 | 600s - 650s | 824 | 504 | 5 TA rating, top 20% of SOFT sector matrix, consec. buy signals, LT RS buy, buy on pullback |
| ROP | Roper Technologies Inc. | Software | $547.08 | 510s - 540s | 648 | 432 | 4 for 5'er, top half of favored SOFT sector matrix, LT pos mkt RS, quad top breakout |
| NUE | Nucor Corporation | Steel/Iron | $182.09 | 170s - 180s | 234 | 150 | 4 for 5'er, top half of STEE sector matrix, spread triple top, pullback from ATH, 1.2% yield |
| TPX | Tempur Sealy International Inc. | Household Goods | $54.47 | 49 - 53 | 80 | 41 | 5 for 5'er, top 25% of HOUS sector matrix, LT pos mkt RS, R-R>3.0 |
| BYD | Boyd Gaming Corp | Gaming | $61.83 | 61 - hi 60s | 87 | 52 | 4 TA rating, top 33% of GAME sector matrix, LT RS buy, buy-on-pullback |
| CCEP | Coca-Cola Europacific Partners PLC | Food Beverages/Soap | $71.99 | 60s | 97 | 56 | 5 for 5'er, top 25% of FOOD sector matrix, spread quad top, R-R~3.0, 3% yield |
| CXT | Crane NXT Co. | Electronics | $59.89 | hi 50s - low 60s | 76 | 48 | Top half of MACH sector matrix, bullish catapult |
| GD | General Dynamics Corporation | Aerospace Airline | $275.40 | mid 250s - mid 270s | 352 | 220 | 4 TA rating, top 33% of AERO matrix, LT RS buy, consec. buy signals, pos. wkly. mom. |
| ODFL | Old Dominion Freight Line, Inc. | Transports/Non Air | $426.71 | 400s - 430s | 516 | 356 | 4 for 5'er, favored TRAN sector matrix, LT pos mkt RS, bullish triangle |
| SPB | Spectrum Brands Holdings | Food Beverages/Soap | $83.37 | hi 70s - mid 80s | 112 | 65 | 4 TA rating, top quartile of FOOD sector RS matrix, consec. buy signals, buy-on-pullback, R-R > 2 |
| ANSS | Ansys Inc | Software | $330.49 | 330s - 350s | 412 | 300 | 5 for 5'er, favored SOFT sector matrix, triple top, LT pos mkt RS, good R-R |
| MMC | Marsh & McLennan Companies, Inc. | Insurance | $207.74 | 190s - low 200s | 234 | 180 | 5 for 5'er, favored INSU sector, LT pos mkt RS, quad top breakout, 1.4% yield |
| STLD | Steel Dynamics Inc. | Steel/Iron | $132.16 | lo 120s - mid 130s | 174 | 106 | 4 TA rating, top 33% of STEE sector matrix, LT RS buy, buy-on-pullback, R-R > 2 |
| GMS | GMS Inc. | Building | $92.52 | hi 80s - low 90s | 106 | 77 | 5 for 5'er, top half of BUIL sector matrix, LT pos mkt RS, multiple consec buy signals, 1.5% yield |
| ALLY | Ally Financial Inc. | Finance | $37.59 | 32 - hi 30s | 60 | 29 | 4 TA rating, top 20% of FINA sector matrix, LT RS buy, buy-on-pullback, R-R > 3 |
| IT | Gartner, Inc. | Business Products | $468.94 | 440s - 470s | 556 | 380 | 5 for 5'er, top 20% of favored BUSI sector matrix, LT pos mkt RS, quad top breakout |
| BLMN | Bloomin' Brands Inc | Restaurants | $28.51 | hi 20s - low 30s | 41 | 24 | 5 for 5'er, #10 of 27 in REST sector matrix, LT pos mkt RS, quintuple top, R-R>2.0, 3.2% yield |
| CLH | Clean Harbors Inc | Waste Management | $188.56 | hi 170s - lo 190s | 230 | 154 | 5 TA rating, top 20% of WAST sector matrix, LT RS buy, pos. monthly mom., buy-on-pullback |
| EAT | Brinker International Inc | Restaurants | $47.52 | mid 40s - lo 50s | 75 | 37 | 5 TA rating, top 25% of REST sector matrix, LT RS buy, consec. buy signals, R-R > 2.5 |
| AMD | Advanced Micro Devices, Inc. | Semiconductors | $187.43 | hi 180s - low 190s | 224 | 160 | 5 for 5'er, top 10% of SEMI sector matrix, multiple buy signals, pullback from ATH |
| Symbol | Company | Sector | Current Price | Action Price | Target | Stop | Notes |
|---|
| Symbol | Company | Sector | Current Price | Action Price | Target | Stop | Notes |
|---|---|---|---|---|---|---|---|
| BC | Brunswick Corporation | Leisure | $85.10 | hi 80s - mid 90s | 99 | 75 | BC fell to a sell signal and violated its trend line on Thursday. OK to hold here. Maintain $75 stop. |
| Comment | |||||||
|---|---|---|---|---|---|---|---|
|
|
|||||||
AMD Advanced Micro Devices, Inc. R ($193.09) - Semiconductors - AMD Is a 5 for 5'er that ranks fifth out of 61 names in the semiconductors sector matrix. On its default chart, the stock has completed two consecutive buy signals and reached a new all-time high earlier this month before pulling back from heavily overbought territory. With a reversal up on Friday, AMD has now established support at $186. Long exposure may be added in the upper $180s to $190s and we will set our initial stop at $160, which would take out multiple levels of support on AMD's default chart. We will use the bullish price objective, $224, as our near-term target price.
| 24 | ||||||||||||||||||||||||||||||||||||||||||||||||||||
| 224.00 | X | 224.00 | ||||||||||||||||||||||||||||||||||||||||||||||||||
| 220.00 | X | O | Top | 220.00 | ||||||||||||||||||||||||||||||||||||||||||||||||
| 216.00 | X | O | 216.00 | |||||||||||||||||||||||||||||||||||||||||||||||||
| 212.00 | X | O | 212.00 | |||||||||||||||||||||||||||||||||||||||||||||||||
| 208.00 | X | O | 208.00 | |||||||||||||||||||||||||||||||||||||||||||||||||
| 204.00 | X | O | 204.00 | |||||||||||||||||||||||||||||||||||||||||||||||||
| 200.00 | X | O | 200.00 | |||||||||||||||||||||||||||||||||||||||||||||||||
| 198.00 | X | O | 198.00 | |||||||||||||||||||||||||||||||||||||||||||||||||
| 196.00 | X | O | 196.00 | |||||||||||||||||||||||||||||||||||||||||||||||||
| 194.00 | 3 | O | 194.00 | |||||||||||||||||||||||||||||||||||||||||||||||||
| 192.00 | X | O | 192.00 | |||||||||||||||||||||||||||||||||||||||||||||||||
| 190.00 | X | O | 190.00 | |||||||||||||||||||||||||||||||||||||||||||||||||
| 188.00 | X | O | 188.00 | |||||||||||||||||||||||||||||||||||||||||||||||||
| 186.00 | X | O | 186.00 | |||||||||||||||||||||||||||||||||||||||||||||||||
| 184.00 | X | X | 184.00 | |||||||||||||||||||||||||||||||||||||||||||||||||
| 182.00 | X | O | X | X | 182.00 | |||||||||||||||||||||||||||||||||||||||||||||||
| 180.00 | X | O | X | X | X | O | X | 180.00 | ||||||||||||||||||||||||||||||||||||||||||||
| 178.00 | X | O | X | O | X | O | X | O | X | 178.00 | ||||||||||||||||||||||||||||||||||||||||||
| 176.00 | X | O | X | O | X | X | O | X | O | X | 176.00 | |||||||||||||||||||||||||||||||||||||||||
| 174.00 | X | X | O | X | O | X | O | X | O | X | O | 174.00 | ||||||||||||||||||||||||||||||||||||||||
| 172.00 | X | O | X | O | X | O | X | O | X | O | X | Mid | 172.00 | |||||||||||||||||||||||||||||||||||||||
| 170.00 | X | O | X | O | 2 | O | X | O | X | O | X | 170.00 | ||||||||||||||||||||||||||||||||||||||||
| 168.00 | X | O | X | O | X | O | X | O | X | O | X | 168.00 | ||||||||||||||||||||||||||||||||||||||||
| 166.00 | X | O | O | X | O | O | O | X | 166.00 | |||||||||||||||||||||||||||||||||||||||||||
| 164.00 | X | O | O | X | 164.00 | |||||||||||||||||||||||||||||||||||||||||||||||
| 162.00 | X | O | 162.00 | |||||||||||||||||||||||||||||||||||||||||||||||||
| 160.00 | X | 160.00 | ||||||||||||||||||||||||||||||||||||||||||||||||||
| 158.00 | X | 158.00 | ||||||||||||||||||||||||||||||||||||||||||||||||||
| 156.00 | X | 156.00 | ||||||||||||||||||||||||||||||||||||||||||||||||||
| 154.00 | X | 154.00 | ||||||||||||||||||||||||||||||||||||||||||||||||||
| 152.00 | X | 152.00 | ||||||||||||||||||||||||||||||||||||||||||||||||||
| 150.00 | X | X | X | 150.00 | ||||||||||||||||||||||||||||||||||||||||||||||||
| 148.00 | X | O | X | O | X | 148.00 | ||||||||||||||||||||||||||||||||||||||||||||||
| 146.00 | X | O | X | O | X | 146.00 | ||||||||||||||||||||||||||||||||||||||||||||||
| 144.00 | X | 1 | X | O | 144.00 | |||||||||||||||||||||||||||||||||||||||||||||||
| 142.00 | X | X | O | X | 142.00 | |||||||||||||||||||||||||||||||||||||||||||||||
| 140.00 | X | O | X | O | X | 140.00 | ||||||||||||||||||||||||||||||||||||||||||||||
| 138.00 | X | O | X | O | X | 138.00 | ||||||||||||||||||||||||||||||||||||||||||||||
| 136.00 | X | O | O | X | 136.00 | |||||||||||||||||||||||||||||||||||||||||||||||
| 134.00 | • | X | O | 134.00 | ||||||||||||||||||||||||||||||||||||||||||||||||
| 132.00 | X | • | X | 132.00 | ||||||||||||||||||||||||||||||||||||||||||||||||
| 130.00 | X | X | O | • | X | 130.00 | ||||||||||||||||||||||||||||||||||||||||||||||
| 128.00 | X | O | X | O | • | X | • | 128.00 | ||||||||||||||||||||||||||||||||||||||||||||
| 126.00 | X | O | X | O | • | X | • | 126.00 | ||||||||||||||||||||||||||||||||||||||||||||
| 124.00 | X | O | 6 | X | O | • | X | X | • | Bot | 124.00 | |||||||||||||||||||||||||||||||||||||||||
| 122.00 | X | O | X | O | X | O | X | • | X | O | X | • | 122.00 | |||||||||||||||||||||||||||||||||||||||
| 120.00 | X | O | X | O | X | O | X | O | X | • | • | • | X | O | X | • | 120.00 | |||||||||||||||||||||||||||||||||||
| 118.00 | X | O | O | O | X | O | X | O | X | • | X | • | X | C | • | 118.00 | ||||||||||||||||||||||||||||||||||||
| 116.00 | X | O | 7 | X | O | X | O | 8 | O | X | O | • | X | • | 116.00 | |||||||||||||||||||||||||||||||||||||
| 114.00 | X | O | X | O | X | O | O | X | O | X | O | • | X | • | 114.00 | |||||||||||||||||||||||||||||||||||||
| 112.00 | X | O | X | O | X | O | X | O | X | O | X | • | • | • | X | • | 112.00 | |||||||||||||||||||||||||||||||||||
| 110.00 | X | O | X | O | O | O | X | O | X | O | X | • | 9 | • | X | • | X | • | 110.00 | |||||||||||||||||||||||||||||||||
| 108.00 | X | O | O | O | X | O | X | O | X | O | X | O | • | X | • | 108.00 | ||||||||||||||||||||||||||||||||||||
| 106.00 | X | O | O | X | O | X | O | A | O | • | X | • | 106.00 | |||||||||||||||||||||||||||||||||||||||
| 104.00 | X | • | O | X | O | X | O | X | O | X | • | 104.00 | ||||||||||||||||||||||||||||||||||||||||
| 102.00 | X | • | O | O | X | O | X | O | X | • | 102.00 | |||||||||||||||||||||||||||||||||||||||||
| 100.00 | X | • | O | O | X | O | X | • | 100.00 | |||||||||||||||||||||||||||||||||||||||||||
| 99.00 | X | • | O | X | O | B | • | 99.00 | ||||||||||||||||||||||||||||||||||||||||||||
| 98.00 | O | X | • | O | X | O | X | • | 98.00 | |||||||||||||||||||||||||||||||||||||||||||
| 97.00 | O | X | • | O | X | O | X | X | • | 97.00 | ||||||||||||||||||||||||||||||||||||||||||
| 96.00 | O | X | • | O | X | O | X | O | X | • | 96.00 | |||||||||||||||||||||||||||||||||||||||||
| 95.00 | O | X | • | O | O | X | O | X | • | 95.00 | ||||||||||||||||||||||||||||||||||||||||||
| 94.00 | O | • | O | O | X | • | 94.00 | |||||||||||||||||||||||||||||||||||||||||||||
| 93.00 | • | O | • | 93.00 | ||||||||||||||||||||||||||||||||||||||||||||||||
| 92.00 | • | • | 92.00 | |||||||||||||||||||||||||||||||||||||||||||||||||
| 24 |
| ADBE Adobe Systems Incorporated ($494.69) - Software - ADBE fell Friday after their Thursday earnings release, breaking a double bottom at $536 before falling to $488. The stock is now testing its bullish support line, which has been in place since last May. The weight of the technical evidence is weak for this 2 for 5'er and showing further deterioration. Further support after $480 is not seen until $364 on the default chart. Overhead resistance may be found at $584 initially. |
| CSGP CoStar Group Inc. ($94.96) - Real Estate - Shares of CSGP gained over 8% on Friday, seemingly catching a bid from a big NAR settlement. The stock is a 3 for 5'er right now, but after today's move we could see an attribute upgrade. Those interested should dollar-cost average into positions because CSGP sits at the top of its ten-week trading band. Initial support is down around $85. |
| DVN Devon Energy Corporation ($47.62) - Oil - DVN returned to a buy signal Friday when it broke a double top at $48 and now sits one box below its bearish resistance line. The technical outlook for DVN remains negative as the stock is a 1 for 5'er and ranks in the bottom quintile of the oil sector matrix. From here, the first level of support sits at $41. |
| ETSY Etsy Inc ($66.04) - Retailing - ETSY moved lower today, posting a third consecutive sell signal in the process. The path of least resistance is lower here, as the stock earns 0 technical attributes and has shown little signs of bullish participation. $66 marks support from 2024 lows, so a break of this point could suggest further weakness. Long exposure should be limited. |
| HAL Halliburton Company ($37.73) - Oil Service - HAL returned to a buy signal Friday when it broke a triple top at $38, where it now sits against its bearish resistance line. HAL is a 3 for 5'er and ranks 25th out of 41 names in the oil service sector matrix. A move to $39 would return the stock to a positive trend and elevate it to a 4 for 5'er. |
| WLK Westlake Corp. ($146.79) - Chemicals - WLK returned to a buy signal and a positive trend on Friday when it broke a triple top at $146. The positive trend change will promote WLK to a 5 for 5'er; the stock also ranks in the top third of the chemicals sector matrix. WLK now sits at an all-time high on its default chart. Support can be found at $120. |
| Name | Option Symbol | Action | Stop Loss |
|---|---|---|---|
| T-Mobile US Inc. - $161.99 | O: 24F160.00D21 | Buy the June 160.00 calls at 8.05 | 152.00 |
| Name | Option | Action |
|---|---|---|
| Cisco Systems, Inc. ( CSCO) | Mar. 50.00 Calls | Expired at 0 |
| Targa Resources Corp. ( TRGP) | Mar. 90.00 Calls | Expired at 16. |
| Monster Beverage Corp. ( MNST) | Jun. 55.00 Calls | Initiate an option stop loss of 4.90 (CP: 6.90) |
| Zillow Group Inc. Class C ( Z) | Apr. 55.00 Calls | Stopped at 50.00 (CP: 47.18) |
| Centene Corporation ( CNC) | Mar. 77.50 Calls | Expired at 0 |
| CoStar Group Inc. ( CSGP) | Jun. 85.00 Calls | Initiate an option stop loss of 10.80 (CP: 12.80) |
| Name | Option Symbol | Action | Stop Loss |
|---|---|---|---|
| JD.COM INC - $27.55 | O: 24R29.00D21 | Buy the June 29.00 puts at 2.03 | 30.00 |
| Name | Option | Action |
|---|---|---|
| Keurig Dr Pepper Inc. ( KDP) | Apr. 32.00 Puts | Initiate an option stop loss of 1.90 (CP: 2.90) |
| HP Inc ( HPQ) | Mar. 31.00 Puts | Expired at 0.56 |
| The Coca-Cola Company ( KO) | Mar. 60.00 Puts | Expired at 0.12 |
| Kraft Heinz Co/The ( KHC) | Apr. 37.50 Puts | Initiate an option stop loss of 2.10 (CP: 3.10) |
| Name | Option Sym. | Call to Sell | Call Price | Investment for 500 Shares | Annual Called Rtn. | Annual Static Rtn. | Downside Protection |
|---|---|---|---|---|---|---|---|
| Macerich Co $ 15.95 | O: 24F17.00D21 | Jun. 17.00 | 0.85 | $ 7,684.50 | 35.64% | 16.50% | 4.24% |
| Name | Action |
|---|---|
| Cleveland-Cliffs Inc. ( CLF) - 19.66 | Sell the June 21.00 Calls. |
| Carnival Corporation ( CCL) - 16.20 | Sell the June 16.00 Calls. |
| Uber Technologies, Inc. ( UBER) - 77.65 | Sell the June 80.00 Calls. |
| Bath & Body Works Inc. ( BBWI) - 45.90 | Sell the June 47.50 Calls. |
| Applied Materials, Inc. ( AMAT) - 200.75 | Sell the June 210.00 Calls. |
| Trimble Inc. ( TRMB) - 62.32 | Sell the August 65.00 Calls. |
| Western Digital Corporation ( WDC) - 60.80 | Sell the June 65.00 Calls. |
| Micron Technology, Inc. ( MU) - 91.46 | Sell the June 97.50 Calls. |
| Palantir Technologies Inc. Class A ( PLTR) - 24.43 | Sell the June 26.00 Calls. |
| Name | Covered Write |
|---|---|
| Jabil Circuit, Inc. ( JBL - 147.46 ) | June 150.00 covered write. |
Daily Equity & Market Analysis
Loading, Please Wait...
