
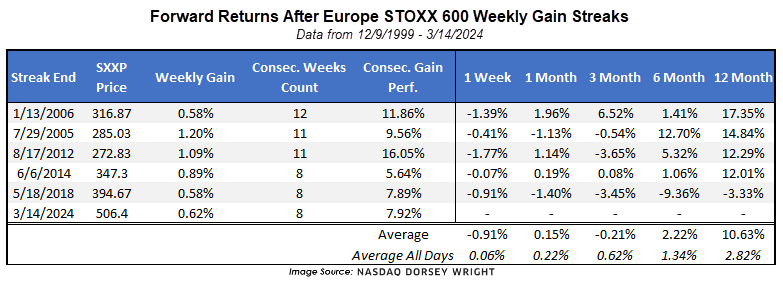
European equities have risen for 8 consecutive weeks, one of the longest streaks in the past 25 years.
European equities have been on quite the run over the past several weeks. The Dow Jones STOXX 600 Price Index SXXP has advanced for eight consecutive weeks, notching an improvement of 7.92% over that span. There have only been five other periods that have seen as long or a longer stretch of gains for SXXP dating back to the origin of our data in 1999. The most recent ended on 5/18/2018, which saw the index rise 7.89%. Prior to that, we saw another 8-week period end on 6/6/2014, then two 11 week stretches in 2012 and 2005, and the longest duration at 12 consecutive weeks of improvement end in January 2006. Since these dates inherently highlight at least a near-term price peak, running forward performance after the streaks end shows some near-term consolidation that averages a loss of almost 1% over the following week. However, seeing long streaks of gains may be a good sign for further long-term improvement in Europe. As we get 6 months out from the ending of these streaks, four out of the five other instances showed improvement in SXXP, at an average return of 2.22%, besting the average 6-month return from any date (1.34%). That improves drastically as we look one year out, with every instance except for 2018 showing a double-digit gain for SXXP after the positive return streak ended.
Reviewing past performance can help provide perspective on what we might expect moving forward, but we know that no two instances are going to be alike. We also have a very limited sample size of extended gains for the STOXX 600 Index, and international equities showed weaker relative strength when compared to domestic equities throughout most of our lookback window. Still, the consistent improvement in Europe should at least be on your radar in the back half of March.
The STOXX 600 Index SXXP just reached a new all-time high last week as the chart crossed above the early 2022 peak in the high $490s to its current position at $505. The technical picture is perhaps better viewed through the 5-point chart, which shows consistent directional movement over the past few years. After reaching the $495 point in January 2022, SXXP entered a clearly defined negative trend along with most global equities throughout 2022. The index then bottomed at $380 in October, moved into a positive trend by November, and rose higher until August, when the U.S. dollar showed a sharp reversal in its directional movement. After uncertainty through October 2023, the last few months have seen sharp improvement, as demonstrated by the consecutive weekly gain streak. Should that streak end, the first level of support would not be seen until around $465, which is also just below the rally highs from 2023. Further support from there can be seen around $430 from last October.

