
The Invesco S&P 500 500 Equal Weight ETF (RSP) reached all-time highs this week after a 790-day drought. Does an elongated period without all-time highs matter with respect to forward performance? The data says yes, and much more.
Earlier this week the Invesco S&P 500 Equal Weight ETF (RSP) reached all-time highs for the first time in over two years. This development is big news for a couple of related reasons. First, RSP’s breakout highlights the expansion of participation; in other words, clearly more than seven stocks are making gains. Remember that for the majority of the last year, investors were complaining about breadth, and justifiably so in most cases. Second, RSP’s breakout comes at a time when members of the Mag 7 (which are a huge weight in the S&P 500) have shown signs of deterioration. Take for example Apple (AAPL) which fell into a negative trend earlier this week and was consequently demoted to a 2 for 5’er. Tesla (TSLA) is another example with its -28% year-to-date return and 0 for 5 attribute rating.
Cap weighted funds like the SPDR S&P 500 ETF Trust (SPY) are fantastic when the biggest players produce outsized returns; however, when these same positions flounder the rest of the pack can offer little help to hold up the benchmark. On the other hand, RSP does not have the same concentration risk as SPY which can be a benefit or detriment depending on market conditions.

Over the past decade (arguably two decades) SPY has overshadowed RSP. For instance, from 3/7/2014 to 3/7/2024 SPY gained 228% while RSP added just 167%. Over the past 20 years, the story is the same, but the outperformance is less pronounced - SPY advanced 557% and RSP added 535%.
20 years is relatively short in stock market history. What if we looked back further?
We have S&P 500 Equal Weight Index (SPXEWI) data starting in 1990. Of course, the other S&P 500 Index (cap weight, SPX) dates back much further, but for comparison purposes, we ran a hypothetical growth with a common start date in 1990. Below are the results.
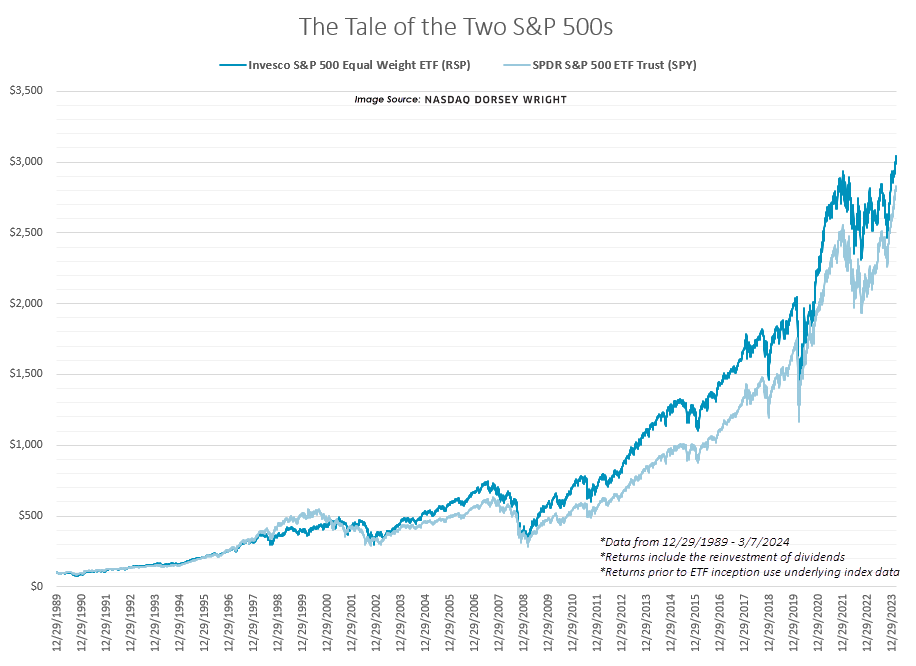
Perhaps to some surprise, the equal weight index has outperformed the cap weight index since its inception. Furthermore, the cap weight index has been playing catch up for a vast majority of the last 30+ years. SPXEWI has gained 2970% since inception while SPX has gained 2745% over the same period (12/29/1989 - 3/7/2024). So, technically speaking, the equal weight has been a tougher benchmark since inception.
There are a couple of rebuttals to that statement. First, no one really cares because SPY has done better as of late (recency bias) which could keep the outperformance trend going (fund flows). Second, what if equal weight is just mechanically disadvantaged now? Its efficacy for alpha is decaying. In other words, equal weighting S&P 500 stocks is a thing of the past destined to die.
In our view, a more reasonable conclusion is that sometimes it is better to own equal weight and other times cap weight; in fact, the data supports this conclusion. Perhaps the simplest way of deciding when to own equal or cap weight is using our relative strength column switching strategy, last discussed here. Although, that is not the only technical evidence we can look toward. A more nuanced observation we want to make today relates to the latest breakout for RSP.
As we said at the beginning, RSP hit an all-time high earlier this week for the first time in over two years; more specifically, it had been 790 calendar days since RSP last printed an all-time high (1/4/2022). Does an elongated period without all-time highs matter concerning forward performance? The data says yes. We bulleted some observations below the following table.

- After RSP took over a year to reach an all-time high, returns for RSP were positive every time six-months and one-year after.
- The average and median returns two years after these “all-time high droughts” were north of 30% for RSP.
- SPY also performed well during these periods, but RSP outperformed SPY about two-thirds of the time beginning six-months after.
- Although not shown in the table above, when RSP took longer than 100 days but less than one year to reach an all-time high the forward returns were lower.
- For instance, of the 14 times it took greater than 100 days but less than one year to hit an all-time high, RSP averaged a gain of 11.5% a year later and 17.5% two years later.
As you would expect us to conclude with a small sample size, weigh these performance implications lightly. Nonetheless, the technical significance stands, and hopes for a catch-up trade seem more plausible with multi-year resistance in the rearview mirror.
