
This Week's Featured Chart is the Invesco QQQ 3-Point Chart.
Portfolio View - Major Market ETFs
| Symbol | Name | Price | Yield | PnF Trend | RS Signal | RS Col. | Fund Score | 200 Day MA | Weekly Mom |
|---|---|---|---|---|---|---|---|---|---|
| DIA | SPDR Dow Jones Industrial Average ETF Trust | 390.07 | 1.74 | Positive | Sell | X | 4.08 | 356.08 | - 10W |
| EEM | iShares MSCI Emerging Markets ETF | 41.02 | 2.63 | Positive | Sell | O | 2.61 | 39.29 | + 5W |
| EFA | iShares MSCI EAFE ETF | 78.86 | 2.90 | Positive | Sell | X | 4.08 | 72.46 | + 4W |
| FM | iShares Frontier and Select EM ETF | 27.86 | 3.51 | Positive | Sell | O | 3.23 | 26.44 | + 3W |
| IJH | iShares S&P MidCap 400 Index Fund | 58.56 | 1.40 | Positive | Buy | O | 4.48 | 52.60 | + 4W |
| IJR | iShares S&P SmallCap 600 Index Fund | 105.68 | 1.32 | Positive | Sell | O | 2.66 | 100.02 | - 1W |
| QQQ | Invesco QQQ Trust | 439.14 | 0.58 | Positive | Buy | X | 5.62 | 386.42 | - 4W |
| RSP | Invesco S&P 500 Equal Weight ETF | 164.74 | 1.58 | Positive | Sell | O | 3.15 | 150.21 | + 4W |
| SPY | SPDR S&P 500 ETF Trust | 514.95 | 1.30 | Positive | Sell | X | 4.58 | 456.06 | - 2W |
| XLG | Invesco S&P 500 Top 50 ETF | 41.80 | 0.89 | Positive | Buy | X | 5.82 | 36.41 | - 2W |
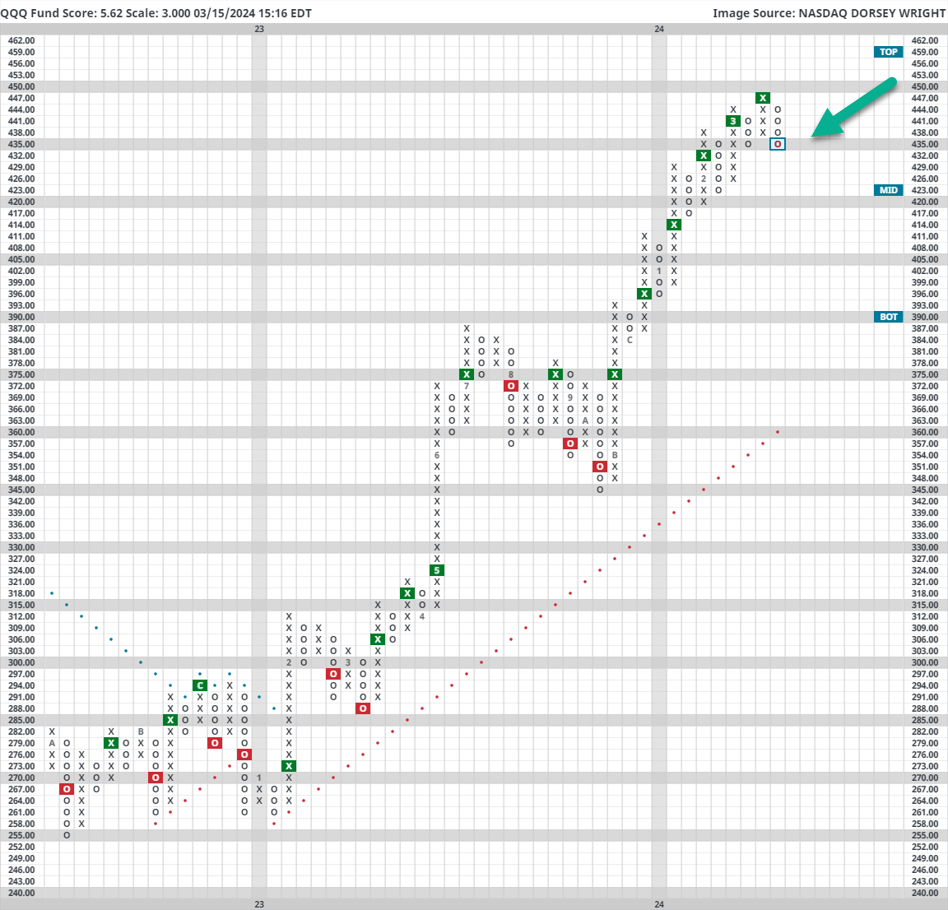
Featured Chart- Invesco QQQ 3-Point Chart
There were no notable changes to any of the major market ETF default charts over the last seven days. However, as other asset classes begin to show some signs of technical improvement, it can be useful to monitor those areas that have been holding strength for quite some time. While still extended on its default chart, the 3-point chart for QQQ reveals a slight pullback to relevant support nearby. While by no means concerning, NDW analysts would like to see risk-on assets continue higher after a healthy pullback. QQQ maintains a strong 5.62 fund score and is on a string of 6 consecutive buy signals on this sensitive 3-point chart, so while the path of least resistance is higher continue to monitor QQQ as a tech-focused proxy.
