
Today we discuss investor sentiment and specifically look at how markets have historically behaved after a 50%+ AAII Bulls reading.
Sir John Templeton is attributed with the quote, “Bull markets are born on pessimism, grow on skepticism, mature on optimism, and die on euphoria.” While an agreeable quote, in the moment it is extremely difficult to identify a crowd that’s overly pessimistic, skeptical, optimistic, or euphoric. Hindsight is (usually) 20/20. As students of the market, we can study patterns of investor behavior and more easily highlight times when things were stretched, but again, when it comes to the present it seems far more unclear.
Investor sentiment surveys, like the popular American Association of Individual Investors (AAII) Weekly Survey, give an idea of where the pendulum might sit between greed and fear. The key word is might because what people say and what people do can be two very different things. For example, investors might say they are bearish on the stock market for the next six months but still buy equities anytime the S&P 500 drops 5%.
Or, as observed throughout 2022, bearish sentiment might be loudly prevalent, yet equity exposure remains high for lack of better alternatives. There are also the rhetorical questions, “Why would smart money tell “dumb” money what they’re doing?” Questions like this are fading, but the point is that sentiment and actual supply/demand for equities (or any asset) can easily diverge.
So, what is our reason for looking at sentiment data today? Sentiment readings are often best used as contrarian signals at the extremes. Put more directly, if everyone gets on one side of the boat it will sink – an excess of bullish expectations is bearish while an excess of bearish expectations is bullish…or so we are trained to think.
Last week (3/6) over 50% of AAII Members felt the stock market would be higher in six months, and for the prior three weeks at least 40% of Members were bullish/felt the same. That magnitude and persistence of bullish sentiment is surprisingly rare as seen on the Point & Figure chart below which plots the four-week average AAII Bulls reading.
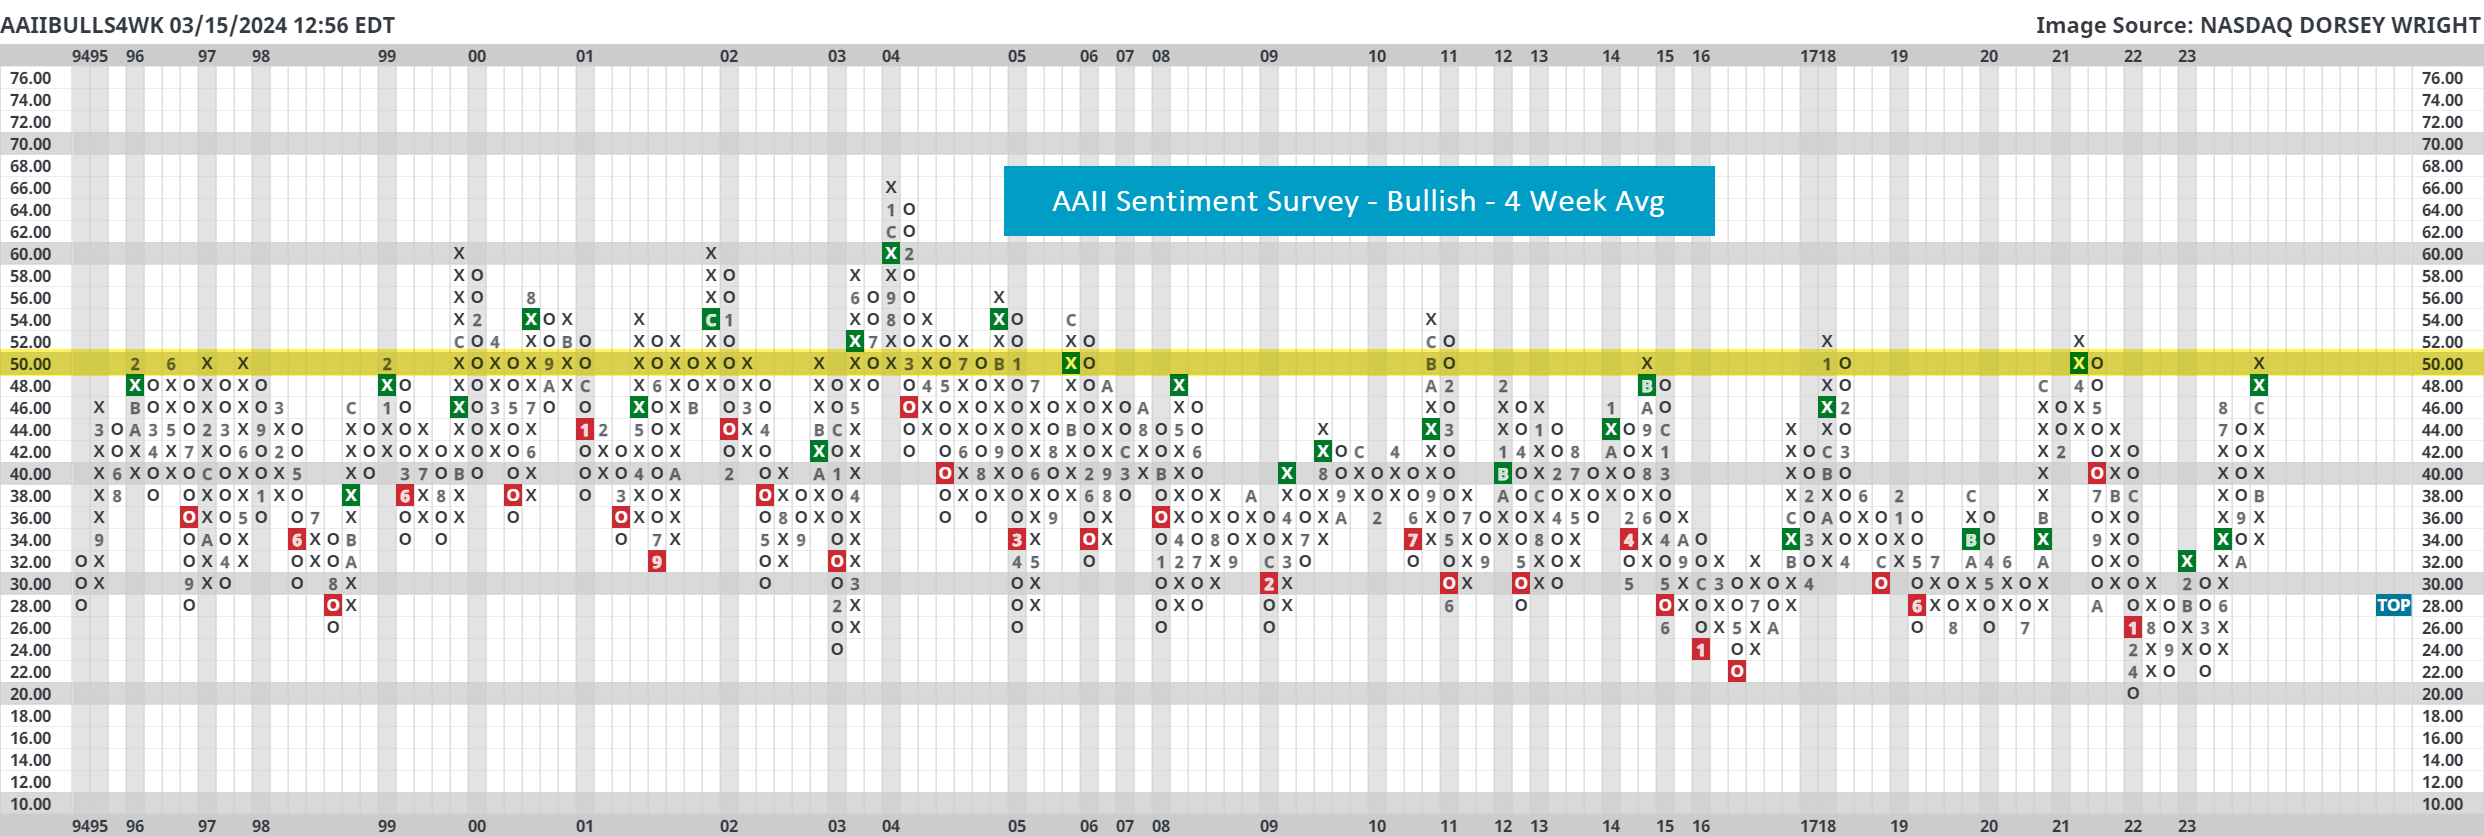
Trips to the 50% level are few and far between. On December 21st of 2023, the four-week AAII Bulls reading eclipsed 50% for the first time since April 2021, and the chart remains there today. Before April 2021 it last crossed 50% on January 2018. As you may expect, this reading reached the 50% threshold much more often in the early 2000s and 1990s.
Based off first glance, a 50% AAII Bulls four-week average would seem bearish for markets going forward. To use our earlier analogy, it appears as if everyone is on one side of the boat…and by a large amount compared to history.
The table below lists each of the dates that the AAII Bulls 4-Week Average Chart (AAIIBULLS4WK) first charted 50% and forward performance after each of those instances. Note that we removed duplicate occurrences within six months and all returns shown include the reinvestment of dividends. Also, recognize that the S&P 500 Equal Weight Index (SPXEWI) data began in 1990. We summarized our takeaways below the table.
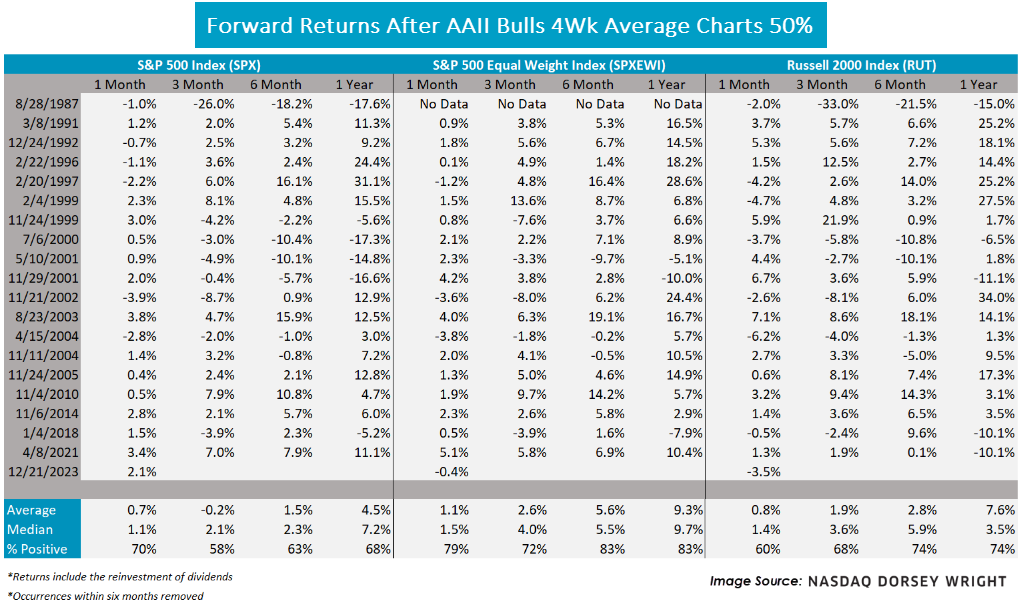
- Over half of the dates are from the 1990s and early 2000s, even after eliminating clusters within six months.
- Perhaps contrary to expectations, most of the time markets went up after these “euphoric” prints. The tightest margin was a 58% positive hit rate for SPX three-months after.
- The best hit rate came from SPXEWI at 83% positive six-months and one-year out (more to say on this later).
- The average one-year return for the S&P 500 was 4.5% and the median was 7.2%, which is near the long-term market average.
- As too suggested by this data last week, this could be a good environment for the equal-weight S&P 500 (a.k.a. the average stock).
- The indices experienced more double-digit moves than single-digit moves one-year out.
As markets rise investor sentiment tends to follow. In modern English, some would attribute this to FOMO (Fear of Missing Out). That said, returns seem to be milder on average compared to washout scenarios which makes sense because markets likely ran up ahead of these extremely bullish sentiment readings. So, the point today is to not be scared of lofty sentiment readings; furthermore, perhaps in a strange way, some amount of FOMO is good for equities. If there is no fear of missing out, then demand could run dry.
