Most Requested Symbols

The curve has an average reading of 39.77%.
Today's featured stock is Ing Groep N.V. -Sponsored (Netherlands) ADR (ING).
Comments include: DASH, DHI, GIS, and WDFC.
Call: Oracle Corporation (ORCL), Put: CVS Health Corp. (CVS), Covered Write: Micron Technology, Inc. (MU)
NDW Morning Update Video - January 11, 2024
NDW Morning Update Video – January 11, 2024.
Click here to download MP3
Note to Wells Fargo Advisors: A compliance approved version of last week's 4Q23 Newsletter can now be found in the Wells Fargo section of the Media & Education tab. The approval # is PM-07052025-6001668.1.3.
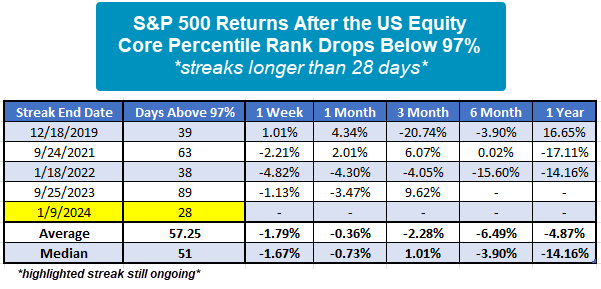
One of the major themes of the last few years has been the overwhelming strength residing in the core of the US equity market. The group we use to keep track of the core is the S&P 500 Index Funds group on the Asset Class Group Scores page. Yesterday, the S&P 500 Index Funds group reached its highest score reading in history, 4.80, with data going back nearly 20 years. Other than the group’s average score, the main metric that tracks the strength of the S&P 500 Index Funds group relative to other groups is the US Equity Core Percentile Rank. As one might expect, this reading is exceptionally high at 97.89%, meaning that the S&P 500 Index Funds group is outscoring 97.89% of all 134 groups tracked on the system. This reading has been above 97% for the last 28 days and counting. If the streak were to end today, this would be the fifth-longest streak on record. The longest streak took place last year and lasted 89 consecutive days which ended on 9/25/23. While there have been few streaks lasting longer than the current one, S&P 500 returns following its end have been mostly negative. To be clear, the current streak is still ongoing and could continue for some time as the average streak lasting longer than 28 days is 57 days. However, given the weakness following the US Equity Core Percentile rank dropping back below 97% after such a long period is worth noting. Such a high level of strength from the core US equity market is abnormal and has historically led to some sort of exhaustion which offers other areas of leadership to present themselves.

There certainly never is a quiet week within the cryptocurrency space. The main topic on the docket was the possible approval of a spot Bitcoin ETF, which has been the main catalyst for upside action recently. The start to the year has been somewhat lackluster for the broad space, with the lack of definite approval leaving some near-term doubt in the picture surrounding the outstanding ETF applications. The big news was the false report coming from the SEC’s X (Twitter) account yesterday (1/9/23) that mentioned the ETF had been approved, which later was corrected and sent Bitcoin falling after market close. Within the Nasdaq Crypto Index (NCI), all but one coin fell for the last seven days. Many reversed back down to relevant levels of support- a development to monitor if the space continues to tread water. The approval process continues to evolve rapidly- something we will update as things become clearer and more concrete.
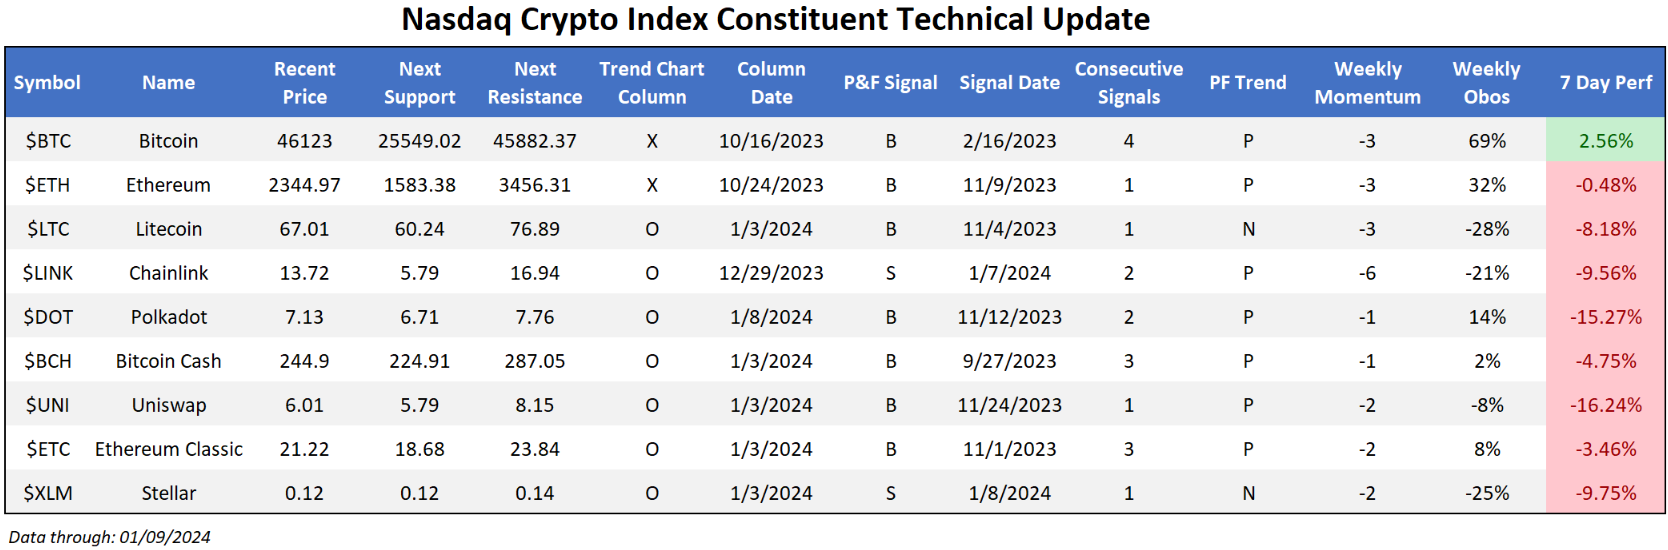
$45,000 has been a key level for Bitcoin. At this time of this writing, $BTC has rebounded nicely, reclaiming $46,500 as the market eyes the eventual approval of such a key ETF. Because of its natural volatility, the default charts for cryptocurrencies are percent-based, which helps eliminate some of the noise found in the markets. That isn't to say, however, that traditional trend charts can’t be of use. A quick look at the 500-point chart shows the failure to breach past $45,000 during what was an extremely productive 2023 for the space. Even after yesterday’s pullback, the constructive point worth adding here is the near-term hold of this mark. The drop brings the crypto king into more normalized trading levels, and interested parties could continue to add here…. With the understanding that enhanced volatility could be in play surrounding the ETF approval in the near future.

Each week the analysts at DWA review and comment on all major asset classes in the global markets. Shown below is the summary or snapshot of the primary technical indicators we follow for multiple areas. Should there be changes mid-week we will certainly bring these to your attention via the report.
| Universe | BP Col & Level (actual) | BP Rev Level | PT Col & Level (actual) | PT Rev Level | HiLo Col & Level (actual) | HiLo Rev Level | 10 Week Col & Level (actual) | 10 Week Rev Level | 30 Week Col & Level (actual) | 30 Week Rev Level |
|---|---|---|---|---|---|---|---|---|---|---|
| ALL |
|
44% |
|
32% |
|
74% |
|
74% |
|
50% |
| NYSE |
|
58% |
|
48% |
|
90% |
|
82% |
|
70% |
| OTC |
|
38% |
|
28% |
|
68% |
|
64% |
|
44% |
| World |
|
40% |
|
38% |
|
|
|
60% |
|
48% |

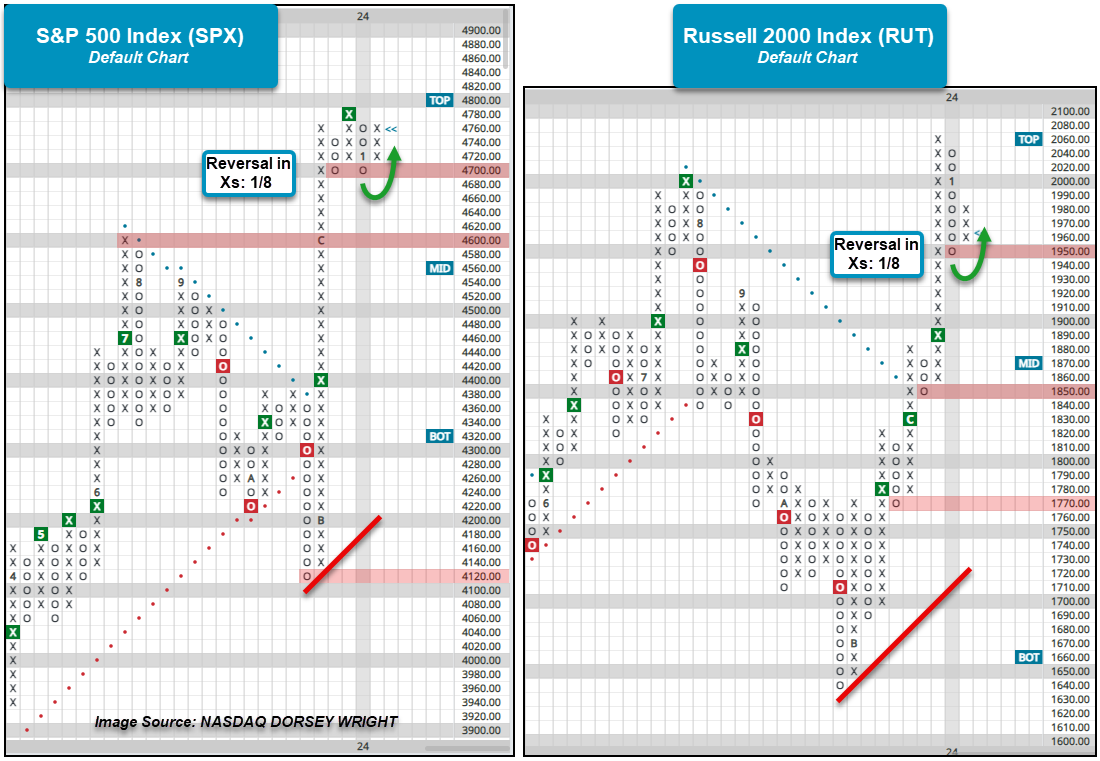
US Equity index returns were mixed over the past week with the S&P 500 Index SPX adding 29 basis points while the Russell 2000 Index RUT shed 2.22%. For both indices, action last week brought the charts in Os before reversing back into Xs during Monday’s trading. SPX reversed down to 4700, where it held for a second time before shifting back into Xs at 4760. RUT on the other hand pulled back to 1950 before reversing back up to 1980. Both index charts now have support levels closer to current trading after equities charged higher to wrap up 2023. In addition to near-term support at 4700, support for SPX can be found at old resistance around the 4600 level, which originally dates to March 2022. The bullish support line sits at 4200 and the lows from October sit at 4100. Beyond 1950, RUT has support prevalent on the chart at 1850 and 1770, while the bullish support line resides at 1720.
While action over the last week has not caused any of the major US Equity indices to give sell signals, stocks underlying the indices have begun to flip from buy to sell signals. As noted in Monday’s “Were You Aware…?,” the bullish percent for the S&P 400 ^BPSPMID and S&P 600 ^BPSPSML reversed down into Os after reaching readings north of 70%. While both BP charts still reside at elevated levels, the reversal into Os is at least an initial indication of decreased participation so further downside should be monitored closely. Meanwhile, the bullish percent for the S&P 500 ^BPSPX still sits in a column of Xs. This does not necessarily mean stocks within SPX have not given sell signals within the past week, but, we have yet to see enough sell signals by stocks in SPX to get the indicator to reverse into Os.
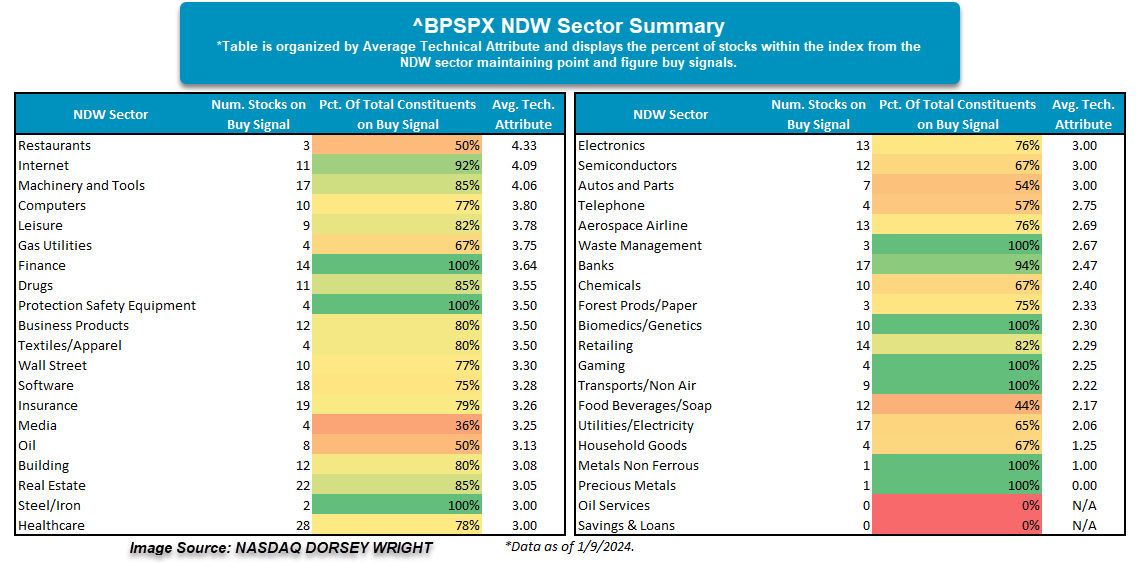
The table below shows the breakdown of SPX stocks within their respective NDW sectors and how many currently maintain buy signals on their trend charts. Additionally, the table shows the percentage of the total NDW sector constituents within SPX along with the average technical attribute rating of those stocks on buy signals. From a broad perspective, there are 34 NDW sectors in which over half of the constituents in SPX are on buy signals, and overall, 24 of the NDW sectors have the average technical attribute rating for stocks on buy signals at 3 or above. Restaurants maintain the highest average attribute rating with the likes of Chipotle CMG, Domino’s DPZ, and Darden DRI all maintaining buy signals. Among the other NDW sectors deserving of shoutouts are Finance – which has all 14 constituents on a buy signal – along with Internet and Machinery and Tools as they have a high percentage of constituents in SPX on a buy signal and the average reading for those stocks is above 4.
Overall, the table highlights those NDW sectors where participation remains high within S&P 500 stocks. Those sectors where there is high participation along with high average technical attributes may be a good starting point to look for individual ideas.
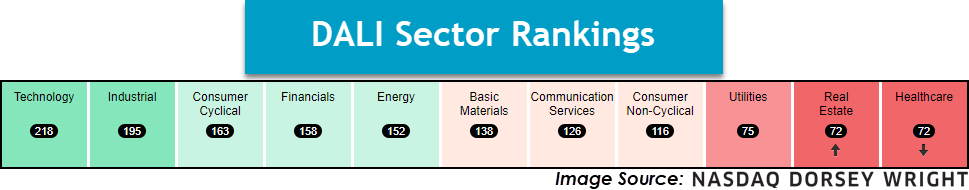
The past week saw no significant technical developments in the Technology, Financials, Energy, Basic Materials, Communication Services, Consumer Non-Cyclical, or Healthcare Sectors. Those that saw noteworthy movement are included below, in order of their relative strength ranking in the DALI domestic equity sector rankings. Sector designations are based on DALI sector rankings and are as follows: 1 - 3 overweight, 4 - 7 equal-weight, and 8 - 11 underweight.
Industrial- Overweight
The industrial sector remains in 2nd place this week, as it has for quite some time now. Broad exposure remains viable here, as representative XLI holds a near 4.0 fund score and a string of buy signals on its default chart. Big headlines this week came from BA, which dropped back to the middle of the trading band following safety concerns after side-paneling on a Boeing plane came off mid-flight. Despite this, a reversal back into Xs could be technically constructive for this 3/5’er. A similar picture is in play for CAT, so consider setting an alert for a reversal back into Xs as a possible initiation point.
Consumer Discretionary- Overweight
Discretionary stocks pulled back over the last week with the SPDR Discretionary fund XLY falling 1.26% and bringing the fund closer to the middle of the trading band. Alaska Airlines ALK took headlines over the weekend but wasn’t impacted as much as other stocks involved within the news story and still maintains a negative technical picture with a 0 attribute rating. On the positive side of the coin, Abercrombie & Fitch ANF rallied to a new all-time high earlier this week and pulled back during Wednesday’s action. ANF presents a strong technical picture but has continued to trade within overbought territory for months now, so those seeking exposure to the stock may consider dollar cost averaging into positions. Other stocks within the broader sector that have reversed up into Xs this week and present positive technical pictures are Expedia EXPE and Amazon AMZN.
Utilities- Underweight
The SPDR Utilities fund XLU rallied 34 basis points over this past week, leading the fund to reverse back into Xs and again test the bearish resistance line. From here, a move above $67 would flip the trend back to positive and further improve the ETF’s fund score, which did uptick above 1 this past week. ONEOK OKE rallied to a new multi-year high and still trades within actionable territory. The stock is a 5 for 5’er that maintains a yield north of 5%. Otter Tail Power OTTR is a smaller cap name within the Electric Utilities space that is a 5 for 5’er and has pulled back from recent rally highs.
Real Estate- Underweight
Real Estate is fighting with Healthcare for the bottom rank in DALI, but the sector has near-term momentum and could likely overtake Utilities if the strength continues. Individual stock participation is still strong, with most stocks trading on a Point & Figure buy signal as well as above their 50-day moving average. Furthermore, now with an average fund score of 2.80, the sector is nearing the acceptable 3.0 score line. PLD will be the first notable name on the earnings deck, a breakout at $140 would be constructive.

Latin American equities continue to demonstrate strength through the first few weeks of 2024. This can be seen through the Asset Class Group Scores (ACGS) page, which has Latin America as the second-highest ranked non-US group at an average score of 4.81. This strength has been especially notable since October, as the group was positioned below the suitable 3.00 score line at the end of that month. Some areas within the Latin American space have seen more resilient technical pictures, like Mexico. Brazil has also seen strength during this ascent, with more rapid improvement in the small-cap space.
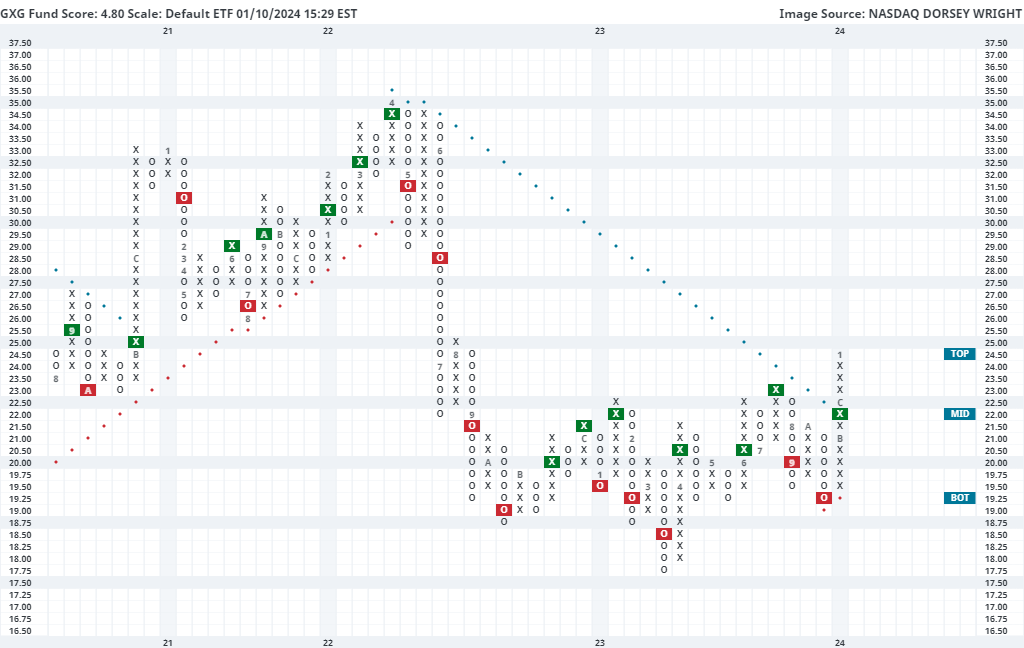
Another area that has flown under the radar is Colombia, as shown through the Global X MSCI Colombia ETF GXG. This fund moved higher last month to return to a buy signal at $22, which also moved the fund back into a positive trend. The more notable breakout came shortly thereafter when the fund rose to $24.50 last week, reaching its highest level since August 2022. GXG carries a strong 4.80 fund score, besting the average non-US equity fund (3.19) and is paired with a sharply positive 4.02 score direction. Like many other areas in international equities, GXG is extended at the current chart level, with a weekly overbought/oversold reading of 85% (through 1/10). While the fund is extended, GXG is an area to keep an eye on for a potential pullback or normalization alongside expanding breadth in Latin America. Initial support is not seen until $19.25 on the default chart, with further support seen on the more sensitive ¼ point chart at $22.75.
Long-term Treasury yields were up slightly over last week as they continued to rebound from heavily oversold conditions. The US Treasury 10-year Yield Index (TNX) crossed back above 4%. The five-year yield index (FVX) also crossed back above the 4% threshold and now sits even with TNX at 4.05%.
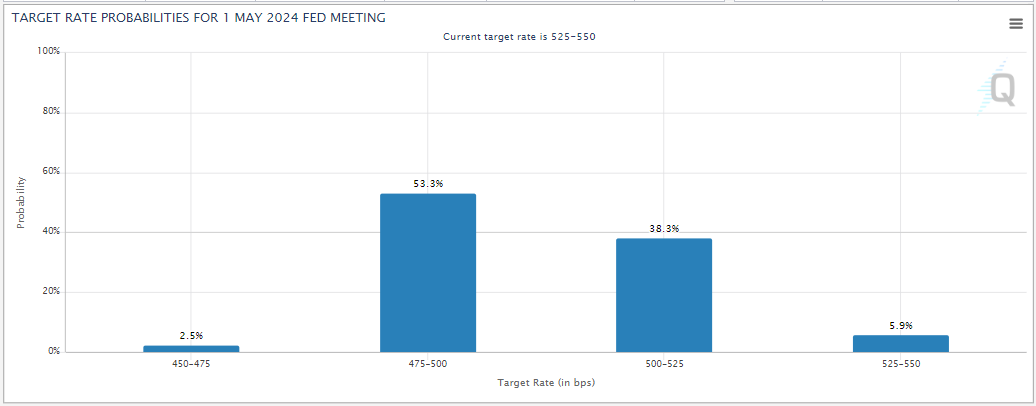
Fed futures have fluctuated recently, reflecting changing views about when the Fed will begin cutting rates. At this point, the Fed futures market is pricing in roughly a 68% chance of one rate cut by March and a better than 90% probability that the Fed will cut rates at least one time by May. The futures market is still pricing in at least 125 bps of cuts in 2024, with a better than 50% chance of at least 150 bps in cuts.
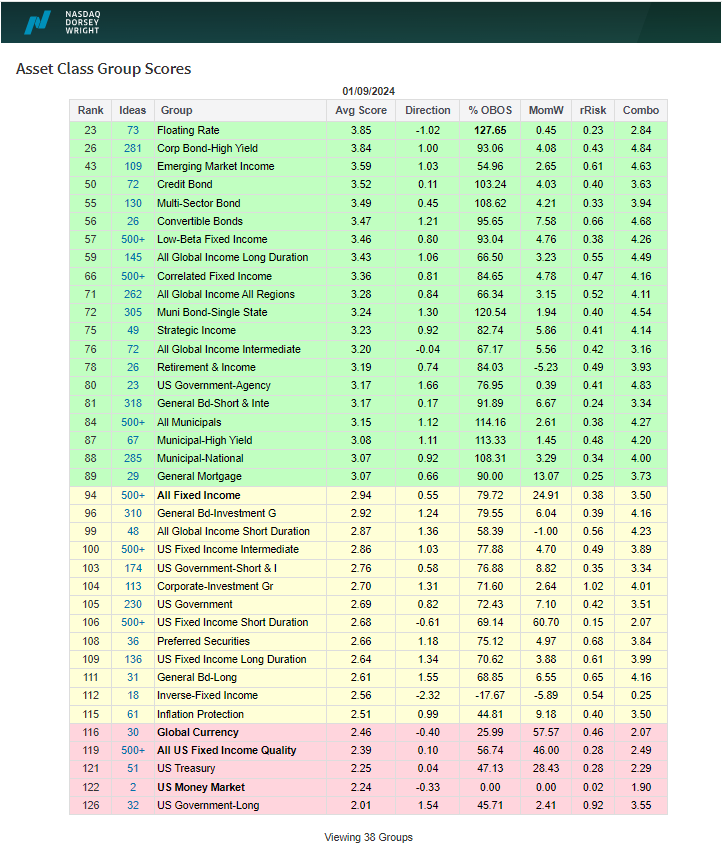
The recent rebound in yields has helped to put floating rates back atop the Asset Class Group Scores fixed income rankings. While floating rates can be seen as a defensive group, overall, the rankings still reflect a generally strong bond market with most groups sitting above the 3.0 score threshold. Despite the recent pullback in bonds, many groups remain in heavily overbought territory, suggesting the possibility we could see a bit more downside or a period of consolidation while prices normalize. One phenomenon that has continued recently is the positive correlation of bonds and equities – we have generally seen stocks and bonds move up and down together. This may be welcomed by investors currently as both assets have generally been going up over the last few months, however, it does present a challenge from an asset allocation standpoint as it undermines the diversification benefit of the traditional 80/20 (or 60/40) portfolio. As a result, investors may want to ensure that there is some diversification within their fixed income portfolio. One possible solution is to include instruments like floating rates, which generally have a slightly positive correlation with yields and low correlations to other areas of fixed income.
Remember, these are technical comments only. Just as you must be aware of fundamental data for the stocks we recommend based on technical criteria in the report, so too must you be aware of important data regarding delivery, market moving government releases, and other factors that may influence commodity pricing. We try to limit our technical comments to the most actively traded contracts in advance of delivery, but some contracts trade actively right up to delivery while others taper off well in advance. Be sure you check your dates before trading these contracts. For questions regarding this section or additional coverage of commodities email will.gibson@nasdaq.com.
Data represented in the table below is through 1/9/2024:
Broad Market Commodities Report
| Symbol | Name | Price | PnF Trend | RS Signal | RS Col. | 200 Day MA | Weekly Mom |
|---|---|---|---|---|---|---|---|
| CL/ | Crude Oil Continuous | 72.24 | Negative | Buy | X | 77.66 | +4W |
| DBLCIX | Deutsche Bank Liquid Commodities Index | 466.31 | Negative | Sell | O | 490.51 | +1W |
| DWACOMMOD | DWA Continuous Commodity Index | 797.29 | Positive | Buy | O | 796.78 | +1W |
| GC/ | Gold Continuous | 2026.40 | Positive | Sell | O | 1963.31 | -2W |
| HG/ | Copper Continuous | 3.75 | Positive | Sell | O | 3.79 | -2W |
| ZG/ | Corn (Electronic Day Session) Continuous | 459.25 | Negative | Sell | O | 530.45 | -1W |
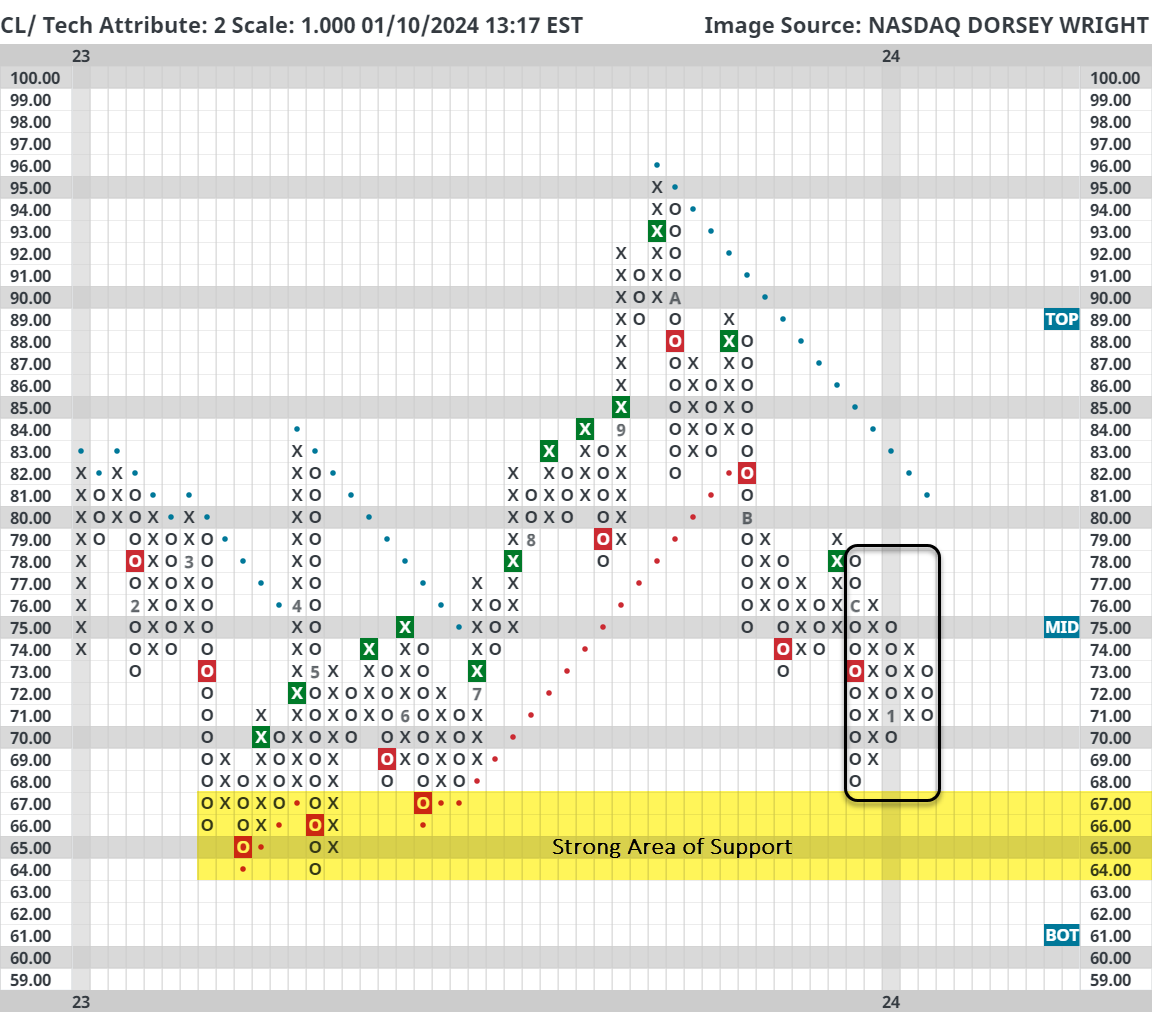
Crude Oil (CL/) is about flat year-to-date, yet the commodity remains volatile and is currently working on a triangle pattern. As outlined in the Point & Figure chart below, since December crude has been forming a series of lower tops and higher bottoms; the chart is now nearing a point where it must break one way or the other. If the breakout is a double bottom, it will be considered a bearish triangle pattern.
Typically, triangles are viewed as continuation patterns which in this case would suggest lower prices ahead for crude. However, with firm support nearby in the mid $60s prolonged downside moves seem improbable. Note: the highlighted area of support could arguably be extended back to August and December 2021.
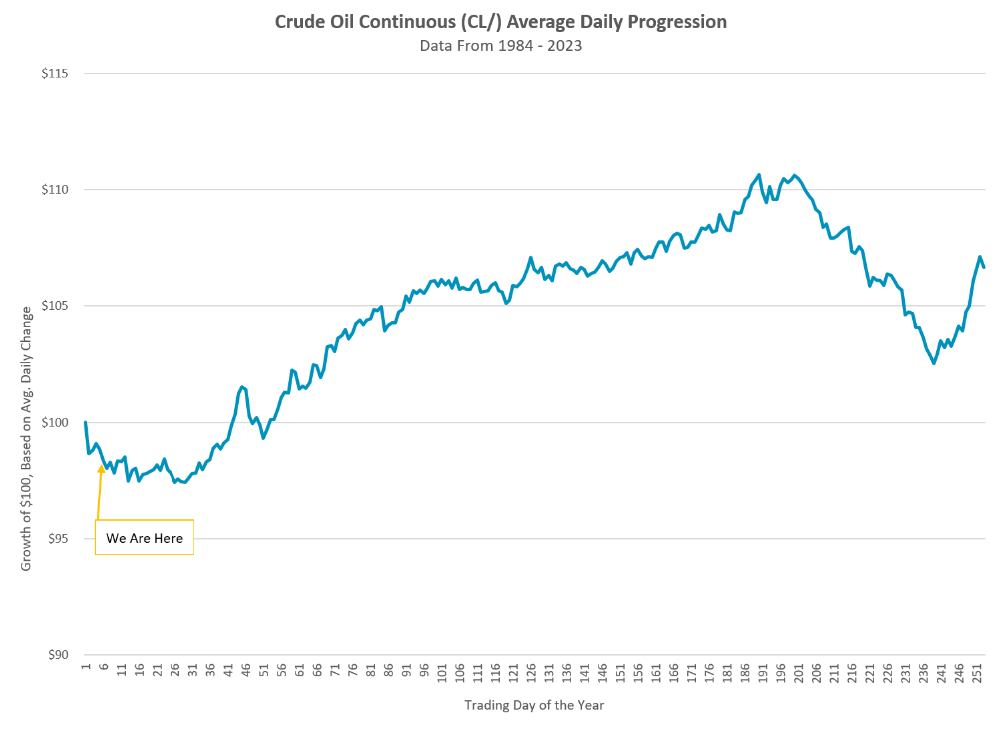
In addition to the established area of support nearby, crude’s historic seasonal trends could provide another backstop. In the line chart below, we computed the average daily change for crude since 1984 and then averaged each of these daily moves together to construct a calendar year progression. For example, we looked at the average daily change for crude on the first trading day of the year and grew $100 by that amount. Then, we looked at the average daily change for crude on the second trading day of the year and grew the preciously calculated amount by that average change…and so forth.
Keep in mind that this chart is built off averages, so there are plenty of outlier effects. Nonetheless, the data suggests that crude typically begins to bottom around this time in the year before trending higher into the fourth quarter. (S/O to Ned Davis Research and Thrasher Analytics for putting this on our radar today.)
We never suggest investing based off seasonality alone, and after all, the crude chart has yet to show any technical signs of a meaningful turnaround at the time of this writing. A break south of the $64-$65 area would be a material deviation from historical norms and a major break of support.
Average Level
39.77
| < - -100 | -100 - -80 | -80 - -60 | -60 - -40 | -40 - -20 | -20 - 0 | 0 - 20 | 20 - 40 | 40 - 60 | 60 - 80 | 80 - 100 | 100 - > |
|---|---|---|---|---|---|---|---|---|---|---|---|
|
Buy signaliwm
|
|||||||||||
|
Buy signalijr
|
|||||||||||
|
Buy signalefa
|
|||||||||||
|
Buy signalief
|
|||||||||||
|
Buy signalijh
|
|||||||||||
|
Buy signalicf
|
Buy signalhyg
|
||||||||||
|
Buy signalvoog
|
Buy signallqd
|
||||||||||
|
Sell signalgcc
|
Buy signaloneq
|
Buy signalshy
|
|||||||||
|
Buy signalgsg
|
Buy signalQQQ
|
Buy signalXLG
|
|||||||||
|
Sell signalUSO
|
Buy signalGLD
|
Buy signaldvy
|
Buy signalRSP
|
Buy signalVOOV
|
|||||||
|
Sell signaldx/y
|
Sell signaleem
|
Sell signalfxe
|
Sell signaltlt
|
Buy signalagg
|
Buy signalspy
|
Buy signaldia
|
|||||
| < - -100 | -100 - -80 | -80 - -60 | -60 - -40 | -40 - -20 | -20 - 0 | 0 - 20 | 20 - 40 | 40 - 60 | 60 - 80 | 80 - 100 | 100 - > |
| AGG | iShares US Core Bond ETF |
| USO | United States Oil Fund |
| DIA | SPDR Dow Jones Industrial Average ETF |
| DVY | iShares Dow Jones Select Dividend Index ETF |
| DX/Y | NYCE U.S.Dollar Index Spot |
| EFA | iShares MSCI EAFE ETF |
| FXE | Invesco CurrencyShares Euro Trust |
| GLD | SPDR Gold Trust |
| GSG | iShares S&P GSCI Commodity-Indexed Trust |
| HYG | iShares iBoxx $ High Yield Corporate Bond ETF |
| ICF | iShares Cohen & Steers Realty ETF |
| IEF | iShares Barclays 7-10 Yr. Tres. Bond ETF |
| LQD | iShares iBoxx $ Investment Grade Corp. Bond ETF |
| IJH | iShares S&P 400 MidCap Index Fund |
| ONEQ | Fidelity Nasdaq Composite Index Track |
| QQQ | Invesco QQQ Trust |
| RSP | Invesco S&P 500 Equal Weight ETF |
| IWM | iShares Russell 2000 Index ETF |
| SHY | iShares Barclays 1-3 Year Tres. Bond ETF |
| IJR | iShares S&P 600 SmallCap Index Fund |
| SPY | SPDR S&P 500 Index ETF Trust |
| TLT | iShares Barclays 20+ Year Treasury Bond ETF |
| GCC | WisdomTree Continuous Commodity Index Fund |
| VOOG | Vanguard S&P 500 Growth ETF |
| VOOV | Vanguard S&P 500 Value ETF |
| EEM | iShares MSCI Emerging Markets ETF |
| XLG | Invesco S&P 500 Top 50 ETF |
| Symbol | Company | Sector | Current Price | Action Price | Target | Stop | Notes |
|---|---|---|---|---|---|---|---|
| AIG | American International Group, Inc. | Insurance | $67.83 | hi 50s - low 60s | 68 | 52 | 4 for 5'er, top half of INSU sector matrix, LT pos mkt RS, multiple consec buy signals, 2.35% yield |
| COCO | Vita Coco Company, Inc. | Food Beverages/Soap | $24.52 | mid 20s | 36 | 23 | Multi consec buy signals, RS buy |
| KRG | Kite Realty Group Trust | Real Estate | $22.24 | 19 - 21 | 34.50 | 16 | 5 for 5'er, 11 of 113 in REAL sector matrix, LT pos mkt RS, spread quintuple top, 4.65% yield |
| IONS | Ionis Pharmaceuticals Inc. | Biomedics/Genetics | $52.88 | 42 - hi 40s | 64 | 38 | 5 TA rating, top decile of BIOM matrix, consec. buy signals, LT RS buy |
| OKE | ONEOK, Inc. | Gas Utilities | $70.39 | low-to-mid 60s | 89 | 55 | 5 for 5'er, top third of GUTI sector matrix, triple top, pullback to oversold, R-R>2.0, 5.8% yield |
| ORCL | Oracle Corporation | Software | $103.63 | mid 100s - mid 110s | 138 | 96 | LT pos mkt RS, trend chart signal flip, 1.5% yield |
| CNC | Centene Corporation | Healthcare | $78.01 | hi 60s - hi 70s | 98 | 60 | 5 TA rating, top quintile of healthcare sector matrix, consec. buy signals, LT mkt RS buy |
| AEO | American Eagle Outfitters, Inc. | Retailing | $21.27 | 16 - 19.50 | 33 | 14 | 5 TA rating, top quintile of RETA sector matrix, consec. buy signals, R-R > 3.5. |
| DELL | Dell Technologies Inc Class C | Computers | $77.11 | mid 60s - lo 70s | 101 | 52 | 5 TA rating, top 20% of COMP sector matrix, buy-on-pullback, R-R > 2 |
| ORLY | O'Reilly Automotive, Inc. | Autos and Parts | $927.51 | 912 - 992 | 1264 | 792 | 5 for 5'er, Mkt. RS Buy since 9/2002, Peer RS Buy since 8/2011, Pullback from Recent ATH, Earn. 2/7 |
| FLR | Fluor Corporation | Building | $38.11 | hi 30s | 49 | 32 | 4 for 5'er, top half of favored BUIL sector matrix, spread quad top breakout |
| ACHC | Acadia Healthcare Company Inc | Healthcare | $80.15 | 70s | 90 | 66 | 4 for 5'er, top third of HEAL sector matrix, LT pos mkt RS, pos trend flip, triple top |
| CWAN | Clearwater Analytics Holdings, Inc. Class A | Finance | $19.60 | 18 - lo 20s | 27.50 | 16 | 5 TA rating, top half of Finance sector matrix, consec. buys, buy-on-pullback, R-R > 2. |
| BRO | Brown & Brown, Inc. | Insurance | $71.87 | hi 60s - low 70s | 95 | 59 | 5 for 5'er, top half of INSU sector matrix, LT pos mkt RS, pullback from ATH, R-R>2.0, Earn. 1/22 |
| URBN | Urban Outfitters, Inc. | Retailing | $38.66 | mid-to-hi 30s | 49.50 | 30 | 5 for 5'er, top half RETA sector matrix, triple top breakout |
| JBL | Jabil Circuit, Inc. | Electronics | $128.37 | mid 120s - hi 130s | 186 | 100 | 5 TA rating, top decile of ELEC sector matrix, LT RS buy, LT pos trend, buy-on-pullback |
| WPM | Wheaton Precious Metals Corp | Precious Metals | $47.68 | 46 - lo 50s | 70 | 40 | 5 TA rating, top 20% of PREC sector matrix, bullish catapult, rec. pos. monthly mom., R-R > 2 |
| RS | Reliance Steel & Aluminum Co | Steel/Iron | $277.49 | lo 270s to lo 290s | 364 | 236 | 5 TA rating, LT RS buy, LT pos. trend, consec. buy signals |
| TTWO | Take-Two Interactive Software, Inc. | Software | $159.20 | mid 150s - hi 160s | 218 | 130 | 4 TA rating, top half SOFT sector matrix, LT pos. trend, pos. mkt. RS, consec. buy signals, buy-on-pullback, Earn. 2/5 |
| YELP | Yelp Inc | Business Products | $44.93 | mid-to-hi 40s | 59 | 39 | 5 for 5'er, top 25% of favored BUSI sector matrix, spread triple top, Earn. 2/7 |
| DT | Dynatrace, Inc. | Computers | $53.80 | lo-mid 50s | 81 | 43 | 5 TA rating, LT pos trend, top half of favored COMP sector matrix, buy-on-pullback, R-R > 2.5, Earn. 1/30 |
| FIVE | Five Below Inc | Household Goods | $191.00 | mid 190s - mid 210s | 270 | 170 | 5 TA rating, top third of HOUS sector matrix, LT RS buy, pos. monthly mom., buy-on-pullback |
| LII | Lennox International Inc. | Building | $443.24 | 420S - 440S | 480 | 380 | 4 for 5'er, #7 of 69 in BUIL sector matrix, three consec buy signals, one box from RS buy, Earn. 1/31 |
| MCK | McKesson Corporation | Drugs | $481.06 | 460s - 480s | 584 | 400 | 5 for 5'er, top half of DRUG sector matrix, triple top, Earn. 1/30 |
| LRCX | Lam Research Corporation | Semiconductors | $752.44 | 728 - hi 700s | 1040 | 600 | 4 TA rating, top 20% of SEMI sector matrix, consec. buy signals, pos. mkt RS Earn. 1/24 |
| ING | Ing Groep N.V. -Sponsored (Netherlands) ADR | Insurance | $14.18 | 13.50 - 15 | 27 | 12 | 5 for 5'er, top half of favored INSU sector matrix, triple top, R-R>5, 5.6% yield |
| Symbol | Company | Sector | Current Price | Action Price | Target | Stop | Notes |
|---|
| Comment | |||||||
|---|---|---|---|---|---|---|---|
|
|
|||||||
ING Ing Groep N.V. -Sponsored (Netherlands) ADR R ($14.20) - Insurance - ING is a 5 for 5'er that ranks in the top half of the favored insurance sector matrix and has been on a market RS buy signal since 2020. On its default chart, ING has completed two consecutive buy signals, most recently breaking a triple top at $15, taking out resistance that had been in place since February. The currently sits near the middle of its trading band, offering an entry point for long exposure. Positions may be added in the $13.50 - $15 range and we will set our initial stop at $12 which would take out ING's October low. We will use the bullish price objective, $27, as our target price, giving us a reward-to-risk ratio north of five. ING also carries a 5.6% yield.
| 15 | 16 | 17 | 19 | 20 | 21 | 22 | 23 | |||||||||||||||||||||||||||||||||||||||||||||
| 21.00 | • | 21.00 | ||||||||||||||||||||||||||||||||||||||||||||||||||
| 20.00 | X | • | 20.00 | |||||||||||||||||||||||||||||||||||||||||||||||||
| 19.50 | 1 | O | • | 19.50 | ||||||||||||||||||||||||||||||||||||||||||||||||
| 19.00 | A | O | • | 19.00 | ||||||||||||||||||||||||||||||||||||||||||||||||
| 18.50 | X | 2 | • | 18.50 | ||||||||||||||||||||||||||||||||||||||||||||||||
| 18.00 | 7 | O | • | 18.00 | ||||||||||||||||||||||||||||||||||||||||||||||||
| 17.50 | • | 6 | 3 | • | 17.50 | |||||||||||||||||||||||||||||||||||||||||||||||
| 17.00 | 6 | X | • | 5 | O | • | 17.00 | |||||||||||||||||||||||||||||||||||||||||||||
| 16.50 | X | O | X | O | • | X | O | • | 16.50 | |||||||||||||||||||||||||||||||||||||||||||
| 16.00 | 5 | O | X | O | • | 4 | 5 | • | • | 16.00 | ||||||||||||||||||||||||||||||||||||||||||
| 15.50 | 4 | 7 | 8 | X | • | 3 | O | • | B | X | 2 | • | 15.50 | |||||||||||||||||||||||||||||||||||||||
| 15.00 | X | 3 | O | X | O | • | 2 | O | • | A | O | 1 | O | X | O | • | X | Top | 15.00 | |||||||||||||||||||||||||||||||||
| 14.50 | 6 | 9 | O | X | X | O | X | O | • | C | O | • | X | O | X | O | X | O | • | 2 | X | C | 14.50 | |||||||||||||||||||||||||||||
| 14.00 | X | O | X | O | X | O | 2 | O | • | 9 | • | X | 8 | X | • | 9 | O | X | O | O | • | X | O | 7 | O | B | Mid | 14.00 | ||||||||||||||||||||||||
| 13.50 | X | O | X | A | X | O | X | • | C | • | B | O | 4 | 5 | O | 8 | C | O | • | X | O | 6 | O | X | 13.50 | |||||||||||||||||||||||||||
| 13.00 | 7 | O | C | X | • | 1 | X | X | • | A | 9 | B | X | O | 4 | O | X | O | • | X | 3 | X | 9 | X | 13.00 | |||||||||||||||||||||||||||
| 12.50 | 1 | • | O | X | O | X | O | X | X | A | X | O | 2 | O | X | 7 | X | O | • | 1 | O | 4 | A | Bot | 12.50 | |||||||||||||||||||||||||||
| 12.00 | • | O | 3 | O | X | O | X | O | X | O | X | O | 1 | 5 | B | X | O | O | X | O | X | 12.00 | ||||||||||||||||||||||||||||||
| 11.50 | • | O | X | 4 | 5 | X | O | 8 | O | C | X | O | X | O | 3 | 3 | X | O | X | 11.50 | ||||||||||||||||||||||||||||||||
| 11.00 | • | 2 | X | 6 | O | 7 | O | X | O | A | O | X | O | X | 5 | X | O | 11.00 | ||||||||||||||||||||||||||||||||||
| 10.50 | • | O | O | X | • | O | 8 | X | 2 | 2 | O | X | O | X | O | X | • | 10.50 | ||||||||||||||||||||||||||||||||||
| 10.00 | • | O | X | • | O | X | O | X | O | X | O | X | O | X | B | • | 10.00 | |||||||||||||||||||||||||||||||||||
| 9.50 | • | O | • | O | O | X | O | X | 4 | 7 | X | O | X | • | 9.50 | |||||||||||||||||||||||||||||||||||||
| 9.00 | • | • | 3 | X | • | O | O | X | O | X | • | 9.00 | ||||||||||||||||||||||||||||||||||||||||
| 8.50 | O | 8 | B | • | 9 | O | • | 8.50 | ||||||||||||||||||||||||||||||||||||||||||||
| 8.00 | O | X | O | X | • | • | 8.00 | |||||||||||||||||||||||||||||||||||||||||||||
| 7.50 | O | X | O | X | • | 7.50 | ||||||||||||||||||||||||||||||||||||||||||||||
| 7.00 | O | 6 | 9 | • | 7.00 | |||||||||||||||||||||||||||||||||||||||||||||||
| 6.50 | O | X | 5 | • | 6.50 | |||||||||||||||||||||||||||||||||||||||||||||||
| 6.00 | O | X | O | X | • | 6.00 | ||||||||||||||||||||||||||||||||||||||||||||||
| 5.50 | O | X | O | X | • | 5.50 | ||||||||||||||||||||||||||||||||||||||||||||||
| 5.00 | O | X | 4 | • | 5.00 | |||||||||||||||||||||||||||||||||||||||||||||||
| 4.75 | O | • | • | 4.75 | ||||||||||||||||||||||||||||||||||||||||||||||||
| 4.50 | • | 4.50 | ||||||||||||||||||||||||||||||||||||||||||||||||||
| 15 | 16 | 17 | 19 | 20 | 21 | 22 | 23 |
| DASH DoorDash, Inc. Class A ($105.90) - Retailing - DASH broke a double top at $104 to return to a buy signal as the stock rallied to $106, marking a new multi-year high. The stock is a 5 for 5'er that ranks in the top quintile of the Retailing sector matrix. Okay to consider here on the breakout. Note resistance lies in the $120 range. Initial support lies in the $93 to $94 range, while the bullish support line sits at $84. |
| DHI D.R. Horton, Inc. ($154.47) - Building - DHI reversed into Xs and broke a double top at $156 for a new all-time high. This counts as the second buy signal for the 5 for 5'er since November 2023 and still positions the stock in overbought territory. Those seeking to initiate exposure to DHI may look to dollar cost average into exposure due to its extended position. Initial support now lies at $148, while additional support may be found at prior resistance at $132. |
| GIS General Mills, Inc. ($63.11) - Food Beverages/Soap - Shares of GIS returned to a sell signal on Wednesday after trying to stage a rally off the October lows. The stock remains a 0 for 5'er and sits near the bottom of the food beverages/soap sector matrix. Avoid. Key support is offered at $61. |
| WDFC WD 40 Corp ($271.13) - Household Goods - WDFC reversed into Xs and broke a double top at $248 as it rallied to a multi-year high at $276. The stock is a 5 for 5'er that ranks in the top quintile of the Household Goods sector matrix and is accompanied by a yield of roughly 1.5%. This action places WDFC in overbought territory, so those shoe may seek initial exposure may look for price normalization at current levels before considering. From here, resistance lies at $280, while additional be found in the $320 to $330 range. Initial support lies at $232, while the bullish support line sits at $200. |
| Name | Option Symbol | Action | Stop Loss |
|---|---|---|---|
| Oracle Corporation - $103.75 | ORCL2415C105 | Buy the March 105.00 calls at 4.80 | 99.00 |
| Name | Option | Action |
|---|---|---|
| Alphabet Inc. ( GOOG) | Apr. 135.00 Calls | Initiate an option stop loss of 12.20 (CP: 14.20) |
| Amazon.com Inc. ( AMZN) | Apr. 145.00 Calls | Initiate an option stop loss of 13.60 (CP: 15.60) |
| Name | Option Symbol | Action | Stop Loss |
|---|---|---|---|
| CVS Health Corp. - $79.18 | CVS2419P77.5 | Buy the April 77.50 puts at 2.91 | 84.00 |
| Name | Option | Action |
|---|---|---|
|
|
||
| Name | Option Sym. | Call to Sell | Call Price | Investment for 500 Shares | Annual Called Rtn. | Annual Static Rtn. | Downside Protection |
|---|---|---|---|---|---|---|---|
| Micron Technology, Inc. $83.33 | MU2419D82.5 | Apr. 82.50 | 6.20 | $38,487.45 | 22.30% | 25.20% | 6.46% |
| Name | Action |
|---|---|
| American Eagle Outfitters, Inc. (AEO) - 21.27 | Sell the March 21.00 Calls. |
| Marvell Technology Inc. (MRVL) - 63.49 | Sell the May 62.50 Calls. |
| Intel Corporation (INTC) - 48.05 | Sell the April 48.00 Calls. |
| Alcoa Inc. (AA) - 31.94 | Sell the April 35.00 Calls. |
| Name | Covered Write |
|---|---|
| PulteGroup, Inc. ( PHM - 103.31 ) | April 105.00 covered write. |
Daily Equity & Market Analysis
Loading, Please Wait...
