US Equity index returns were mixed over the past week. But does the pullback indicate opportunity within certain NDW sectors?
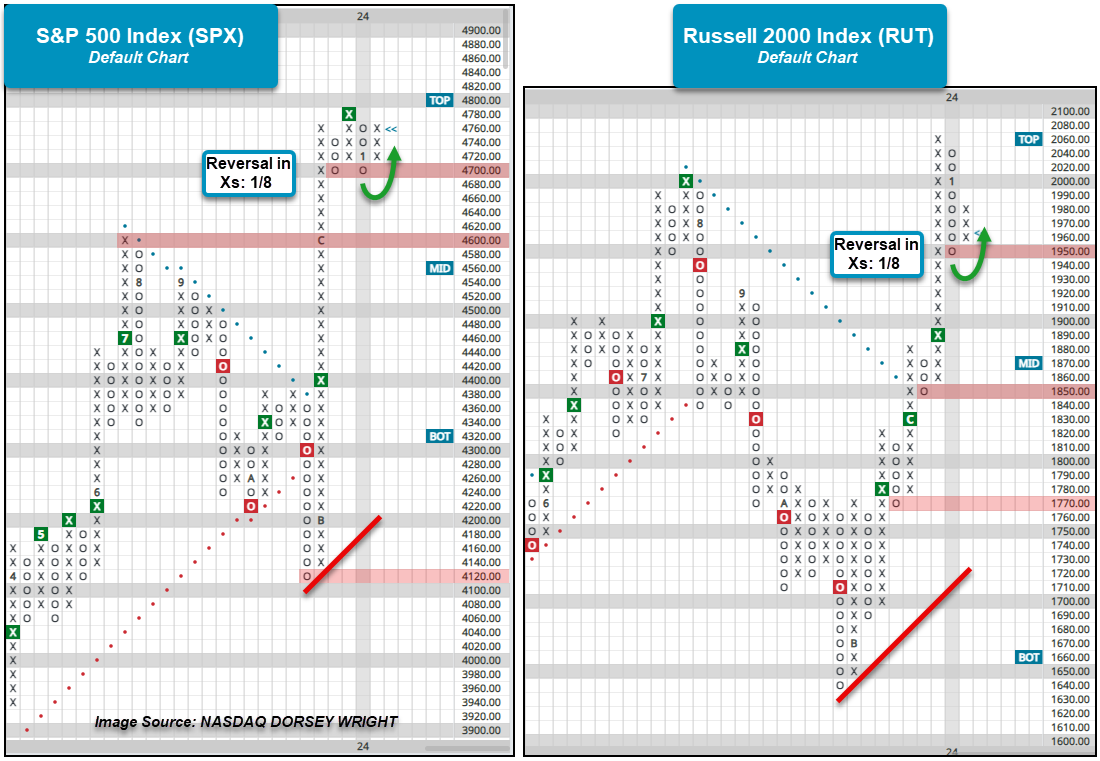
US Equity index returns were mixed over the past week with the S&P 500 Index SPX adding 29 basis points while the Russell 2000 Index RUT shed 2.22%. For both indices, action last week brought the charts in Os before reversing back into Xs during Monday’s trading. SPX reversed down to 4700, where it held for a second time before shifting back into Xs at 4760. RUT on the other hand pulled back to 1950 before reversing back up to 1980. Both index charts now have support levels closer to current trading after equities charged higher to wrap up 2023. In addition to near-term support at 4700, support for SPX can be found at old resistance around the 4600 level, which originally dates to March 2022. The bullish support line sits at 4200 and the lows from October sit at 4100. Beyond 1950, RUT has support prevalent on the chart at 1850 and 1770, while the bullish support line resides at 1720.
While action over the last week has not caused any of the major US Equity indices to give sell signals, stocks underlying the indices have begun to flip from buy to sell signals. As noted in Monday’s “Were You Aware…?,” the bullish percent for the S&P 400 ^BPSPMID and S&P 600 ^BPSPSML reversed down into Os after reaching readings north of 70%. While both BP charts still reside at elevated levels, the reversal into Os is at least an initial indication of decreased participation so further downside should be monitored closely. Meanwhile, the bullish percent for the S&P 500 ^BPSPX still sits in a column of Xs. This does not necessarily mean stocks within SPX have not given sell signals within the past week, but, we have yet to see enough sell signals by stocks in SPX to get the indicator to reverse into Os.
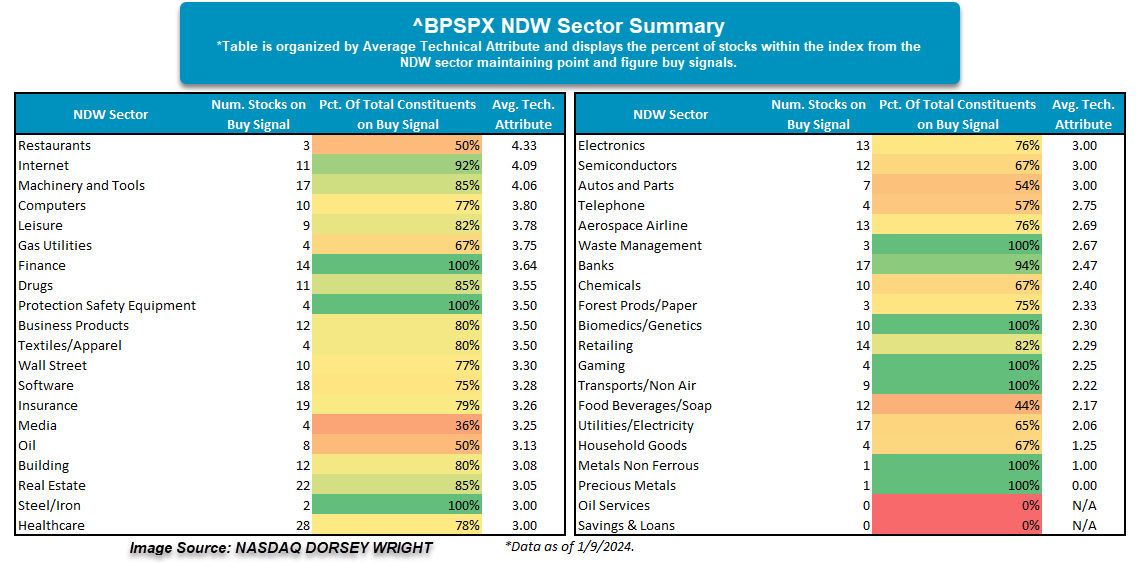
The table below shows the breakdown of SPX stocks within their respective NDW sectors and how many currently maintain buy signals on their trend charts. Additionally, the table shows the percentage of the total NDW sector constituents within SPX along with the average technical attribute rating of those stocks on buy signals. From a broad perspective, there are 34 NDW sectors in which over half of the constituents in SPX are on buy signals, and overall, 24 of the NDW sectors have the average technical attribute rating for stocks on buy signals at 3 or above. Restaurants maintain the highest average attribute rating with the likes of Chipotle CMG, Domino’s DPZ, and Darden DRI all maintaining buy signals. Among the other NDW sectors deserving of shoutouts are Finance – which has all 14 constituents on a buy signal – along with Internet and Machinery and Tools as they have a high percentage of constituents in SPX on a buy signal and the average reading for those stocks is above 4.
Overall, the table highlights those NDW sectors where participation remains high within S&P 500 stocks. Those sectors where there is high participation along with high average technical attributes may be a good starting point to look for individual ideas.