One of the major themes of the last few years has been the overwhelming strength residing in the core of the US equity market. The group we use to keep track of the core is the S&P 500 Index Funds group on the Asset Class Group Scores page.
Note to Wells Fargo Advisors: A compliance approved version of last week's 4Q23 Newsletter can now be found in the Wells Fargo section of the Media & Education tab. The approval # is PM-07052025-6001668.1.3.
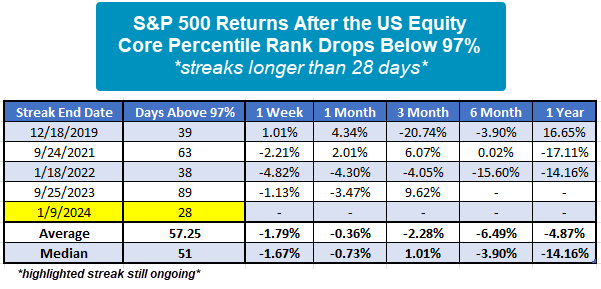
One of the major themes of the last few years has been the overwhelming strength residing in the core of the US equity market. The group we use to keep track of the core is the S&P 500 Index Funds group on the Asset Class Group Scores page. Yesterday, the S&P 500 Index Funds group reached its highest score reading in history, 4.80, with data going back nearly 20 years. Other than the group’s average score, the main metric that tracks the strength of the S&P 500 Index Funds group relative to other groups is the US Equity Core Percentile Rank. As one might expect, this reading is exceptionally high at 97.89%, meaning that the S&P 500 Index Funds group is outscoring 97.89% of all 134 groups tracked on the system. This reading has been above 97% for the last 28 days and counting. If the streak were to end today, this would be the fifth-longest streak on record. The longest streak took place last year and lasted 89 consecutive days which ended on 9/25/23. While there have been few streaks lasting longer than the current one, S&P 500 returns following its end have been mostly negative. To be clear, the current streak is still ongoing and could continue for some time as the average streak lasting longer than 28 days is 57 days. However, given the weakness following the US Equity Core Percentile rank dropping back below 97% after such a long period is worth noting. Such a high level of strength from the core US equity market is abnormal and has historically led to some sort of exhaustion which offers other areas of leadership to present themselves.