Most Requested Symbols

The average distribution level is 45.81%.
Today's featured stock is Microsoft (MSFT).
Comments include: CVNA, GOOGL, LSCC, ODFL, & STLA.
Call: Gilead Sciences, Inc. (GILD), Put: Paypal Holdings Inc. (PYPL), Covered Write: Caesars Entertainment Inc. (CZR)
NDW Morning Update Video - July 27, 2023
NDW Morning Update Video
Click here to download MP3
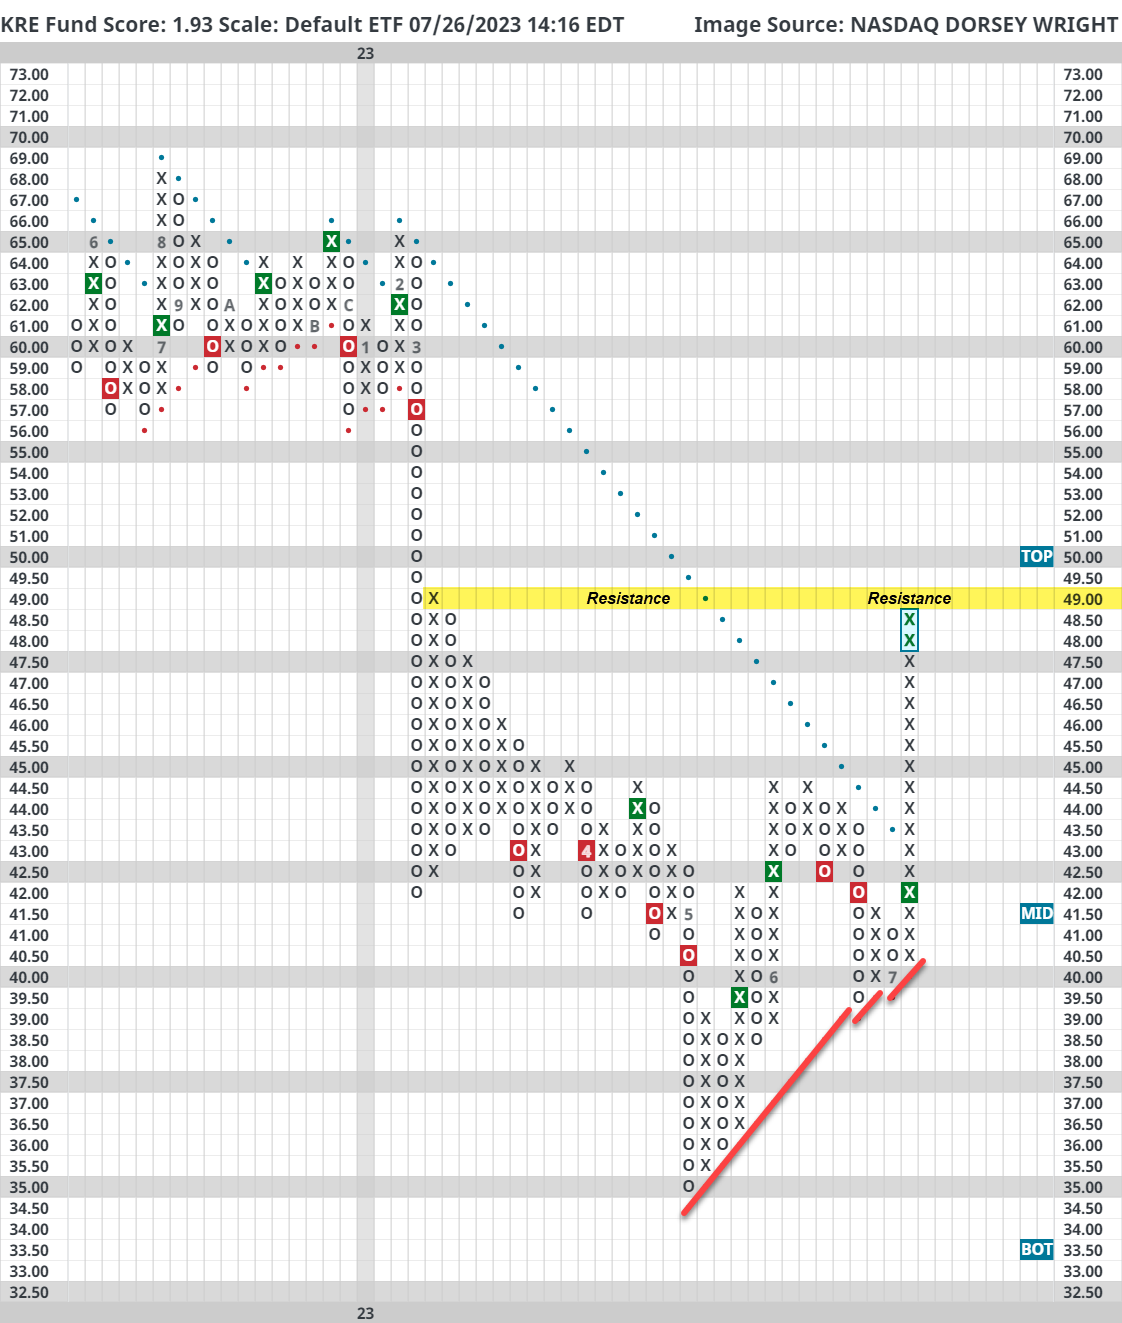
Regional banks have been a constantly watched space since February when cracks in the sector became apparent. The Fed came to the rescue and patched up some of the holes in the space through vehicles like the Bank Term Funding Program in mid-March. Still, there were a couple of banks that either went under or were seized and sold like Silicon Valley Bank and First Republic Bank. On Monday, the FDIC issued a statement that some banks were “not reporting estimated uninsured deposits in accordance with the instruction (Source: New York Times).” Perhaps not a coincidence, news came out on Tuesday that the Banc of California would be absorbing PacWest Bank, one of the hardest hit regional banks in March. The two combined banks will have just about $30.5 billion in deposits, $4 billion less than PacWest itself entered the year with. The news led to major volatility for both names with PacWest (PACW) marking a high of $11.21 and a low of $7.50 before eventually closing at $7.69. The bank then rallied after the close to open at $9.69 on Wednesday. Despite the volatility, the regional banking space has taken the news well so far. The SPDR S&P Regional Banking ETF (KRE) gained nearly 5% during today’s session. The fund trades on a buy signal and entered a positive trend two weeks ago for the first time since March. KRE is now one box away from testing its last level of resistance since its downfall in March at $49. While the Fed did some patchwork, it appears the regional banking space is still going through major changes.


September 14th and 15th
The Symposium is pending approval of CE credit toward the CFP®, CIMA®, CPWA®, and RMA certifications.
Event Agenda Coming Soon
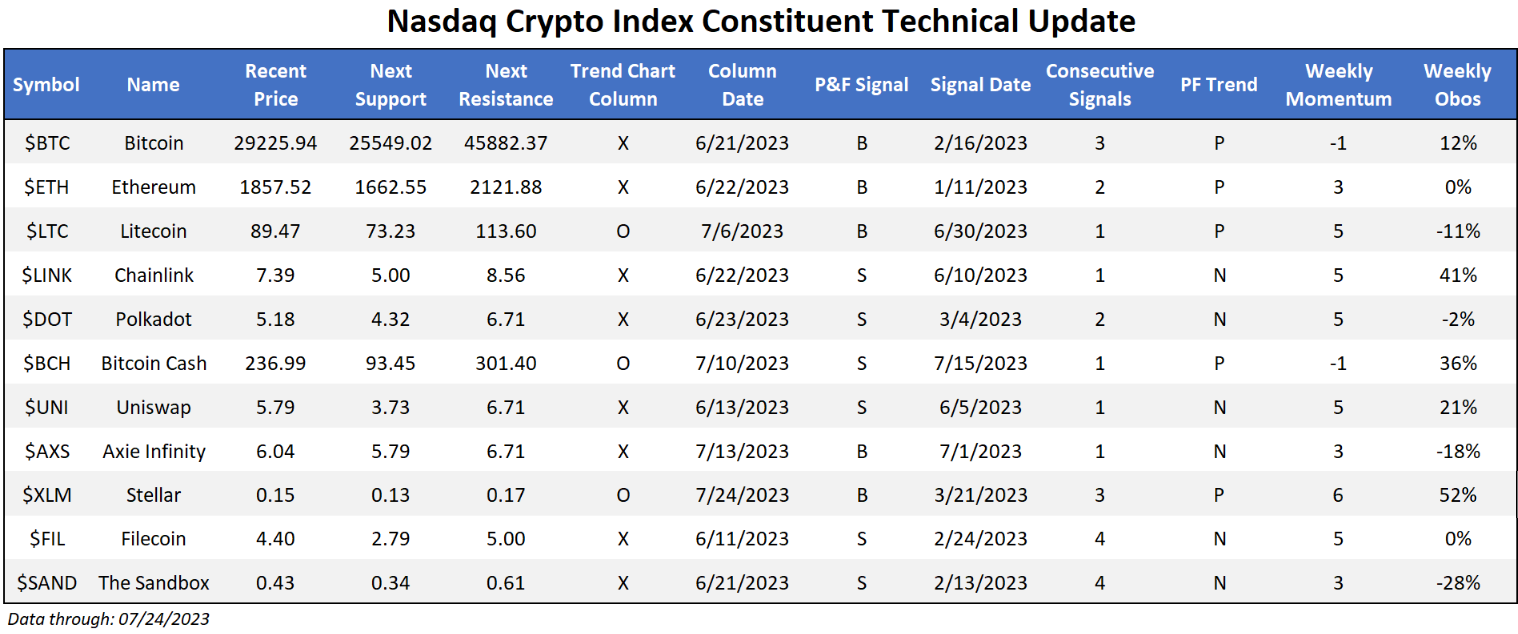
It was a poor (but also relatively muted) week for the broad crypto space. Only three coins within the Nasdaq Crypto Index (NCI) outpaced the market, led by Stellar ($XLM) which has come alive in July. Fueling this near 40% gain throughout the month was recent developments within the Stellar Ecosystem and partnerships to provide payment solutions to some generally unbanked African nations. With this fundamental catalyst in mind, the technical picture for the coin has improved as well, having broken past a stringent bearish resistance line that led the coin lower over the last 24 months. It now sits on a string of three consecutive buy signals and looks to be forming a triangle pattern towards the top of the trading band. Saying that we typically consider triangle formations to be a kind of “continuation” pattern, the recent move could provide a strong base for action if it continues to participate in upside action.

On the other side of the performance table for the last seven days comes Axie Infinity ($AXS), which fell just under 5% for the week. While the coin has returned to a buy signal to start the month of July, recent action has brought it to a somewhat pivotal position on its point and figure chart. $AXS is challenging a strong bearish resistance line, and while it maintains its column of X’s at the time of this writing, it does sit within one box of moving back into a column of O’s. From there, support is found in between $5.50- $5.80. If you do have exposure to the name, consider using the alert manager to keep track of this reversal (or possible positive trend break) by clicking the alarm clock icon above the chart.

Each week the analysts at DWA review and comment on all major asset classes in the global markets. Shown below is the summary or snapshot of the primary technical indicators we follow for multiple areas. Should there be changes mid-week we will certainly bring these to your attention via the report.
| Universe | BP Col & Level (actual) | BP Rev Level | PT Col & Level (actual) | PT Rev Level | HiLo Col & Level (actual) | HiLo Rev Level | 10 Week Col & Level (actual) | 10 Week Rev Level | 30 Week Col & Level (actual) | 30 Week Rev Level |
|---|---|---|---|---|---|---|---|---|---|---|
| ALL |
|
40% |
|
32% |
|
70% |
|
60% |
|
46% |
| NYSE |
|
56% |
|
46% |
|
84% |
|
76% |
|
60% |
| OTC |
|
36% |
|
34% |
|
64% |
|
54% |
|
42% |
| World |
|
40% |
|
36% |
|
|
|
50% |
|
44% |
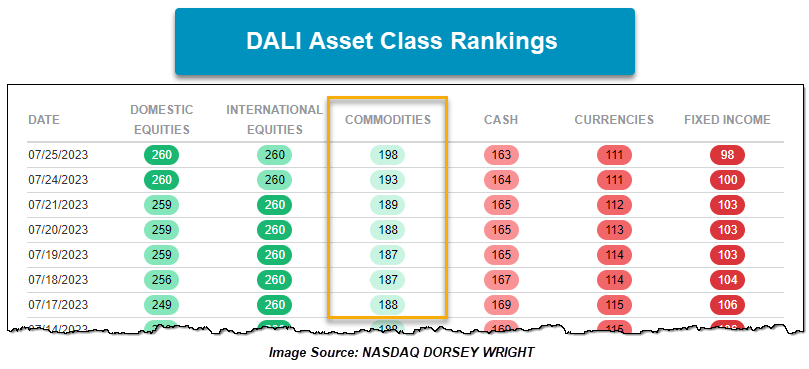
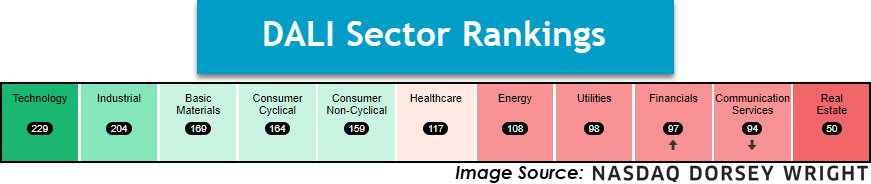
Although Domestic Equities may have garnered the primary focus this week within DALI as the asset class overtook International Equities for the top spot. Domestic Equities have not been the only asset class with relative improvement this week as Commodities are technically the most improved for the week with the addition of nine tally signals since Friday’s close. The increase in tally signals for Commodities puts further separation between the asset class and Cash and provides a notably offensive posture to the DALI Asset Class rankings. We will look at recent action within two areas of the Commodities space driving positive developments.
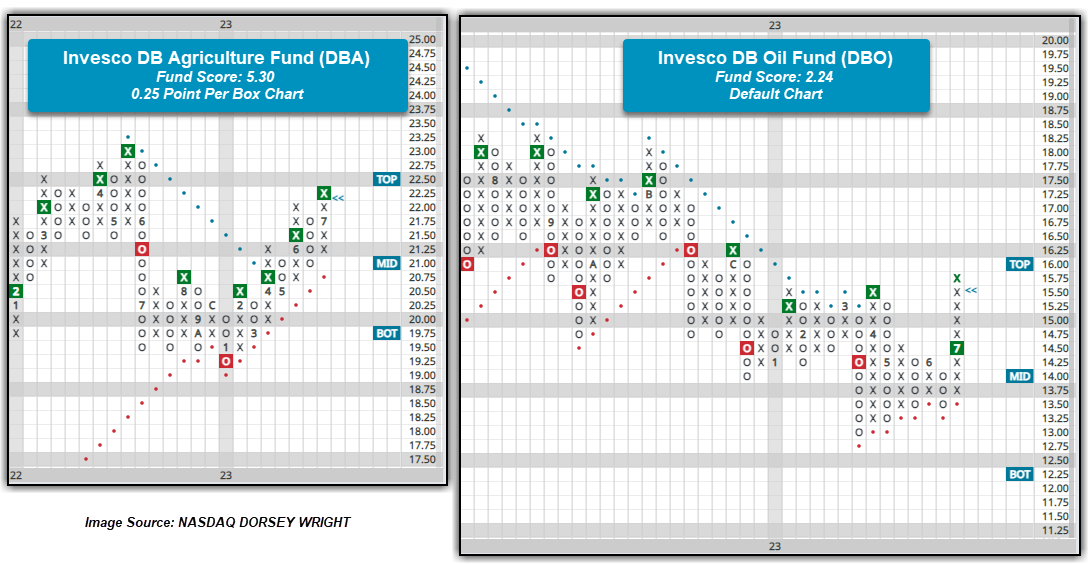
Agriculture commodity prices have advanced due to news about notable decreases in the global wheat and rice supply over the past week with the Invesco DB Agriculture Fund DBA adding 2.85% (7/18 to 7/25). This action led DBA to break a double top at $22.25 on its 0.25 point per box chart for a fourth buy signal since February. The fund possesses a fund score of 5.30, well above the average score for a fund within the space at 3.35, and weekly momentum is back positive for the fund. Those who may seek exposure could look to add on a reversal back into Os at $21.50. From here, resistance on the 0.25 point per box chart for DBA lies at $23, the May 2022 rally high, while support lies at $21 and $20.75, the bullish support line.
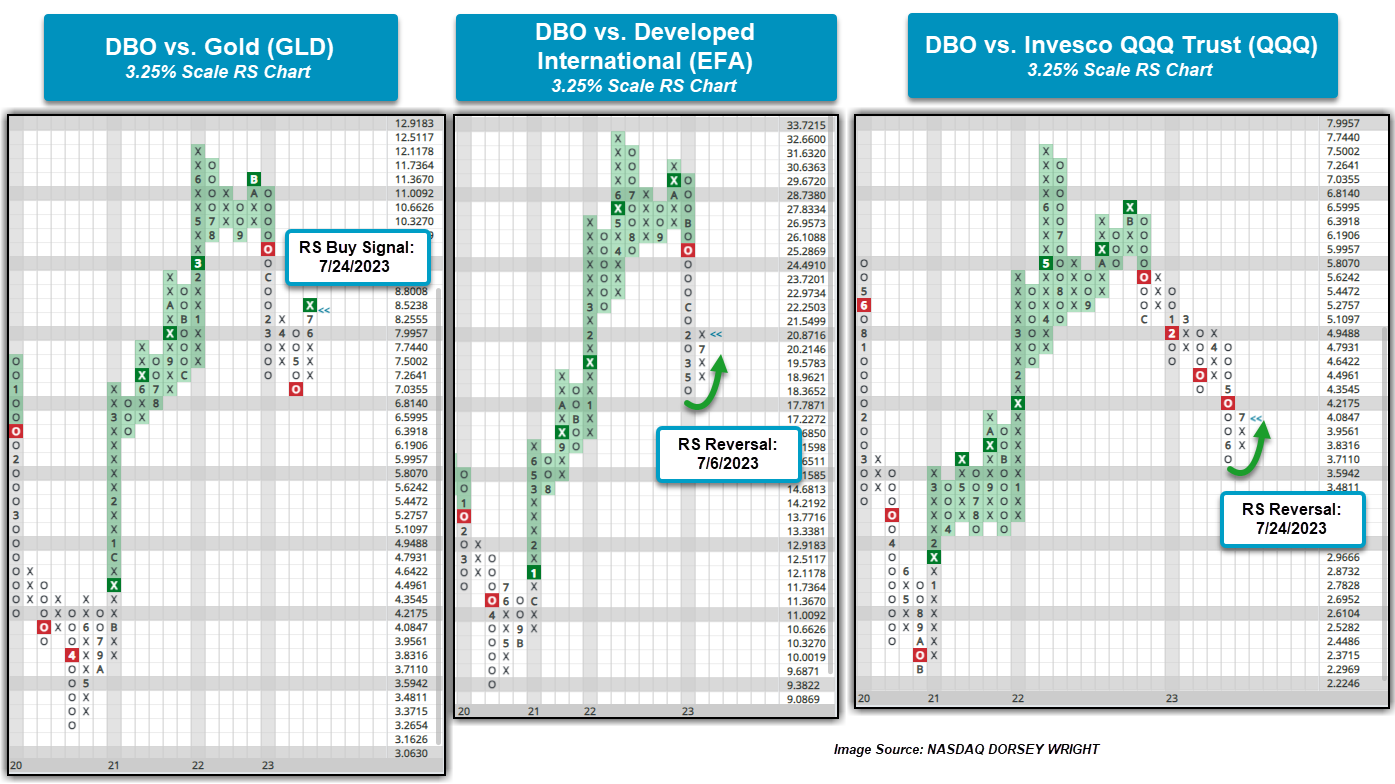
Meanwhile, Crude Oil CL/ advanced 5.25% to give a second buy signal on its default chart at $78 and brought the Invesco DB Oil Fund DBO to $15.75, the fund’s 2023 chart high. Unlike the Crude Oil chart, DBO has maintained a buy signal and a positive trend since the middle of April. The rally this month brought a second buy signal with the double top break at $14.50 and brought monthly momentum for the fund back to positive for the first time in eleven months. DBO now resides in overbought territory and the technical picture is still one that needs improvement as the fund score is below the acceptable 3 threshold, so we would pause before looking to add exposure to DBO. As the RS charts below will exhibit though, DBO has begun to show improvement from an RS standpoint not just a trending one.
The three RS charts below compare the Invesco DB Oil Fund DBO to Gold (GLD), Developed International EFA, and the QQQ’s, on a 3.25% scale.
Gold GLD had a notable start to the year through the latter part of May when the precious metal began to move lower. This roughly coincides with the time Crude Oil began to perk up, which can be seen on the DBO chart above. Oil has outpaced Gold since that time, which led to the reversal into Xs on the RS chart, and ultimately the switch to an RS buy signal, favoring Oil, following Monday’s action. Most of the buy signals Commodities have picked up this week have been primarily due to the Oil and Energy space showing positive long-term RS versus low RS representatives from Fixed Income and Currencies.
Although not a change in long-term RS, the charts of DBO versus EFA and QQQ have moved back into X’s this month indicating positive short-term RS for the commodity over leaders within the International and Domestic Equities. Granted there have been multiple reversals into Xs this year on the RS chart of DBO versus QQQ that have ultimately not led to a long-term change in relative strength. This serves as a great example that funds from all asset classes can go through brief periods of out- or underperformance, but that the long-term RS signal dictates where a long-term trend of out- or underperformance lies. From here, Oil would need to see continued improvement along with a potential downside movement from International and Domestic Equities to ultimately see the middle and left-hand RS charts switch to favor DBO over the long term. Investors should continue to monitor action on the chart of Crude for a potential breakout of the trading range at $84 as this would indicate a potential for further upside out of the commodity. Continued trading within the current range for Crude would confirm this recent rally being short-term in nature.

The past week saw no significant technical developments in the Technology, Basic Materials, Consumer Non-Cyclical, Healthcare, Energy, Financials or Real Estate Sectors. Those that saw noteworthy movement are included below, in order of their relative strength ranking in the DALI domestic equity sector rankings. Sector designations are based on DALI sector rankings and are as follows: 1 - 3 overweight, 4 - 7 equal-weight, and 8 - 11 underweight.
Industrials- Overweight
Industrials maintain the 2nd spot with the broad rankings this week, lagging only Technology by just over 20 buy signals. The pair have separated themselves nicely from the rest of the pack and continue to flex their muscles from a returns perspective. XLI holds a strong fund score and continues to march higher this week but is close to reaching overbought conditions at the time of this writing. Underneath the hood, the sector is picking up from an earnings perspective. A big loser this week was Raytheon (RTX) which tumbled on the news of a slew of engine recalls. Consider moving out of this technically unacceptable name into another one from the sector, that being Boeing (BA). The stock moved to new 52-week highs on reports of strong operating cash flows. BA is an actionable 3/5’er at current levels.
Consumer Discretionary – Equal Weight
The Discretionary Select Sector SPDR Fund XLY was down 2.6% over the past week, but the fund has still yet to reverse into Os on its default chart. From here, a reversal would come with a move below $170, and we would look for the fund to continue to consolidate at current levels. Pulte Group PHM is a homebuilding name that might not get as much attention as its counterparts, DHI and LEN, but the company reported earnings yesterday and beat expectations. While most homebuilders have had revenues retract year-over-year, PHM saw a roughly 8% increase compared to Q2 2022. The stock is a 4 for 5’er that ranks in the top decile of the Building sector matrix and is currently trading at all-time highs. PHM is actionable on a pullback toward $80. Notable earnings upcoming are Ford F, Comcast CMCSA, and McDonald's MCD reporting on 7/27; Norwegian NCLH, Marriot MAR, and Starbucks SBUX reporting on 8/1.
Utilities – Underweight
Utilities perked up this past week with XLU adding 4.32%. On the more sensitive 0.50 point per box chart, XLU did return to a buy signal and move back into a positive trend, but the fund still hasn’t shown the same improvement on its default chart. Earnings for the sector begin in earnest on 7/27 with PG&E PCG, a 5 for 5’er in the sector trading near multi-year highs, along with American Electric Power AEP and Centerpoint Energy CNP all reporting on Thursday. Edison International EIX joins the aforementioned three, while First Energy FE will report next week on 8/1.
Communication Services- Underweight
Communication Services slumped back into the 10th position of the DALI rankings this week, but it should be noted that the fall comes from the close race for signals in the bottom half of the rankings rather than overarching weakness from the sector as a whole. Several names are on the docket for earnings this week, including Alphabet (GOOGL & GOOG) which jumped on strong results, and META which reports after close on Wednesday. DIS continues to be a name to avoid, now within earshot of 2023 lows and on a string of consecutive sell signals. Comcast (CMCSA) is a more traditional communication name you may consider for exposure to the media subsector.
International equities moved out of the top-ranked position in the DALI asset class rankings over the past week, as domestic equities advanced into the top spot. While the two asset classes are technically tied in RS buy signals at 260 a piece, domestic equities get the top position by nature of the tie-breaker rules, as we covered in yesterday’s report. Even though international equities may not be in the top position anymore, the downtick in the ranking was not due to weakness in the asset class, but rather simply a result of the consistent improvement in domestic stocks. The 260 tally signal count for international equities is right at the multi-year tally high seen in January 2021 and has continued to gain steadily since the end of May, advancing 12 signals in June. We have seen international equities garner higher buy signal counts on just two other occasions since 2002, from mid-2009 to mid-2010, and from mid-2017 to mid-2018. The last period of sustained strength for international equities came from late 2004 into 2007. During that time, the international equities asset class did not surpass the same buy signal count where it currently resides. Therefore, the movement of international equities down into the second-ranked position should not be considered a negative for the asset class, as most broad representatives still show resilient technical pictures.

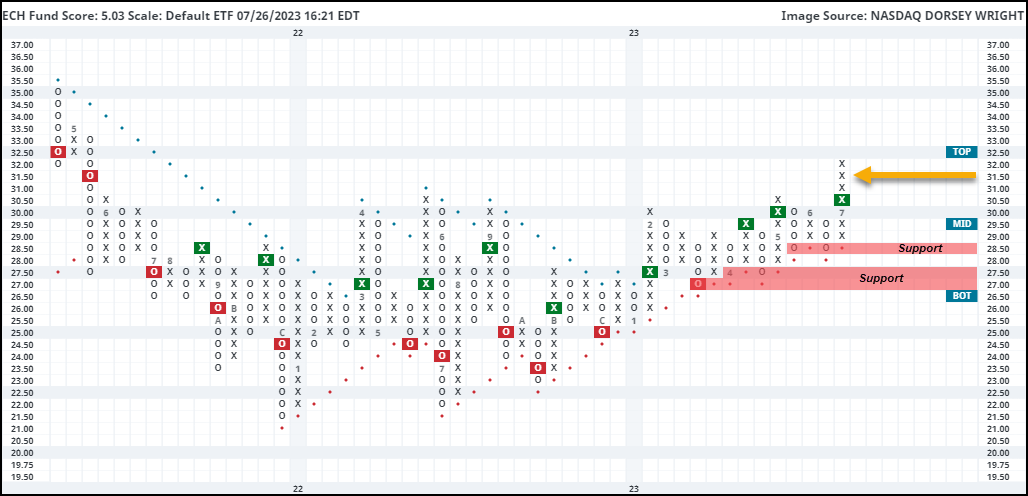
One area that has continued to demonstrate strength in foreign equities has been Latin America, which still sits as the highest-ranked group on the Asset Class Group Scores (ACGS) page at a recent average score posting of 5.12. Chile has been one of the more recent areas of improvement, as the country just moved back into the top quartile of our NDW Country Index Matrix Rankings over the past week at the current position of 10th out of the 42 names. This improvement can also be seen through the iShares MSCI Chile ETF ECH, which pushed higher earlier this month to break a spread triple top at $31 before reaching $32. This breaks the fund out of an extended consolidation range, seeing the highest price levels since May 2021. ECH has a strong 5.01 fund score and has maintained a positive trend since January, speaking to the long-term technical strength. Weekly and monthly momentum each recently flipped positive as well, suggesting the potential for further upside from here. Initial support is offered at $28.50 with further support potentially seen at $27.50 and $27.
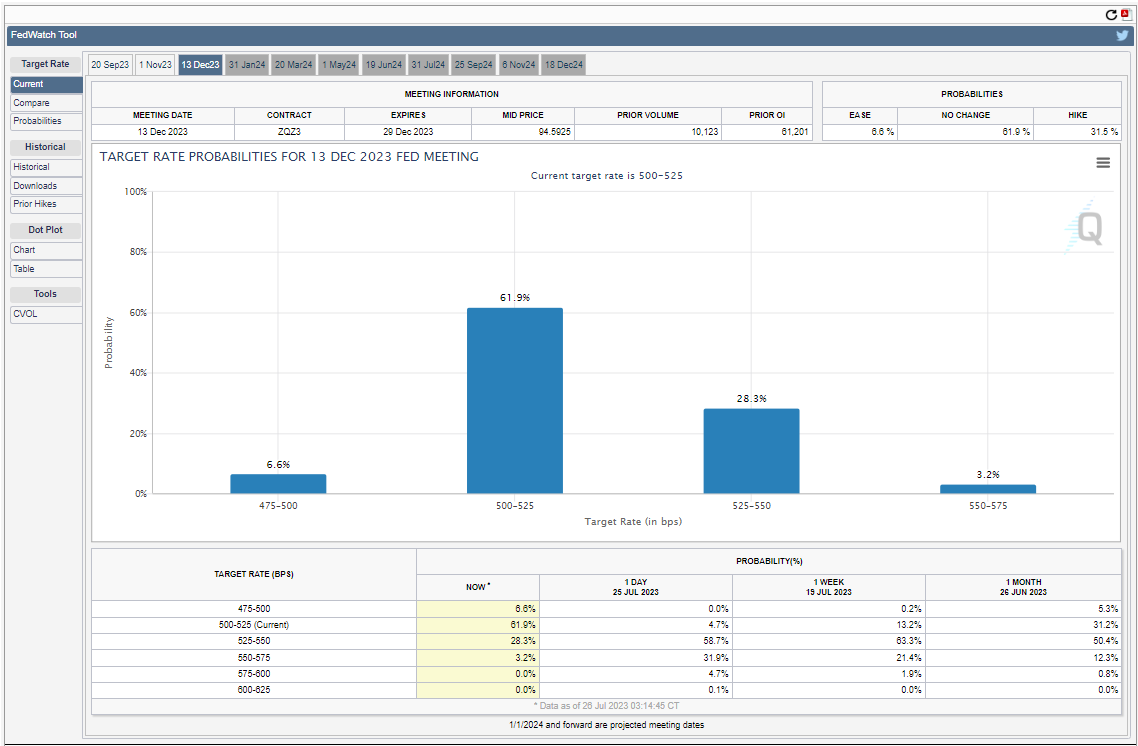
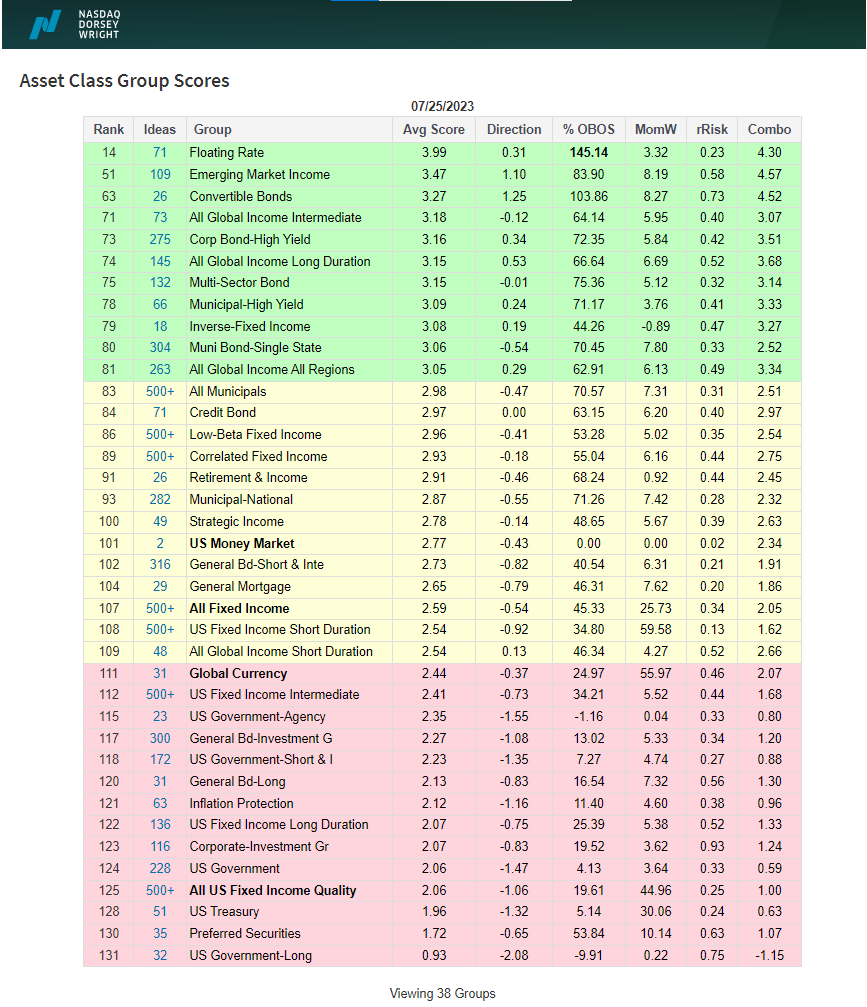
The Fed wrapped up its July meeting on Wednesday. The FOMC raised the target for the fed funds by 25 bps to 525 – 550 bps as had been widely expected. In comments following the meeting Chair Powell said the committee’s decisions regarding future rate hikes would continue to be data-driven, leaving open the possibility that we could be at the end of the tightening cycle if inflation continues to moderate. The fed futures market shifted following the meeting and by the end of the day was pricing in a 25 bps cut from the new 525-550 bps target by the end of the year. US Treasury yields fell with the US Treasury 10-year Yield Index (TNX) closing just above 3.85%.
The fixed income rankings in the Asset Class Group Scores (ACGS) look largely the same as they have for the last few weeks. The bulk of strength in the market is concentrated in groups outside the US core. Floating rates remain atop the rankings with an average group score of 3.99, while emerging market income, convertible bonds, and high-yield corporates all sit in the green zone with scores north of 3.0. Meanwhile, most of the core groups like US Treasuries, US Government, and investment grade corporates, remain in the red zone with scores below 2.5. If the market’s view is correct and we have reached the end of the tightening cycle and the Fed begins cutting rates this year, we could expect to see the core US groups strengthen, but at this point, they remain a clear area of weakness.
Remember, these are technical comments only. Just as you must be aware of fundamental data for the stocks we recommend based on technical criteria in the report, so too must you be aware of important data regarding delivery, market moving government releases, and other factors that may influence commodity pricing. We try to limit our technical comments to the most actively traded contracts in advance of delivery, but some contracts trade actively right up to delivery while others taper off well in advance. Be sure you check your dates before trading these contracts. For questions regarding this section or additional coverage of commodities email will.gibson@nasdaq.com.
Data represented in the table below is through 7/25/2023:
Broad Market Commodities Report
| Symbol | Name | Price | PnF Trend | RS Signal | RS Col. | 200 Day MA | Weekly Mom |
|---|---|---|---|---|---|---|---|
| CL/ | Crude Oil Continuous | 79.63 | Positive | Buy | O | 77.15 | +7W |
| DBLCIX | Deutsche Bank Liquid Commodities Index | 507.93 | Positive | Sell | O | 502.81 | +7W |
| DWACOMMOD | DWA Continuous Commodity Index | 839.42 | Positive | Buy | O | 789.65 | +8W |
| GC/ | Gold Continuous | 1963.70 | Negative | Sell | X | 1874.89 | +2W |
| HG/ | Copper Continuous | 3.91 | Negative | Sell | X | 3.86 | +7W |
| ZG/ | Corn (Electronic Day Session) Continuous | 557.50 | Negative | Sell | O | 637.89 | -4W |
As discussed in yesterday’s featured article and today's (7/26) Major Index & DALI piece, commodities (especially agricultural) have recently enjoyed a nice tailwind due to various supply constraints – whether it be OPEC+ talk, the dissolution of the Black Sea Grain deal, or India’s cutback on rice exports. Consequently, we have seen material developments on a few Point & Figure charts.
First, consider the iShares S&P GSCI Commodity-Indexed Trust (GSG). The fund currently sits on two consecutive buy signals near the top of its trading band, distancing itself from a (now apparent) key support level at $18.75 (March – May 2023 lows). Note the last time we saw a second consecutive buy signal here was January 2022. WisdomTree Continuous Commodity Index Fund (GCC) also recently returned to a buy signal and reentered a positive trend.
One outlier in the broad commodity fund landscape is the Invesco DB Commodity Index Tracking Fund (DBC). Unlike GSG and GCC, DBC has not returned to a Point & Figure buy signal and now faces a substantial test at $24.50, resistance from April 2023 and prior support from March - June 2022. A breakout at $25 would be noteworthy and further evidence of broad commodity strength.

To some extent, rising commodity prices are a good thing to see because if commodity prices continued to decline indefinitely it would indicate a slowing economy (demand and/or growth). However, if commodity prices rise too quickly or too high, then inflation catches a second wind, and the Federal Reserve could interpret that as a signal to maintain their pace of interest rate hikes (a headwind for traditional equity and fixed income investments). It is most certainly a delicate balance.
Although, one commodity in particular we like to see moving higher is copper (HG/). The base metal has traded beneath its bearish resistance (i.e., negative trend) line for most of this year, but recently put in a series of higher lows to test resistance at around $3.96. Due to copper’s widespread application, investors will sometimes use this as a proxy for economic activity/health. In addition to a potential breakout at $4, investors should watch copper’s relative performance to gold (GC/). HG/ remains on a relative strength sell signal against GC/ at this time, but recently reversed up into Xs which is a good sign.

Average Level
45.81
| < - -100 | -100 - -80 | -80 - -60 | -60 - -40 | -40 - -20 | -20 - 0 | 0 - 20 | 20 - 40 | 40 - 60 | 60 - 80 | 80 - 100 | 100 - > |
|---|---|---|---|---|---|---|---|---|---|---|---|
|
Buy signalfxe
|
|||||||||||
|
Buy signalicf
|
|||||||||||
|
Buy signaleem
|
Buy signaloneq
|
Buy signalvoog
|
|||||||||
|
Buy signalijr
|
Buy signalXLG
|
Buy signalRSP
|
|||||||||
|
Sell signaldx/y
|
Buy signaliwm
|
Sell signalijh
|
Buy signalVOOV
|
||||||||
|
Buy signalshy
|
Sell signaltlt
|
Buy signallqd
|
Buy signalhyg
|
Sell signaldvy
|
Buy signaldia
|
Buy signalspy
|
|||||
|
Sell signalief
|
Sell signalagg
|
Sell signalGLD
|
Buy signalefa
|
Buy signalqqq
|
Buy signaluso
|
Buy signalgcc
|
Buy signalgsg
|
||||
| < - -100 | -100 - -80 | -80 - -60 | -60 - -40 | -40 - -20 | -20 - 0 | 0 - 20 | 20 - 40 | 40 - 60 | 60 - 80 | 80 - 100 | 100 - > |
| AGG | iShares US Core Bond ETF |
| USO | United States Oil Fund |
| DIA | SPDR Dow Jones Industrial Average ETF |
| DVY | iShares Dow Jones Select Dividend Index ETF |
| DX/Y | NYCE U.S.Dollar Index Spot |
| EFA | iShares MSCI EAFE ETF |
| FXE | Invesco CurrencyShares Euro Trust |
| GLD | SPDR Gold Trust |
| GSG | iShares S&P GSCI Commodity-Indexed Trust |
| HYG | iShares iBoxx $ High Yield Corporate Bond ETF |
| ICF | iShares Cohen & Steers Realty ETF |
| IEF | iShares Barclays 7-10 Yr. Tres. Bond ETF |
| LQD | iShares iBoxx $ Investment Grade Corp. Bond ETF |
| IJH | iShares S&P 400 MidCap Index Fund |
| ONEQ | Fidelity Nasdaq Composite Index Track |
| QQQ | Invesco QQQ Trust |
| RSP | Invesco S&P 500 Equal Weight ETF |
| IWM | iShares Russell 2000 Index ETF |
| SHY | iShares Barclays 1-3 Year Tres. Bond ETF |
| IJR | iShares S&P 600 SmallCap Index Fund |
| SPY | SPDR S&P 500 Index ETF Trust |
| TLT | iShares Barclays 20+ Year Treasury Bond ETF |
| GCC | WisdomTree Continuous Commodity Index Fund |
| VOOG | Vanguard S&P 500 Growth ETF |
| VOOV | Vanguard S&P 500 Value ETF |
| EEM | iShares MSCI Emerging Markets ETF |
| XLG | Invesco S&P 500 Top 50 ETF |
| Symbol | Company | Sector | Current Price | Action Price | Target | Stop | Notes |
|---|---|---|---|---|---|---|---|
| GPK | Graphic Packaging Intl. | Forest Prods/Paper | $24.32 | 21 - 23 | 26 | 18 | 5 for 5'er, #2 of 15 in favored FORE sector matrix, LT pos mkt RS, triple top, 1.3% yield, Earn. 8/1 |
| V | Visa Inc. | Finance | $238.69 | 210s - 220s | 262 | 188 | 5 for 5'er top third of FIN sector matrix, LT pos mkt RS, spread quintuple top, Earn. 7/25 |
| BJRI | BJ's Restaurants Inc. | Restaurants | $33.34 | low 30s | 55 | 26 | 3 for 5'er, top third of favored REST sector matrix, triple top, pullback from 52-week high, R-R>3.5, Earn. 7/27 |
| TXRH | Texas Roadhouse, Inc. | Restaurants | $112.40 | 100s | 125 | 90 | 5 TA rating, top half REST sector matrix, consec. buy signals, LT RS buy, 2.10% yield, Earn. 7/27 |
| BRK.B | Berkshire Hathaway Inc | Insurance | $347.58 | mid 300s - low 330s | 396 | 280 | 5 TA rating, top third of INSU sector matrix, LT pos. trend, LT RS buy, buy-on-pullback |
| DRI | Darden Restaurants, Inc. | Restaurants | $167.82 | mid 150s - mid 160s | 192 | 130 | 5 TA rating, pos. trend, LT RS buy, pos. weekly mom., recent price normalization |
| CMCSA | Comcast Corporation | Media | $43.30 | hi 30s - low 40s | 50 | 33 | 4 for 5'er, top third of MEDI sector matrix, multiple consec buy signal, pullback to middle of trading band, 2.94% yield, Earn. 7/27 |
| VVV | Valvoline Inc | Autos and Parts | $39.45 | mid - hi 30s | 53 | 30 | 5 TA rating, top third in the AUTO sector RS matrix, consec. buy signals, buy-on-pullback, R-R > 2, Earn. 8/1 |
| HCA | HCA Healthcare Inc. | Healthcare | $285.53 | mid 270s - lo 300s | 392 | 236 | 5 TA rating, top 20% of HEAL sector, consec. buy signals, LT market RS buy, buy-on-pullback, Earn. 7/27 |
| PEP | PepsiCo, Inc. | Food Beverages/Soap | $191.36 | 180 - lo 190s | 250 | 152 | 4 TA rating, top third of FOOD sector matrix, LT RS buy, normalized entry point, 2.72% yield |
| ANSS | Ansys Inc | Software | $344.17 | 320s - 340s | 404 | 280 | 5 for 5'er, top third of SOFT sector matrix, LT pos mkt RS, multiple consec buy signals, Earn. 8/2 |
| SEM | Select Medical Holdings Corporation | Healthcare | $31.79 | hi 20s - lo 30s | 52.50 | 23 | 5 TA rating, top third of HEAL sector matrix, LT RS buy, normalized prices, recent pos. wkly mom., R-R > 3, Earn. 8/3 |
| MDLZ | Mondelez International, Inc. Class A | Food Beverages/Soap | $74.40 | hi 60s - mid 70s | 95 | 59 | 4 for 5'er. top 25% of favored FOOD sector matrix, multiple buy signals, pullback from ATH, 2.1% yield, Earn. 7/27 |
| AJG | Arthur J. Gallagher & Co. | Insurance | $220.32 | hi 200s - hi 210s | 298 | 180 | 5 for 5'er, 10 of 71 in favored INSU sector matrix, LT pos mkt RS, R-R>2.0, Earn. 7/27 |
| RSG | Republic Services, Inc. | Waste Management | $153.95 | lo 140s - mid 150s | 190 | 120 | 5 TA rating, top third of WAST sector matrix, consec. buy signals, pos. wkly mom., Earn. 7/31 |
| ALKS | Alkermes Incorporated | Biomedics/Genetics | $30.84 | hi 20s - low 30s | 48 | 24 | 5 for 5'er, top half of favored BIOM sector matrix, spread triple top, pull back from 52-week high, R-R>3.0, Earn. 7/27 |
| AFL | AFLAC Incorporated | Insurance | $72.50 | hi 60s - lo 70s | 87 | 56 | 5 TA rating, top quintile of INSU sector matrix, LT pos. trend, RS buy, recent consec. buy signals, Earn. 8/1 |
| ACA | Arcosa Inc | Transports/Non Air | $76.00 | low-to-mid $70s | 98 | 65 | 4 for 5'er, #8 of 50 in favored TRAN sector matrix, one box from peer RS buy signal, R-R>2.0, Earn. 8/1 |
| LIN | Linde Plc | Chemicals | $391.04 | 370s - 380s | 440 | 316 | 5 for 5'er, #6 of 47 in favored CHEM sector matrix, LT pos mkt RS, triple top, 1.35% yield |
| VRTX | Vertex Pharmaceuticals Incorporated | Biomedics/Genetics | $358.06 | hi 330s - lo 370s | 444 | 280 | 4 TA rating, top half of BIOM sector matrix, consec. buy signals, LT RS buy, pos. wkly and mo. momentum flips, Earn. 8/1 |
| SPB | Spectrum Brands Holdings | Food Beverages/Soap | $77.62 | mid-to-hi 70s | 97 | 63 | 5 for 5'er, #3 of 78 in favored FOOD sector matrix, LT pos mkt RS, 2.2% yield, Earn 8/10 |
| FERG | Ferguson PLC | Building | $160.98 | lo 150s - mid 160s | 204 | 132 | 4 TA rating, LT mkt RS buy & pos. trend, consec. buy signals, near-term price consolidation |
| LULU | Lululemon Athletica Inc. | Retailing | $382.12 | 370s - 390s | 452 | 320 | 5 for 5'er, top 25% of RETA sector matrix, triple top |
| INTU | Intuit Inc. | Software | $496.47 | 470s - 490s | 672 | 400 | 4 for 5'er, favored SOFT sector matrix, LT pos mkt RS, spread quintuple top, pos trend flip, Earn. 8/21 |
| HWC | Hancock Whitney Corp | Banks | $42.98 | hi 30s - mid 40s | 66 | 34 | 5 TA rating, top half of BANK sector matrix, LT RS buy, pos. wkly mom., 2.83% yield |
| MSFT | Microsoft Corporation | Software | $350.98 | 330s - 350s | 376 | 272 | 5 for 5'er, top third of favored SOFT sector matrix, LT pos RS, multiple buy signals, pullback from ATH |
| Symbol | Company | Sector | Current Price | Action Price | Target | Stop | Notes |
|---|---|---|---|---|---|---|---|
| LAUR | Laureate Education Inc | Business Products | $12.55 | (11.50-12.50) | 6 | 13.50 | 2 for 5'er, LT negative trend & market RS, spread triple bottom, R-R>3.0, Earn. 8/2 |
| Symbol | Company | Sector | Current Price | Action Price | Target | Stop | Notes |
|---|---|---|---|---|---|---|---|
| UBS | UBS AG (Switzerland) ADR | Banks | $21.71 | 18 - 22 | 38.50 | 16 | UBS has moved into heavily overbought territory. OK to hold here. Raise stop to $17.50. |
| Comment | |||||||
|---|---|---|---|---|---|---|---|
|
|
|||||||
MSFT Microsoft Corporation R ($335.46) - Software - MSFT is a 5 for 5'er that ranks 36th of 146 names in the favored software sector matrix and has been on peer and market RS buy signals since 2014 and 2015, respectively. On its default chart, the stock has given five consecutive buy signals and reached a new all-time high earlier this month before; it has now pulled back to the middle of its trading band, offering an entry point for long exposure. Positions may be added in the $330s to $350s and we will set our initial stop at $272. We will use the top of the trading band $376, as our short-term price objective.
| 23 | |||||||||||||||||||||||||||||||||||||||||||||||||||||
| 364.00 | X | 364.00 | |||||||||||||||||||||||||||||||||||||||||||||||||||
| 360.00 | X | O | 360.00 | ||||||||||||||||||||||||||||||||||||||||||||||||||
| 356.00 | X | O | 356.00 | ||||||||||||||||||||||||||||||||||||||||||||||||||
| 352.00 | X | O | 352.00 | ||||||||||||||||||||||||||||||||||||||||||||||||||
| 348.00 | X | X | O | 348.00 | |||||||||||||||||||||||||||||||||||||||||||||||||
| 344.00 | X | O | X | O | 344.00 | ||||||||||||||||||||||||||||||||||||||||||||||||
| 340.00 | X | O | X | O | 340.00 | ||||||||||||||||||||||||||||||||||||||||||||||||
| 336.00 | 6 | X | O | X | 336.00 | ||||||||||||||||||||||||||||||||||||||||||||||||
| 332.00 | X | O | X | O | X | Mid | 332.00 | ||||||||||||||||||||||||||||||||||||||||||||||
| 328.00 | X | O | X | 7 | 328.00 | ||||||||||||||||||||||||||||||||||||||||||||||||
| 324.00 | X | O | 324.00 | ||||||||||||||||||||||||||||||||||||||||||||||||||
| 320.00 | X | 320.00 | |||||||||||||||||||||||||||||||||||||||||||||||||||
| 316.00 | O | • | X | 316.00 | |||||||||||||||||||||||||||||||||||||||||||||||||
| 312.00 | O | X | X | • | 5 | 312.00 | |||||||||||||||||||||||||||||||||||||||||||||||
| 308.00 | O | X | X | O | X | O | • | X | 308.00 | ||||||||||||||||||||||||||||||||||||||||||||
| 304.00 | O | X | O | X | O | X | O | • | X | 304.00 | |||||||||||||||||||||||||||||||||||||||||||
| 300.00 | O | X | O | X | 2 | 3 | X | 4 | • | X | 300.00 | ||||||||||||||||||||||||||||||||||||||||||
| 296.00 | O | X | O | O | X | O | X | O | • | • | X | 296.00 | |||||||||||||||||||||||||||||||||||||||||
| 292.00 | O | X | O | X | O | X | O | X | • | X | • | 4 | X | Bot | 292.00 | ||||||||||||||||||||||||||||||||||||||
| 288.00 | O | X | O | X | O | X | X | O | X | O | X | • | X | O | • | X | O | X | 288.00 | ||||||||||||||||||||||||||||||||||
| 284.00 | O | X | O | X | O | X | O | X | O | X | O | X | O | • | 8 | O | • | X | O | X | 284.00 | ||||||||||||||||||||||||||||||||
| 280.00 | O | O | X | O | X | O | X | O | O | X | O | • | X | O | • | X | O | X | 280.00 | ||||||||||||||||||||||||||||||||||
| 276.00 | O | X | O | X | O | O | X | 5 | 6 | • | X | O | • | X | X | O | 276.00 | ||||||||||||||||||||||||||||||||||||
| 272.00 | O | O | • | O | O | X | O | • | • | X | O | • | X | O | X | • | 272.00 | ||||||||||||||||||||||||||||||||||||
| 268.00 | • | O | X | X | O | X | 7 | • | • | X | O | • | X | O | X | • | 268.00 | ||||||||||||||||||||||||||||||||||||
| 264.00 | • | O | X | O | X | O | X | O | X | O | X | • | X | O | X | • | • | X | O | X | • | 264.00 | |||||||||||||||||||||||||||||||
| 260.00 | • | O | X | O | X | O | X | O | X | O | X | O | X | 9 | X | O | • | X | • | X | O | X | X | • | 260.00 | ||||||||||||||||||||||||||||
| 256.00 | • | O | X | O | X | O | X | O | O | X | O | X | O | X | O | C | X | O | • | X | O | X | O | X | • | 256.00 | |||||||||||||||||||||||||||
| 252.00 | • | O | O | X | O | X | O | X | O | • | O | • | O | X | O | X | O | • | 2 | O | X | O | X | • | 252.00 | ||||||||||||||||||||||||||||
| 248.00 | • | O | O | X | O | • | • | • | O | A | X | X | O | X | O | X | 3 | O | • | 248.00 | |||||||||||||||||||||||||||||||||
| 244.00 | • | O | • | O | X | O | X | O | X | O | O | X | X | • | 244.00 | ||||||||||||||||||||||||||||||||||||||
| 240.00 | • | O | X | O | X | O | X | O | X | O | X | • | 240.00 | ||||||||||||||||||||||||||||||||||||||||
| 236.00 | • | O | O | X | O | X | O | X | O | X | • | 236.00 | |||||||||||||||||||||||||||||||||||||||||
| 232.00 | • | O | X | O | X | 1 | X | O | • | 232.00 | |||||||||||||||||||||||||||||||||||||||||||
| 228.00 | • | O | X | O | X | O | X | • | 228.00 | ||||||||||||||||||||||||||||||||||||||||||||
| 224.00 | O | X | B | X | • | O | X | • | 224.00 | ||||||||||||||||||||||||||||||||||||||||||||
| 220.00 | O | O | X | • | O | • | 220.00 | ||||||||||||||||||||||||||||||||||||||||||||||
| 216.00 | O | • | • | 216.00 | |||||||||||||||||||||||||||||||||||||||||||||||||
| 23 |
| CVNA Carvana Company ($43.01) - Autos and Parts - CVNA reversed down into Os and broke a double bottom at $43 for the first sell signal since April. The sell signal follows a reversal down into Os on the market RS chart following Friday's action and into Os on the peer RS chart following Tuesday's action. The stock is now a 3 for 5'er with the RS chart reversals into Os, but it still resides in the top quintile of the Autos and Parts sector matrix. Support now lies at $37 and $35. |
| GOOGL Alphabet Inc. Class A ($129.27) - Internet - GOOGL returnd to a buy signal today on strong earnings results. This perfect 5/5'er has had a strong year, leading the Communications Services sector in line with other tech-focused names from the space. All things considered, the name is still actionable at current levels and sits at new 2023 highs as of now. Support is offered below in the $116-$120 range. |
| LSCC Lattice Semiconductor Corp ($85.01) - Semiconductors - LSCC moved lower Wednesday to break a double bottom at $85, marking a second consecutive sell signal. This also violated the bullish support line, moving the stock into a negative trend and demoting it to a 2 for 5 TA rating. Monthly momentum also recently flipped negative, suggesting the potential for further weakness. The weight of the technical evidence is now negative heading into the company's earnings release on 7/31. Further support may be seen at $84, with additional support offered at $77 and $76. Overhead resistance may be found at $98. |
| ODFL Old Dominion Freight Line, Inc. ($420.75) - Transports/Non Air - Transports (and Industrials in general) continue to chug along from a broad sector perspective. ODFL moved higher with today's action on positive earnings results, sitting at all-time chart highs at the time of this writing. Those looking to add exposure should continue to look for pullbacks/dollar cost averaging in opportunities as the name does sit above the top of its trading band. |
| STLA Stellantis NV ($19.24) - Autos and Parts - STLA broke a triple top at $19 to complete a shakeout pattern, returning the stock to a buy signal and marking a 52-week high. STLA is a 4 for 5'er that ranks in the top half of the Autos and Parts sector and is accompanied by a yield of roughly 8%. From here, resistance lies at $21, the stock's 2021 chart highs, while support lies at $15.50 and $15, the bullish support line. |
| Name | Option Symbol | Action | Stop Loss |
|---|---|---|---|
| Gilead Sciences, Inc. - $76.94 | GILD2317K77.5 | Buy the November 77.50 calls at 3.85 | 74.00 |
| Name | Option | Action |
|---|---|---|
| The Hartford Financial Services Group ( HIG) | Sep. 70.00 Calls | Raise the option stop loss to 5.30 (CP: 6.30) |
| Fiserv, Inc. ( FI) | Sep. 110.00 Calls | Stopped at 18.90 (CP: 18.10) |
| Discover Financial Services ( DFS) | Oct. 100.00 Calls | Stopped at 0.00 (CP: 106.34) |
| Name | Option Symbol | Action | Stop Loss |
|---|---|---|---|
| Paypal Holdings Inc - $73.39 | PYPL2315X72.5 | Buy the December 72.50 puts at 5.75 | 78.00 |
| Name | Option | Action |
|---|---|---|
|
|
||
| Name | Option Sym. | Call to Sell | Call Price | Investment for 500 Shares | Annual Called Rtn. | Annual Static Rtn. | Downside Protection |
|---|---|---|---|---|---|---|---|
| Caesars Entertainment Inc. $58.10 | CZR2315L60 | Dec. 60.00 | 6.70 | $26,513.85 | 30.93% | 29.29% | 10.23% |
| Name | Action |
|---|---|
| CrowdStrike Holdings, Inc. Class A (CRWD) - 150.94 | Sell the October 155.00 Calls. |
| Roku, Inc. Class A (ROKU) - 70.40 | Sell the October 65.00 Calls. |
| Palantir Technologies Inc. Class A (PLTR) - 16.55 | Sell the November 18.00 Calls. |
| Schlumberger Limited (SLB) - 57.88 | Sell the November 60.00 Calls. |
| Aptiv PLC (APTV) - 109.90 | Sell the November 115.00 Calls. |
| Generac Holdings, Inc. (GNRC) - 147.63 | Sell the November 145.00 Calls. |
| Arista Networks Inc (ANET) - 174.09 | Sell the December 180.00 Calls. |
| Norwegian Cruise Line Holdings Ltd. (NCLH) - 20.30 | Sell the December 22.00 Calls. |
| KB Home (KBH) - 54.10 | Sell the October 55.00 Calls. |
| Wynn Resorts, Limited (WYNN) - 108.84 | Sell the December 110.00 Calls. |
| Hess Corporation (HES) - 147.34 | Sell the November 150.00 Calls. |
| Name | Covered Write |
|---|---|
| International Game Technology ( IGT - 33.05 ) | October 33.00 covered write. |
Daily Equity & Market Analysis
Loading, Please Wait...
