
Most Requested Symbols

Each year, we produce 12 articles throughout the last few weeks of the year, all revolving around one central concept. This year, all 12 articles will revolve around the topic of "Enhancing Your Process With Scalable Customization in 2021. Today we discuss the Custom Modeler tool and static allocations.
Today's featured stock is Texas Roadhouse, Inc. (TXRH)
BLNK, HIBB, LNT & OSIS
Call: Archer-Daniels-Midland Company (ADM); Put: Duke Energy Corporation (DUK); Covered Write: Cloudflare Inc (NET).
We are excited to announce phase three of the Nasdaq Dorsey Wright Model Builder with the launch of Matrix and FSM-based Relative Strength (RS) Testing Service. As part of this launch, we are granting you free access to the service for the remainder of 2020. The tool is designed to help you more easily design, test, implement, and monitor custom models powered by the Nasdaq Dorsey Wright methodology. Please see below for replays of our latest webinar series covering the different aspects of the tool.
11/19/2020: Static Model Builder Demo Replay - Click Here
12/9/2020: Matrix Model Builder Demo Replay - Click here
11/5/2020: FSM Model Builder Demo Replay - Click here
As a result of various sources confirming Santa’s immunity to coronavirus and being Christmas Eve, we studied an old market adage known as the Santa Claus rally. The Santa Claus rally is known to investors as a sustained period in the market that historically brings positive returns, beginning five trading days before year-end and continuing through the first two trading days of the new year. Several variables are speculated to be contributory here, such as year-end tax considerations, decreased institutional volume (thesis being retail investors are more bullish), and year-end bonuses to name a few. Regardless of the rationale, the phenomena has been surprisingly reliable as it relates to the major domestic equity market indices. For example, since the beginning of the 1900s, the Dow Jones Industrial Average returned positive figures over 74% of the time. Since 1957, the S&P 500 has produced positive returns 73% of the time, and the Nasdaq Composite since 1972 has produced positive returns 70% of the time.
Now, after a year of stellar returns can we really expect Santa to visit the ungrateful and greedy investors of the world? From a historical perspective, the answer is yes. In fact, after the market (whether SPX, NASD, or DJIA) returned 10% or more, the percentage of positive returns actually increased for our study, as shown below. Furthermore, on some occasions, we note higher average returns.
However, an observation running against the grain of the previous is the negative slope of these observations, meaning that we are seeing the Santa Claus rally generally decrease in magnitude of returns as of late. There are no free lunches or guarantees in the stock market, and arbitrage is hard to come by, so it will be interesting to watch the relevance of the old market adage in years to come.


Over the last decade, the advisory business has continued to evolve rapidly with the growing trends of lower fees and increased automation. With the influx of low-cost index funds and Robo-advisors offering nearly-free financial planning, investors can now gain beta market exposure at rock-bottom prices without ever setting foot in an advisor's office. The upshot is that it is now more challenging than ever for you as a traditional financial advisor to justify your fee and grow your client base. That said, you must scale your process and sharpen your value proposition as much as possible. To help you do just that, this year's 12 Days of Christmas Series, "Enhancing Your Process With Scalable Customization in 2021," will navigate you through the benefits, use/implementation, and customization of rules-based, Relative Strength-driven guided model portfolios. Additionally, this series will highlight the NDW Model Builder Tool's new features, providing relevant use-cases to help you scale your business in the coming year.
Day 1 - Benefits of Models and a Rules-Based Process
Day 2 - The Relative Strength Process
Day 3 - Model Foundations - The Relative Strength Matrix
Day 4 - Model Foundations – Technical Attributes and the Fund Score Method (FSM)
Day 5 - Model Foundations - Matrix Models
Day 6 - Model Foundations - FSM Models
Day 7 – DALI and Tactical Allocation Models
Thus far in our 12 Days of Christmas Series, “Enhancing Your Process With Scalable Customization in 2021,” we have discussed the basics of relative strength and relative strength-based tools like the matrix. We have also seen how these tools can be used to create scalable, rules-based models, and reviewed some of the existing models on the NDW platform. Now that we’ve reviewed the tools and processes underlying our guided models, we want to turn our attention to the Custom Modeler tool, which can be accessed under Models & Products > Custom Models,
The Custom Modeler allows users to create and backtest their own models using stocks, mutual funds, ETFs, or even existing models. The custom modeler acts as your own personal laboratory, allowing you to mix, match, and then test almost any combination of “ingredients” you can think of.
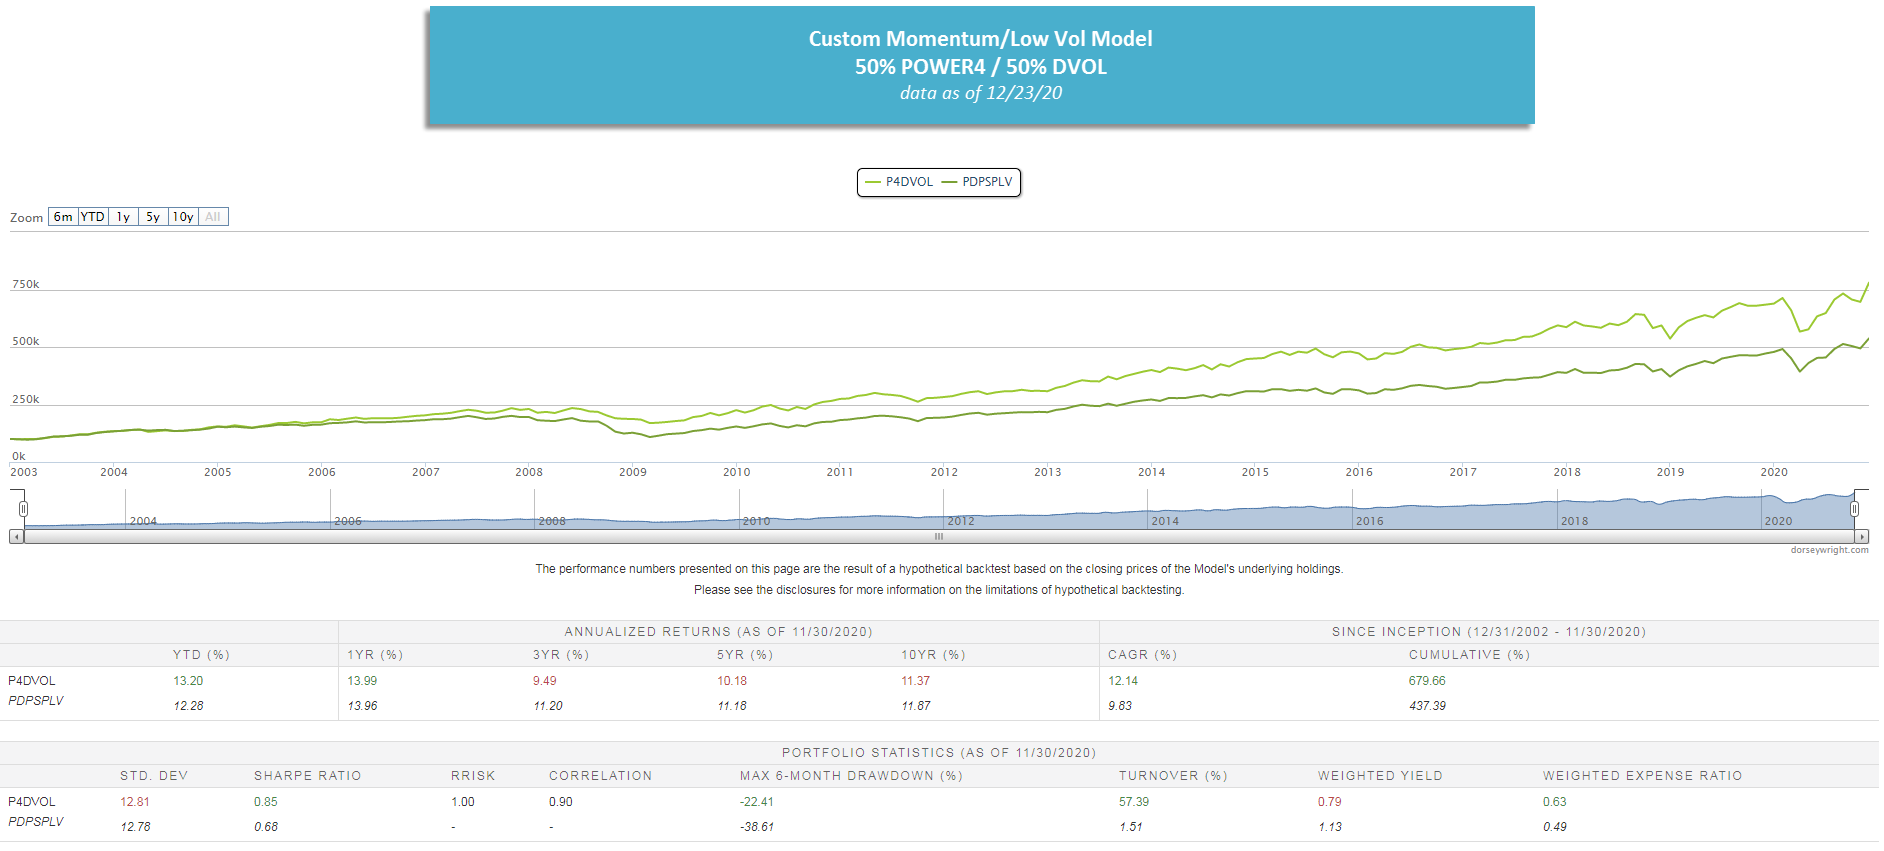
The simplest of the custom models is the static allocation which combines two or more securities using weights that you define. For example, what if instead of using the existing PDPSPLV model, you wanted to create your own custom version of a momentum/low vol strategy using different ETFs and/or guided NDW models? Instead of SPLV, what if you wanted to substitute the First Trust Dorsey Wright Momentum & Low Volatility ETF DVOL? And for momentum, what if you used the DWA Sector 4 Model POWER4 (which was discussed in the article from Day 6 of this series)? This is where the custom modeler comes into play. Below, we created a static allocation to test a simple 50/50 split between the POWER4 model and DVOL to create our own momentum/low vol strategy. The Model Preview page provides yearly returns and various risk statistics that could potentially be used in conversations with clients and prospects.
Custom Models - Where to Start?
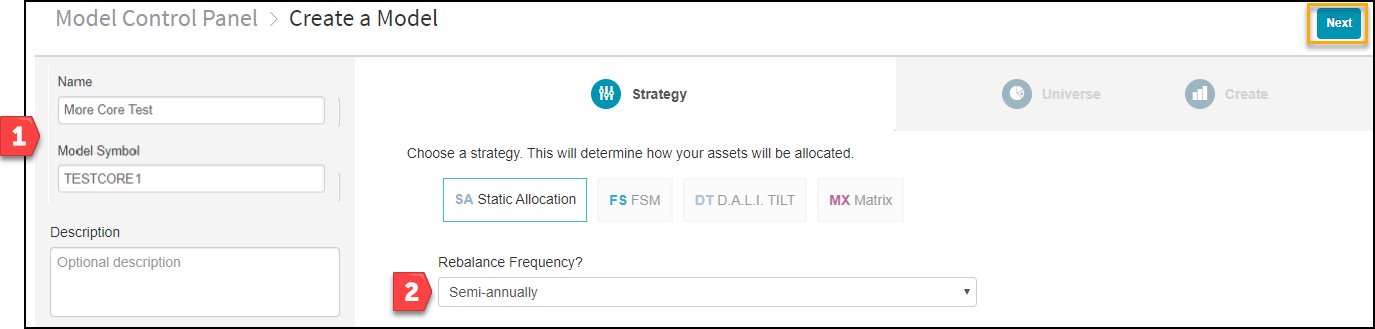
To begin, notice the outlined workflow: developing a "Strategy", selecting a "Universe", and "Creating" a model preview. To create a strategy, first give your model a name, symbol, and description as prompted on the left-hand side. Second, decide if you want it to rebalance; if so, select the desired frequency from the dropdown menu. A rebalance is dependent upon your drift percentage (step 3), meaning how much deviation from target/initial position weightings you will allow. Note all rebalances will occur on the last trading day of the selected period (unless a custom date is chosen). After completing those two steps, click "Next" on the upper right-hand side to select a universe.
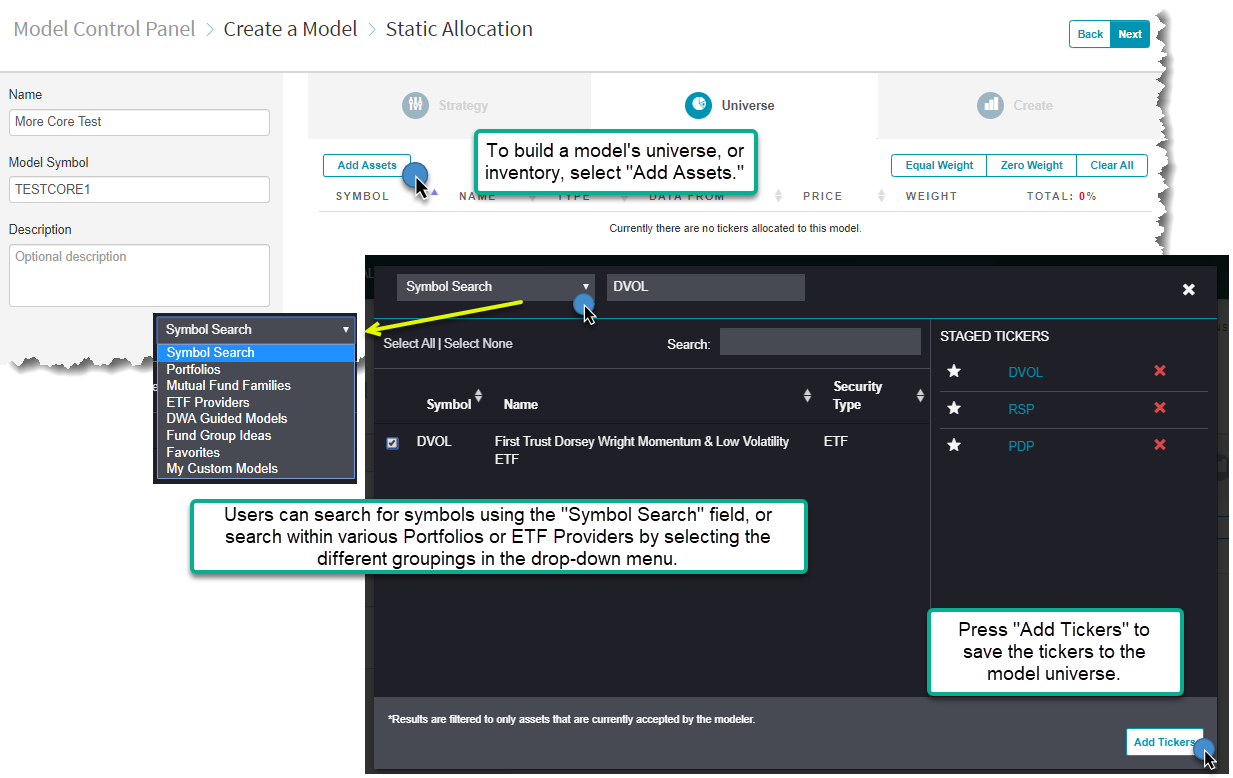
The next step in designing and building a custom model is creating the model universe. This is done by pressing the “Add Assets” button, which allows you to start adding tickers to the model universe for testing. When you select the “Add Assets” button, a window will appear, giving you the ability to search for symbols in the database, add tickers from your portfolios, or select from the various guided NDW models. To access these choices, select the drop-down menu in the top left that says, “Symbol Search.” You can also just search for tickers using the search box at the top. Once the tickers appear in the table below, you can search through large lists using the search box in the lower table. To add a security to the model universe, check the box to the left of the ticker symbol. Once selected, it will be added to the "Staged Tickers" section. When you are content with your list, press “Add Tickers.” After the tickers have been added to the model's universe, you can now adjust the weightings of the positions. Toggle the weightings in the number box by either manually typing in the weight or using the "stepper" function (clicking the arrow in the box). Once you are satisfied with your weights, press the "Next" button in the top right to navigate to the last step.

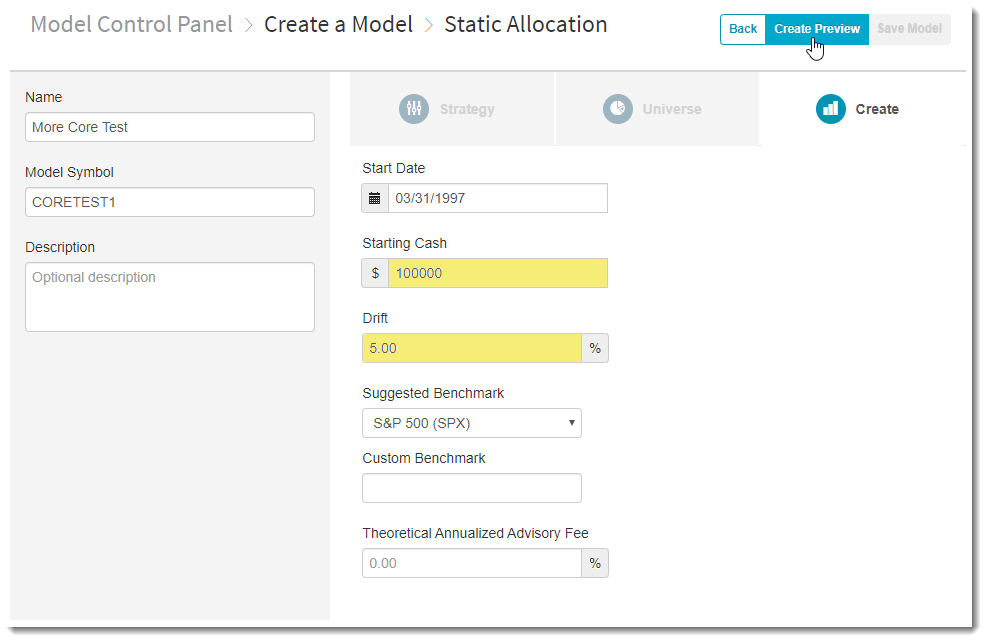
After designating your universe, you now can set the general guidelines that your static allocation model will follow. This includes establishing the allocation for each security, which we have set as equal-weighted for our three fund examples today. The system will default to take the backtested model back as far as we have price data available for the names included, however, you can adjust the start date to any date after that initial common date. This page also allows you to adjust the drift of each of the model holdings, which will give their allocation a buffer zone at each evaluation to avoid unnecessary rebalances. In our example, we have chosen a 5% drift, so if the funds are within 5% of their target allocation at the time of our designated model evaluation, they would not be rebalanced.
Create Preview - Analyze Your Model
The “Create Preview” button will then bring up the backtested results of your custom model. You will first see a growth graph of the model since the start date of the test, with a link above the graph that allows you to edit the basic test information such as time frame and the benchmark used in the comparison. This graph is also adjustable, so hovering over any point will show performance through that date and you can adjust the amount of data displayed using the scrolling bar underneath the X-axis.
Beneath the graph itself, we have additional performance and risk metrics available for your analysis. These include compounded annualized growth numbers as well as the Sharpe ratio, correlation to your benchmark, and max 6-month drawdown throughout your testing history. For those looking for more information on any of these additional metrics, please reach out to us either by email (dwa@dorseywright.com) or by phone (804-320-8511). You are also able to export the monthly returns of the model to an excel file by clicking on the “Export to CSV” button in the upper right-hand corner of the page. Clicking on the green “Save Model” button will save the test and allow you to use it throughout other aspects of the platform.

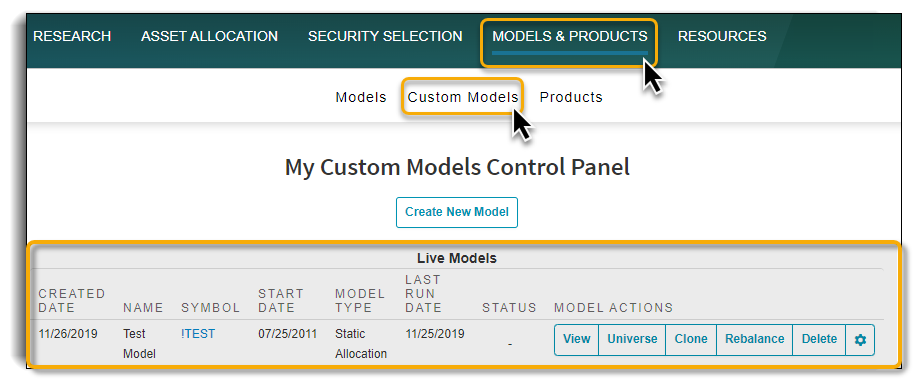
After you’ve gone through the various steps to create and save your custom model, it will take a few seconds to process and save to the NDW system. After processing, your model will be supported on the site and can be easily accessed in two different places. The first place is directly from the Custom Models Control Panel, which you can navigate to by clicking the Models & Products tab -> Custom Models. Here you will find all your live models listed along with each model’s respective creation date, custom symbol, backtest start date, model type, and last run date. Using the buttons under “Model Actions” you can do things such as rebalance, rename, clone, delete, or edit your model.
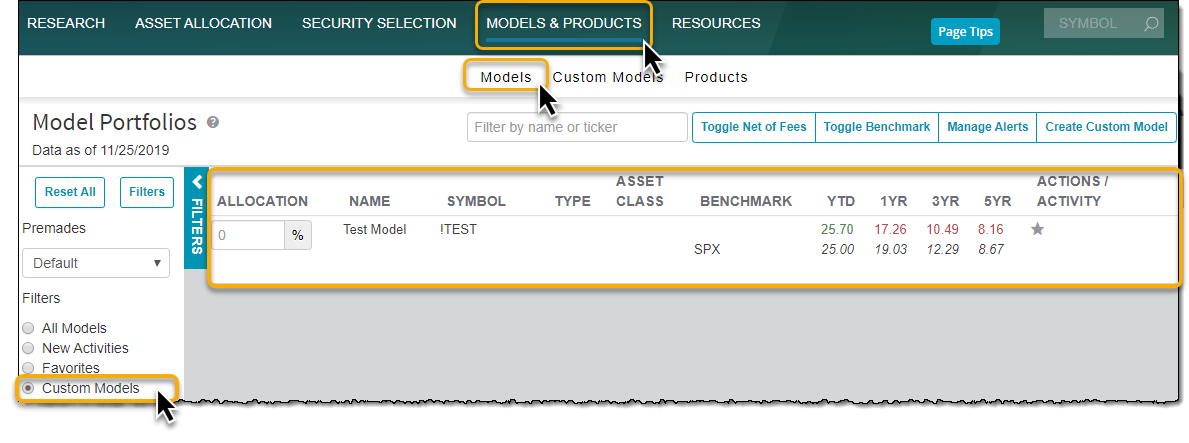
Your custom model will also be supported directly on the Models Page along with all the other pre-made NDW stock, ETF, and mutual fund models, which can be found under Models & Products > Models. To quickly find your custom models, be sure to use the “Custom Models” filter on the left-hand side of the screen. Once you have filtered out your Custom Models, the Models Page will display performance numbers for your custom models and their respective benchmarks along with the name and symbol. By clicking on the model, you can delve deeper into the model details, holdings, returns, trades, the universe, and stats.
One of the benefits of the new Custom Model tool is the ability to track the performance of your custom models, which are essentially backtested "portfolios," on the system, so you will be able to keep track of important statistics and metrics going forward. Through the Models page, you will be able to access any created custom model, providing the ability to see returns and important portfolio stats, such as sector exposure, size and style exposure, weighted average yield, and classic performance - risk metrics, such as Sharpe Ratio, beta, etc.

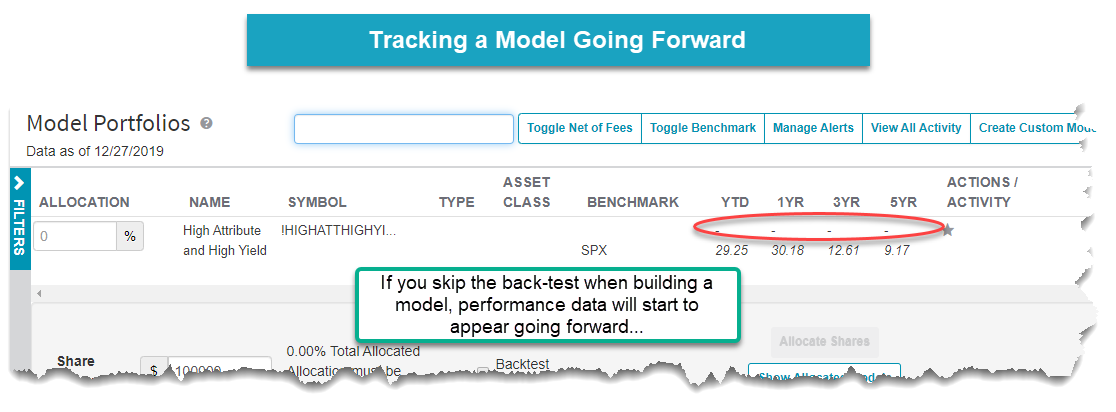
Tracking performance on an ongoing basis can be particularly helpful as you add custom model portfolios to your practice. One example of the potential benefit this could bring is using a custom high relative strength and high yield model that is derived from a filter in the NDW Security Screener. Imagine running a screen for high yielding, high RS stocks, and then wanting to track the total return of that model. Well, now you can through the custom model tool. Simply use the Security Screener to search for stocks, select "Total Return" as a filter, and then save the names to a portfolio. Once the portfolio has been saved, you will be able to select it through the custom model tool (see graphic below). This allows for backtesting to see historical performance, or you can skip the backtest, and track the returns going forward, which is what we did for this example. The premise here is that one can use the Security Screener to find ideas, then track the ideas like a model portfolio going forward.
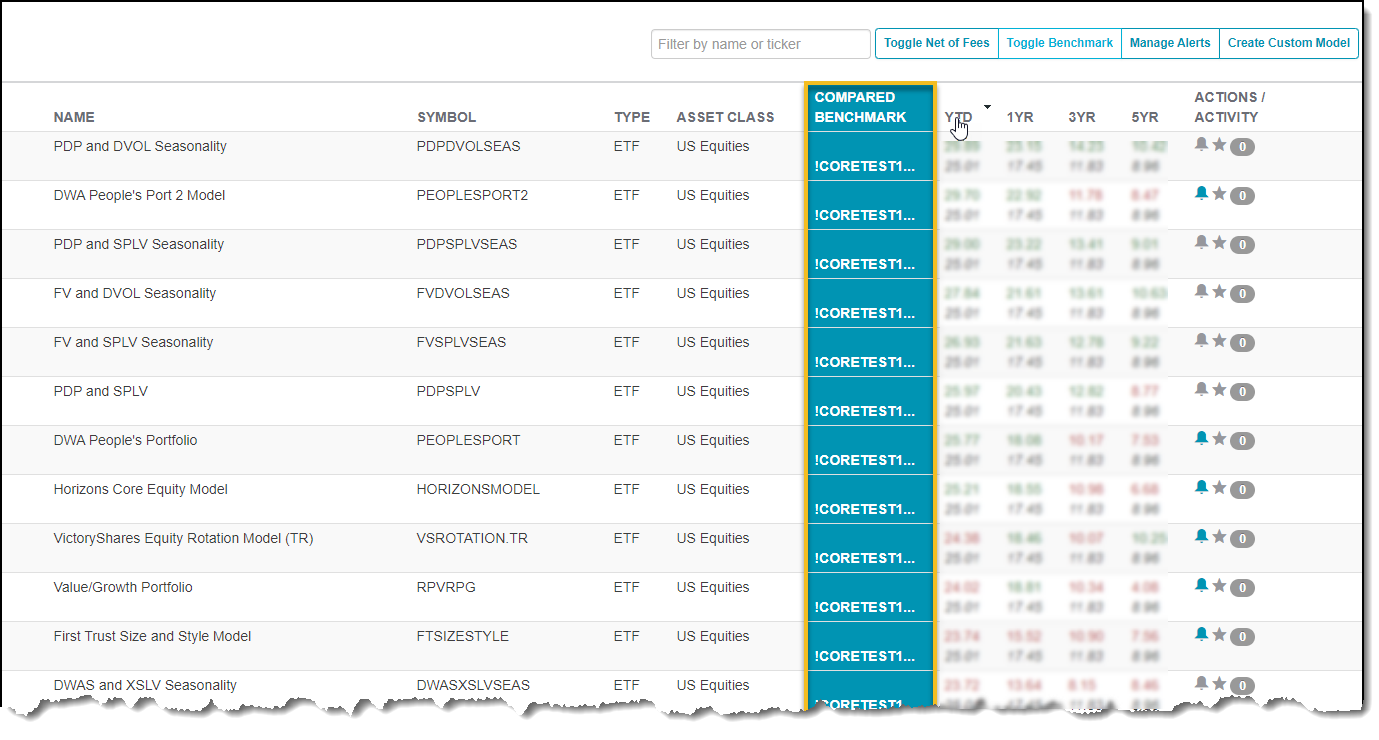
While the custom models can be extremely helpful in tracking your investment approach, they can be equally as helpful in creating your custom benchmarks for comparison against other models on the platform. Let’s say you wanted to use our equal-weighted model of PDP, DVOL, and RSP to view how this portfolio stacks up against other similar models on the site. To do this, simply navigate back to the Model Portfolios page, then click on the “Toggle Benchmark” button on the upper right-hand side of the page. You can then enter the ticker that you chose for the model as the benchmark, and then click on the “Compare” button to view how it stacks up against the other models on your display. In the example below, we have sorted the “Domestic-Broad” model filter for year-to-date returns, with those higher-performing models at the top of the list. Static allocations can also be useful for benchmarking other custom models or entire client portfolios. For example, if you have a multi-asset model that includes US equities, international equities, and fixed income, you could create a static allocation comprised of the S&P 500 SPX, EAFE Index EAFE, and the US aggregate bond index LBUSTRUU to act as its benchmark.
(The image above is for illustrative purposes only and does not represent a past or present recommendation.)
Now that we've covered static allocations, the next two entries in our series will cover creating custom matrix and FSM models.
There has been no shortage of upside participation from risk-on groups on the Asset Class Group Scores (ACGS) page over the past few weeks. There are 101 out of the 135 groups that possess an average score of at least 3.00, and 35 of those groups that possess an average score north of 4.00. The social responsibility group has been one of the more consistent groups in the “blue sky zone,” as it has maintained a score of at least 4.00 since mid-July. The group has also maintained a score above 3.00 since January of 2019, as it pulled back in March with the global equity drawdown but did not show as much deterioration as other equity areas.
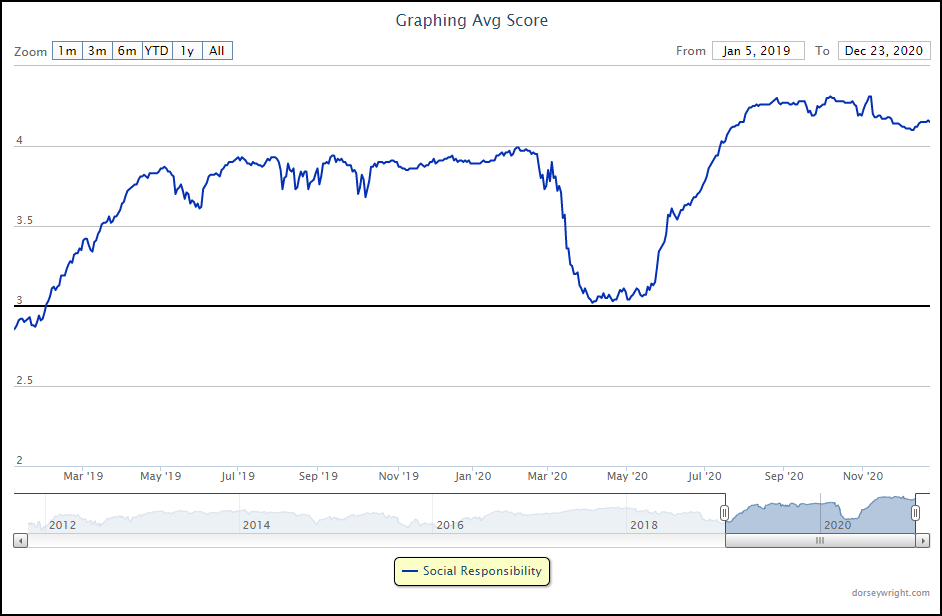
When looking underneath the hood at the group constituents, we see that the social responsibility group includes a significant amount of clean energy funds that make up most of the top end of the score rankings. There is also a significant amount of actively managed funds that utilize their own ESG screening process to discern between holdings. The ESG space has continued to grow in popularity over the past few years, leading to a growing number of funds looking to capitalize on the increased investment appetite for the space.
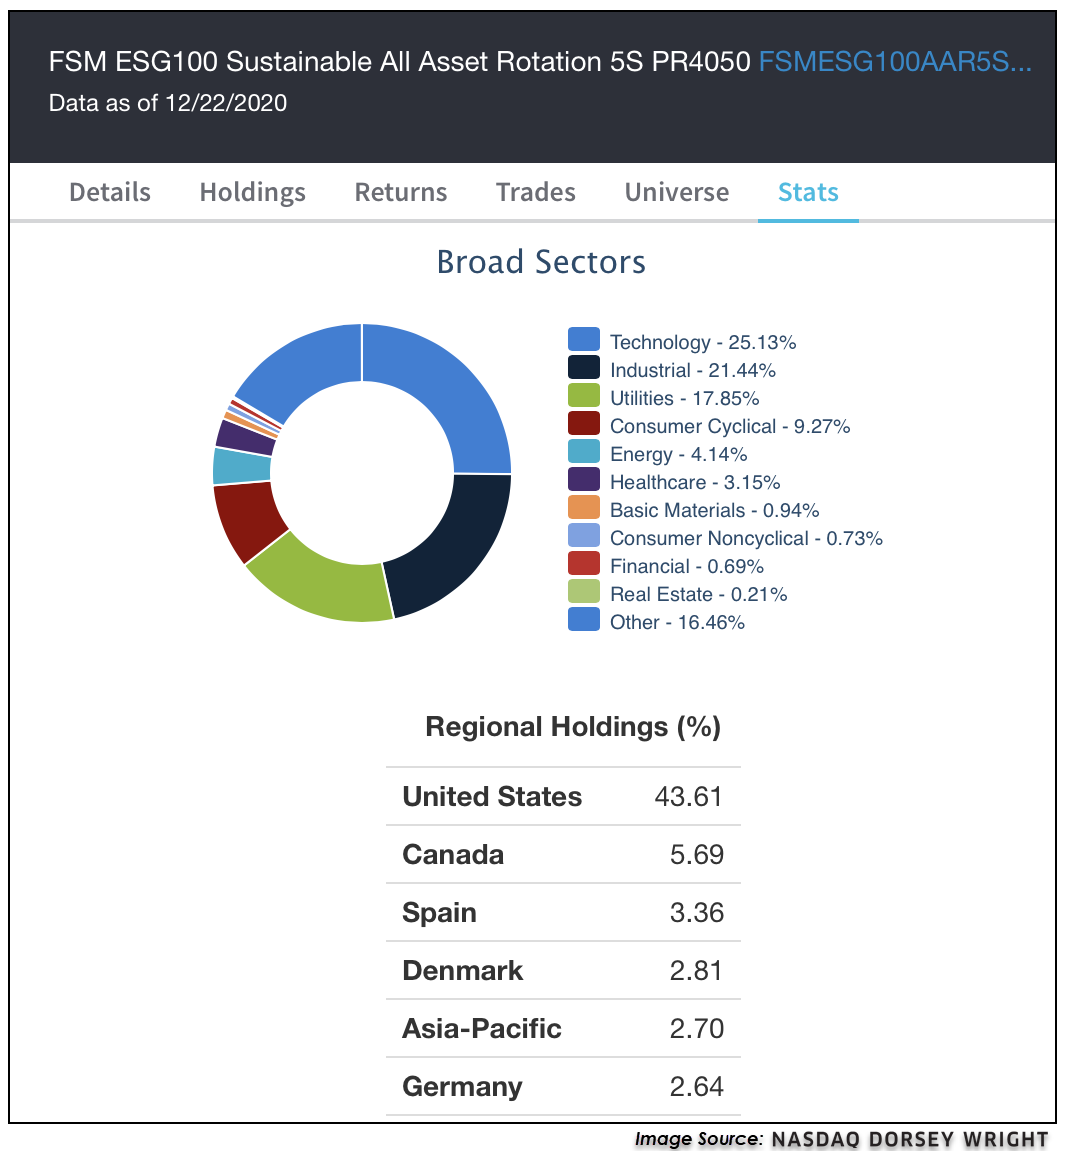
In addition to the multitude of social responsibility ideas available on the ACGS rankings, we also have the FSM ESG100 Sustainable All Asset Rotation 5S PR4050 model available for those seeking a more objective, rules-based way to play the space. This model looks at an inventory of 100 ESG ETFs and mutual funds following the typical five-holding FSM approach, which is evaluated at the beginning of each seasonal quarter. The inventory of this strategy includes both ETFs and actively managed mutual funds, providing a flexible inventory of potential holdings. The strategy also utilizes the PR4050 trigger to cash, which allows it to become defensive should the need arise. In following the five-holding FSM approach, the model will seek to hold the top five scoring funds in its inventory at the time of each model evaluation, which we last saw in early-November. While the model could potentially invest in “risk-off” areas of ESG-related fixed income, the most recent model evaluation led to full exposure towards equities, including both domestic and international representatives. This has aided the model in reaching a year-to-date return of 52.61% through Tuesday, which made it the best performing FSM model on the NDW system at that time. Those looking to utilize this approach should be mindful of the turnover associated with the strategy, as it saw at least two new positions at each of the four model evaluations in 2020, leading to an annualized turnover of 184%. In order to follow the model, you can set alerts on the Model Portfolios page.

Average Level
42.05
| AGG | iShares US Core Bond ETF |
| USO | United States Oil Fund |
| DIA | SPDR Dow Jones Industrial Average ETF |
| DVY | iShares Dow Jones Select Dividend Index ETF |
| DX/Y | NYCE U.S.Dollar Index Spot |
| EFA | iShares MSCI EAFE ETF |
| FXE | Invesco CurrencyShares Euro Trust |
| GLD | SPDR Gold Trust |
| GSG | iShares S&P GSCI Commodity-Indexed Trust |
| HYG | iShares iBoxx $ High Yield Corporate Bond ETF |
| ICF | iShares Cohen & Steers Realty ETF |
| IEF | iShares Barclays 7-10 Yr. Tres. Bond ETF |
| LQD | iShares iBoxx $ Investment Grade Corp. Bond ETF |
| IJH | iShares S&P 400 MidCap Index Fund |
| ONEQ | Fidelity Nasdaq Composite Index Track |
| QQQ | Invesco QQQ Trust |
| RSP | Invesco S&P 500 Equal Weight ETF |
| IWM | iShares Russell 2000 Index ETF |
| SHY | iShares Barclays 1-3 Year Tres. Bond ETF |
| IJR | iShares S&P 600 SmallCap Index Fund |
| SPY | SPDR S&P 500 Index ETF Trust |
| TLT | iShares Barclays 20+ Year Treasury Bond ETF |
| GCC | WisdomTree Continuous Commodity Index Fund |
| VOOG | Vanguard S&P 500 Growth ETF |
| VOOV | Vanguard S&P 500 Value ETF |
| EEM | iShares MSCI Emerging Markets ETF |
| XLG | Invesco S&P 500 Top 50 ETF |
| Symbol | Company | Sector | Current Price | Action Price | Target | Stop | Notes |
|---|---|---|---|---|---|---|---|
| APAM | Artisan Partners Asset Management, Inc | Finance | $49.68 | mid-to-upper 40s | 53.50 | 39 | 5 for 5'er, top 20% of FINA sector matrix, multiple buy signals, pos wkly mom flip, 6% yield |
| LASR | nLIGHT, Inc. | Semiconductors | $33.92 | low-to-mid 30s | 55 | 27 | 5 for 5'er, top 10% of SEMI sector matrix, consec buy signals, pullback from multi-year high |
| JCI | Johnson Controls International PLC | Protection Safety Equipment | $45.92 | mid 30s | 58 | 39 | 4 for 5'er, top half of PROT sector matrix, multiple buy signals 2.3% yield, R-R>2.0 |
| DE | Deere & Company | Machinery and Tools | $267.94 | 250s to low 270s | 348 | 208 | 5 for 5'er, ATH, pos trend, top 25% of DWAMACH, triple top breakout |
| PWR | Quanta Services, Inc. | Electronics | $70.81 | hi 60s - low 70s | 86 | 58 | 5 for 5'er, top 20% of favored ELEC sector matrix, triple top breakout, pullback from ATH |
| PLAN | Anaplan, Inc. | Internet | $73.23 | upper 60s to mid 70s | 84 | 58 | 4 for 5'er, pullback from ATH, consec buy signals, top 25% DWAINET, pos weekly and mon mom |
| TGT | Target Corporation | Retailing | $174.91 | 160s - 170s | 186 | 140 | 4 for 5'er, favored RETA sector, multiple buy signals, pullback from ATH, 1.6% yield |
| ITW | Illinois Tool Works Inc. | Machinery and Tools | $201.98 | high 190s to high 220s | 266 | 160 | 4 for 5'er, fav DWAMACH, LT market RS buy, consec buy signals, pullback from ATH |
| HOG | Harley-Davidson, Inc. | Leisure | $37.55 | hi 30s - low 40s | 66 | 32 | 4 for 5'er, top 50% of favored LEIS sector matrix, pullback from 52-week high, R-R>4.0, pot. cov. write |
| TXRH | Texas Roadhouse, Inc. | Restaurants | $79.88 | high 70s to high 80s | 115 | 67 | 4 for 5'er, pullback from ATH, consec buy signals, LT market RS buy signal |
| Symbol | Company | Sector | Current Price | Action Price | Target | Stop | Notes |
|---|
| Symbol | Company | Sector | Current Price | Action Price | Target | Stop | Notes |
|---|---|---|---|---|---|---|---|
| BECN | Beacon Roofing Supply, Inc. | Building | $40.13 | 36 - 40 | 56 | 30 | See follow comment below. |
| Comment |
|---|
| BECN Beacon Roofing Supply, Inc. R ($39.99) - Building - Okay to add new exposure here. We will abide by our $30 stop. |
| BABA Alibaba Group Holding Ltd (China) ADR R ($219.92) - Internet - BABA hit our stop. We will exit our position. |
| AMRC Ameresco Inc. R ($50.28) - Machinery and Tools - Raise stop to $40, the first sell signal on the chart. |
TXRH Texas Roadhouse, Inc. R ($80.19) - Restaurants - TXRH is a healthy 4 for 5’er within the favored restaurants sector that has maintained a long-term peer RS buy signal since January 2018. Since moving to a buy signal in November, TXRH has given four consecutive buy signals, confirming that demand is in control. With the most recent action, TXRH reversed up into Xs to $81 where it trades today. From here, TXRH faces resistance at $83 and $84, the stock’s all-time high printed in November. We will set our initial stop at $67 and will use the bullish price objective of $115 as our near-term price target. New positions are welcome in the high 70s to high 80s.
| 84.00 | X | 84.00 | |||||||||||||||||||||||||||||||||||||||||||||||||||
| 83.00 | X | O | X | 83.00 | |||||||||||||||||||||||||||||||||||||||||||||||||
| 82.00 | X | O | X | O | 82.00 | ||||||||||||||||||||||||||||||||||||||||||||||||
| 81.00 | X | O | X | O | X | 81.00 | |||||||||||||||||||||||||||||||||||||||||||||||
| 80.00 | X | O | X | X | O | X | 80.00 | ||||||||||||||||||||||||||||||||||||||||||||||
| 79.00 | X | O | X | O | X | O | X | 79.00 | |||||||||||||||||||||||||||||||||||||||||||||
| 78.00 | X | O | X | X | O | X | O | 78.00 | |||||||||||||||||||||||||||||||||||||||||||||
| 77.00 | X | O | X | X | O | C | O | 77.00 | |||||||||||||||||||||||||||||||||||||||||||||
| 76.00 | X | X | O | X | O | X | O | X | • | 76.00 | |||||||||||||||||||||||||||||||||||||||||||
| 75.00 | X | O | X | O | X | O | X | O | X | • | Mid | 75.00 | |||||||||||||||||||||||||||||||||||||||||
| 74.00 | X | O | X | O | X | O | X | O | • | 74.00 | |||||||||||||||||||||||||||||||||||||||||||
| 73.00 | X | X | O | X | O | X | O | X | • | 73.00 | |||||||||||||||||||||||||||||||||||||||||||
| 72.00 | X | O | X | O | X | B | O | O | • | 72.00 | |||||||||||||||||||||||||||||||||||||||||||
| 71.00 | X | O | X | O | X | O | X | • | 71.00 | ||||||||||||||||||||||||||||||||||||||||||||
| 70.00 | X | O | O | X | O | X | • | 70.00 | |||||||||||||||||||||||||||||||||||||||||||||
| 69.00 | X | O | X | O | • | 69.00 | |||||||||||||||||||||||||||||||||||||||||||||||
| 68.00 | X | O | • | 68.00 | |||||||||||||||||||||||||||||||||||||||||||||||||
| 67.00 | X | • | 67.00 | ||||||||||||||||||||||||||||||||||||||||||||||||||
| 66.00 | X | X | X | X | • | 66.00 | |||||||||||||||||||||||||||||||||||||||||||||||
| 65.00 | X | X | O | X | O | X | O | X | • | 65.00 | |||||||||||||||||||||||||||||||||||||||||||
| 64.00 | X | O | X | O | X | O | X | O | X | • | 64.00 | ||||||||||||||||||||||||||||||||||||||||||
| 63.00 | • | X | X | O | X | O | O | X | O | X | A | • | 63.00 | ||||||||||||||||||||||||||||||||||||||||
| 62.00 | X | • | X | O | X | 9 | O | O | X | O | X | • | 62.00 | ||||||||||||||||||||||||||||||||||||||||
| 61.00 | • | X | O | • | X | O | X | O | X | O | X | • | Bot | 61.00 | |||||||||||||||||||||||||||||||||||||||
| 60.00 | • | X | O | • | X | O | O | O | • | 60.00 | |||||||||||||||||||||||||||||||||||||||||||
| 59.00 | • | X | O | • | X | • | • | 59.00 | |||||||||||||||||||||||||||||||||||||||||||||
| 58.00 | • | X | O | • | X | • | 58.00 | ||||||||||||||||||||||||||||||||||||||||||||||
| 57.00 | • | X | O | X | • | 8 | • | 57.00 | |||||||||||||||||||||||||||||||||||||||||||||
| 56.00 | • | X | X | O | X | O | • | X | • | 56.00 | |||||||||||||||||||||||||||||||||||||||||||
| 55.00 | • | X | O | X | O | X | O | • | X | • | 55.00 | ||||||||||||||||||||||||||||||||||||||||||
| 54.00 | • | X | O | 6 | O | X | O | X | X | • | X | • | 54.00 | ||||||||||||||||||||||||||||||||||||||||
| 53.00 | X | • | X | O | X | O | X | O | X | O | X | X | O | X | • | 53.00 | |||||||||||||||||||||||||||||||||||||
| 52.00 | X | O | • | X | O | X | O | X | O | X | O | X | O | X | O | X | • | 52.00 | |||||||||||||||||||||||||||||||||||
| 51.00 | X | O | X | O | O | X | O | X | O | X | O | X | O | • | 51.00 | ||||||||||||||||||||||||||||||||||||||
| 50.00 | X | O | X | O | O | O | X | 7 | X | • | 50.00 | ||||||||||||||||||||||||||||||||||||||||||
| 49.00 | X | X | O | X | X | X | O | • | O | X | • | 49.00 | |||||||||||||||||||||||||||||||||||||||||
| 48.00 | X | O | X | O | X | O | X | O | X | • | • | O | X | • | 48.00 | ||||||||||||||||||||||||||||||||||||||
| 47.00 | X | O | X | X | O | X | O | X | O | X | • | O | • | 47.00 | |||||||||||||||||||||||||||||||||||||||
| 46.00 | X | O | X | O | X | 5 | X | O | X | O | X | • | • | 46.00 | |||||||||||||||||||||||||||||||||||||||
| 45.00 | X | O | X | O | X | O | X | O | X | O | X | • | 45.00 | ||||||||||||||||||||||||||||||||||||||||
| 44.00 | X | O | X | O | X | O | X | O | O | X | • | 44.00 | |||||||||||||||||||||||||||||||||||||||||
| 43.00 | X | O | X | O | O | O | X | • | 43.00 | ||||||||||||||||||||||||||||||||||||||||||||
| 42.00 | O | X | O | • | 42.00 | ||||||||||||||||||||||||||||||||||||||||||||||||
| 41.00 | O | X | • | 41.00 | |||||||||||||||||||||||||||||||||||||||||||||||||
| 40.00 | O | • | 40.00 |

| BLNK Blink Charging Co ($51.43) - Autos and Parts - BLNK is a perfect 5 for 5’er that ranks #1 in the favored autos and parts sector RS matrix. With today’s action, BLNK broke a double top at $49 before moving higher to $53, marking a new 52 week high on the chart. From here, support sits at $43. |
| HIBB Hibbett Sports, Inc. ($50.00) - Retailing - HIBB broke a double top at $50, marking the second consecutive buy signal on the chart. HIBB is a 4 for 5’er within the favored retailing sector that has experienced four weeks of positive weekly momentum. From here, support sits at $42. |
| LNT Alliant Energy Corporation ($49.51) - Utilities/Electricity - LNT returned to a sell signal with a double bottom break at $48. LNT is a 3 for 5’er within the utilities/electricity sector. From here, additional support sits at $47. |
| OSIS Osi Systems ($93.03) - Protection Safety Equipment - Shares of OSIS moved higher Thursday to break a triple top at $94, marking a fourth consecutive buy signal. This 3 for 5'er moved to a positive trend in August and has been on an RS buy signal against the market since mid-2019. The overall weight of the evidence is positive here, however, potential long investors should note that OSIS has entered overbought territory. Initial support can be found at $90 with further support found at $85, which is also the current location of the bullish support line. |
| Name | Option Symbol | Action | Stop Loss |
|---|---|---|---|
| Archer-Daniels-Midland Company - $49.44 | O: 21C48.00D19 | Buy the March 48.00 calls at 3.20 | 45.00 |
| Name | Option | Action |
|---|---|---|
| NIKE, Inc. ( NKE) | Apr. 130.00 Calls | Stopped at 16.35 (CP: 16.15) |
| Name | Option Symbol | Action | Stop Loss |
|---|---|---|---|
| Duke Energy Corporation - $89.61 | O: 21P90.00D16 | Buy the April 90.00 puts at 5.30 | 95.00 |
| Name | Option | Action |
|---|---|---|
|
|
||
| Name | Option Sym. | Call to Sell | Call Price | Investment for 500 Shares | Annual Called Rtn. | Annual Static Rtn. | Downside Protection |
|---|---|---|---|---|---|---|---|
| Cloudflare Inc Class A $81.90 | O: 21B90.00D19 | Feb. 90.00 | 7.30 | $39,104.45 | 89.62% | 52.25% | 7.54% |
| Name | Action |
|---|---|
| Marathon Petroleum Corp. (MPC) - 41.31 | Sell the April 45.00 Calls. |
| Phillips-Van Heusen Corporation (PVH) - 94.58 | Sell the March 90.00 Calls. |
| Comerica Incorporated (CMA) - 56.06 | Sell the April 57.50 Calls. |
| American International Group, Inc. (AIG) - 37.44 | Sell the May 40.00 Calls. |
| L Brands Inc. (LB) - 39.19 | Sell the May 40.00 Calls. |
| Synovus Financial Corp. (SNV) - 32.69 | Sell the February 32.00 Calls. |
| Citizens Financial Group Inc (CFG) - 35.36 | Sell the February 35.00 Calls. |
| Snap Inc (SNAP) - 51.74 | Sell the February 55.00 Calls. |
| Ballard Power Systems, Inc. (BLDP) - 23.48 | Sell the February 24.00 Calls. |
| Name | Covered Write |
|---|---|
|
|
|
Daily Equity & Market Analysis
Loading, Please Wait...
