
Most Requested Symbols

Each year, we produce 12 articles throughout the last few weeks of the year, all revolving around one central concept. This year, all 12 articles will revolve around the topic of "Enhancing Your Process With Scalable Customization in 2021. Today, we will cover FSM Models.
Tesla is added to the S&P 500 Index as of Monday, but will its volatility come along for the ride?
The average distribution reading is 43.19% overbought.
Today's featured stock is Target (TGT).
PVH, RCL, ROKU, COLM, NWN, PLCE, FLGT, PSNL, BHVN, IDXX, HES, & URI
Call: Infosys (INFY); Put: Cisco Systems (CSCO); Covered Write: Citizens Financial Group (CFG).
We are excited to announce phase three of the Nasdaq Dorsey Wright Model Builder with the launch of Matrix and FSM-based Relative Strength (RS) Testing Service. As part of this launch, we are granting you free access to the service for the remainder of 2020. The tool is designed to help you more easily design, test, implement, and monitor custom models powered by the Nasdaq Dorsey Wright methodology. Please see below for replays of our latest webinar series covering the different aspects of the tool.
11/19/2020: Static Model Builder Demo Replay - Click Here
12/9/2020: Matrix Model Builder Demo Replay - Click here
11/5/2020: FSM Model Builder Demo Replay - Click here
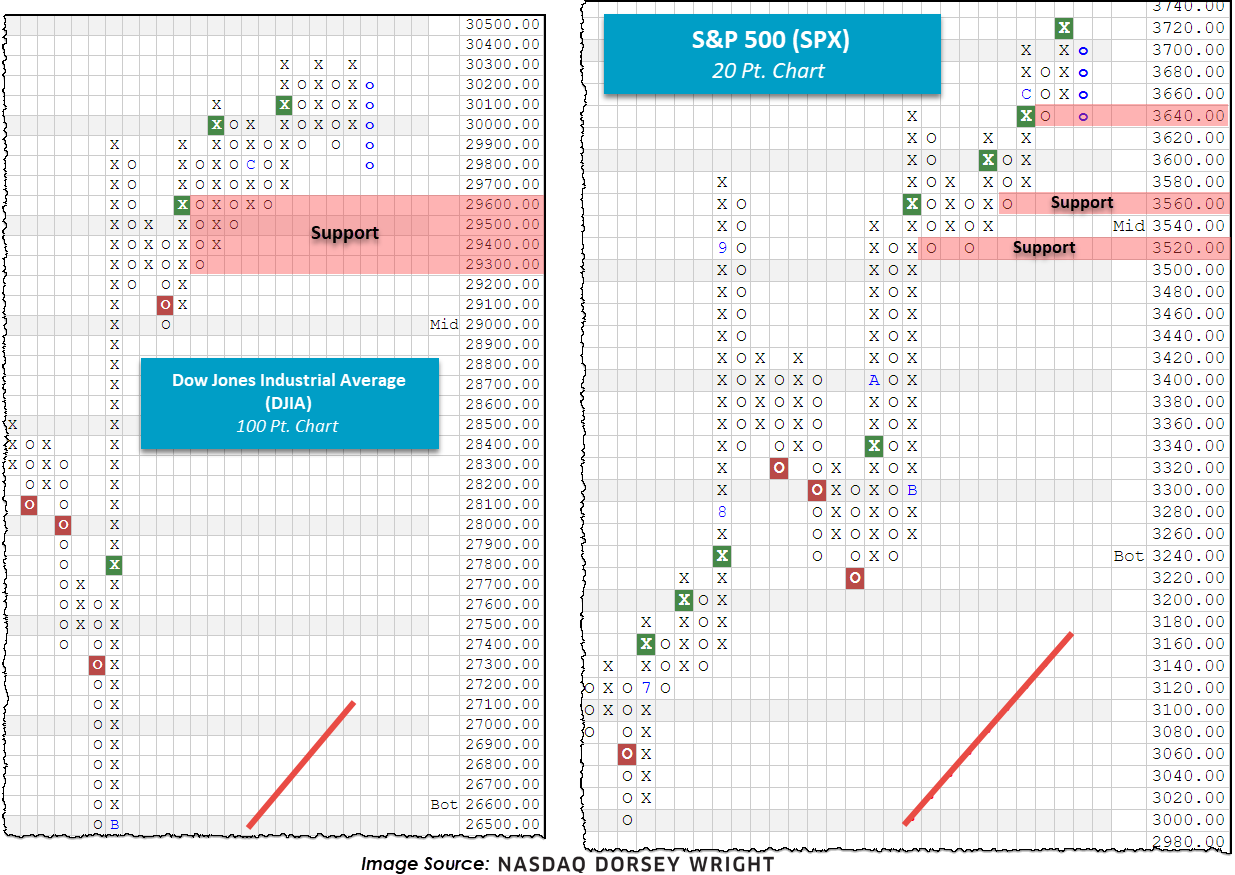
Equity market futures were under pressure Monday (12/21) morning despite the highly anticipated announcement of a new stimulus bill from the United States government. Like the first package, the new action will include individual checks and weekly payments to those who qualify, in addition to funding for vaccine distribution (wsj.com). However, competing for headline attention, and arguably in focus much of the time, was an alternative strain of the coronavirus which appeared overseas. The news stoked investor fears as many risk-on assets traded lower during the morning hours; the Dow Jones Industrial Average (DJIA) was down as much as 400 points Monday morning before closing 37 points higher for the day. The Financials Sector was the best performing, followed by a late surge from the technology group. Given the notable intraday price swings of many indices and stocks, we decided to provide an update on a few major market charts and offer some key reminders about the rules of Point and Figure.
Beginning with the Dow, we note a blue column of Os which signals an intraday pullback to below the 29,800 level. The move did break support at 29,900 so we will now look toward the subsequent stair-stepped levels of support beginning around 29,600, a prior period of notable consolidation. Similarly, on the S&P 500 (SPX) 20-point chart we note a pullback from all-time high territory to 3640, resting the chart at initial support. Beyond current levels, we find support offered around 3560 and 3520. Looking across other risk-on areas we generally find similar movement, deep intraday pullbacks represented by a column of Os, despite a higher close for the day. This serves as a good reminder for a key rule of Point and Figure charting – one direction per day. Additionally, remember that Point & Figure uses the intraday highs and lows to plot price action, not closing values. Meaning, if a chart started the day in a column of Os and printed an intraday value beyond the current level (like many did this morning), the stock will post additional Os regardless if the stock were to rally later in the day. In the case of a rally, the change will likely reflect in the next trading day as a new series of highs and lows will be evaluated.
The majority of technical indicators across the NDW Research Platform remain unchanged despite the large movements today, and longer-dated positionings remain positive.

Over the last decade, the advisory business has continued to evolve rapidly with the growing trends of lower fees and increased automation. With the influx of low-cost index funds and Robo-advisors offering nearly-free financial planning, investors can now gain beta market exposure at rock-bottom prices without ever setting foot in an advisor's office. The upshot is that it is now more challenging than ever for you as a traditional financial advisor to justify your fee and grow your client base. That said, you must scale your process and sharpen your value proposition as much as possible. To help you do just that, this year's 12 Days of Christmas Series, "Enhancing Your Process With Scalable Customization in 2021," will navigate you through the benefits, use/implementation, and customization of rules-based, Relative Strength-driven guided model portfolios. Additionally, this series will highlight the NDW Model Builder Tool's new features, providing relevant use-cases to help you scale your business in the coming year.
Day 1 - Benefits of Models and a Rules-Based Process
Day 2 - The Relative Strength Process
Day 3 - Model Foundations - The Relative Strength Matrix
Day 4 - Model Foundations – Technical Attributes and the Fund Score Method (FSM)
Day 5 - Model Foundations - Matrix Models
On day 6 of our 12 Days of Christmas series, we will continue to focus on model foundations by covering the Fund Score Method (FSM) model strategies that are available on the NDW platform. These strategies utilize the NDW Fund Scoring System to help select the holdings within the portfolios. Recall that Fund Scores can range from 0 (weak) to 6 (strong) and that a fund can get a maximum of two points from the three main areas of evaluation: trending analysis, market relative strength, and peer relative strength. By using Fund Scores, the models have the capability to rotate within a certain lineup of mutual funds or ETFs. Much like the Relative Strength Matrix-based models that select the strongest ETFs and hold onto those positions so long as they maintain sufficient relative strength, the FSM models do the same but with Fund Scores. Depending on the update frequency (monthly or by Seasonal quarter), the FSM models will allocate to the top two or five highest-scoring funds during each review. Today, we will cover the general FSM model structure and highlight the different offerings that utilize the framework.
The FSM models can be found under the Model Portfolios page by selecting the FSM box under the filters tab. While the names may seem like a mouthful at first glance, they are meant to provide you with as much information as to the structure of that particular model as efficiently as possible. Each FSM model name will first start with the FSM abbreviation, simply letting you know that this model is evaluated according to fund score rankings rather than strictly relative strength. Next, you will have the name of the “basket” of funds that are being ranked. This ranges from a specific mutual fund family, such as American Funds, to a designation that we have created to fill a specific allocation sleeve, such as our CoreSolution lineup (we will get to the different inventories later in the article). Following the inventory classification, you will have either a 2 or 5, immediately followed by an “S” or “M”. The number tells you how many of the top-scoring funds are chosen as model holdings at each evaluation, and the letter designates when that evaluation takes place, either at the end of each month (M) or at the beginning of each seasonal quarter (S), which is the beginning of February, May, August, and November. If there is a further acronym in the model name, this corresponds to a potential cash trigger that could take place in the model. Below you can see an example breakdown of a model name.

One aspect of the FSM models that has made them increasingly popular is their ability to get defensive through the potential cash triggers. Each of the models has the potential for cash to come into the portfolio, as you will notice by viewing the full model inventory that the DWA Money Market Proxy MNYMKT is included in the lineup of each model. If MNYMKT were to rise in fund score to be one of the top-scoring inventory members at the time of the model evaluation, then it would take the model allocation that corresponds to its rank, unless it is the top-ranked score, at which point the model would move to 100% cash. While each model is capable of having these changes come into effect, it is extremely rare that we see MNYMKT possess a higher fund score than the rest of a model’s inventory.
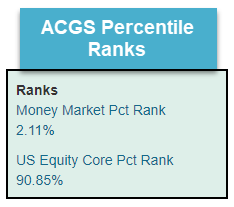
As mentioned above, many of the FSM models have an acronym at the end of the model name that corresponds to a separate cash trigger. Those models with MMPR50 or MMPR70 have a separate evaluation that will move the model to cash if the Money Market Percentile Rank, found in the upper left-hand corner of the Asset Class Group Scores (ACGS) page, is above either 50% (MMPR50) or 70% (MMPR70). This reading corresponds to the ranking of the US Money Market group relative to the other 135+ groups that we track on the ACGS system.
The other cash triggers, PR4050 and PR4080, utilize both the Money Market Percentile Rank as well as the US Core Equity Percentile Rank, which measures where the S&P 500 Index Funds group ranks relative to the rest of your investable universe in the ACGS. For these to trigger, the Core Equity Percent rank must fall below 40%, and the MMPR must rise above its designated threshold, either 50% (PR4050) or 80% (PR4080). Both of these factors must occur for these models to move to cash. It is important to keep in mind that the MMPR and PR cash triggers will be evaluated at the end of each month, regardless of whether the fund scores are evaluated monthly or on seasonal quarters.
The flexibility of the FSM structure allows for a variety of different kinds of model offerings. These models can vary in their investment approach by nature of what funds are included in the model inventories. If you are looking to utilize a strictly domestic equity major market ETF strategy, the FSM CoreSolution US Core 2S model would likely fill that sleeve. If you are looking for income, the FSM PIMCO All Asset Income 2S model may be ideal. There are also models that could be allocated toward equity names, fixed-income funds, or a combination of both, that we affectionately call “Go Anywhere” models. Additionally, the FSM framework is also ideal for application toward a 401k lineup or in the variable annuity space, with premade models from both areas available on the NDW platform. We have highlighted some of our most popular models below.
Go Anywhere – T Rowe Price
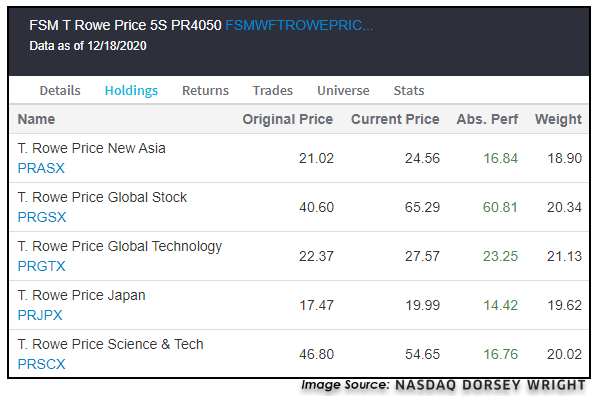
As previously mentioned, many of the FSM inventories include funds in various asset classes, ranging from domestic equities to international equities and fixed income. If we take a look at the lineup for the T Rowe Price 5S models, we see that there are 50 funds that are ranked upon each evaluation point. Even though the current allocation focuses on domestic equity growth funds, there is the potential for specific sectors, countries, and fixed income areas to rotate into the model if they possessed one of the top fund scores. Therefore, the FSM models do not necessarily fit perfectly into more traditional strategies that require fixed allocations to certain asset classes like fixed income or equities. That said, the strategies tend to have more of a bias towards equities, so we believe they can fit in the equity or "risk-on" portion of traditional portfolio allocations. The current holdings of the FSM T Rowe Price 5S PR4050 model take a risk-on approach toward global equities, with exposure toward domestic and international funds after the most recent evaluation. This model is up over 35% in 2020 through 12/18, outpacing the DWA8020 benchmark, which possesses 80% equity exposure and 20% fixed income exposure and is up just over 13% over the same timeframe.
CoreSolution – All Cap World
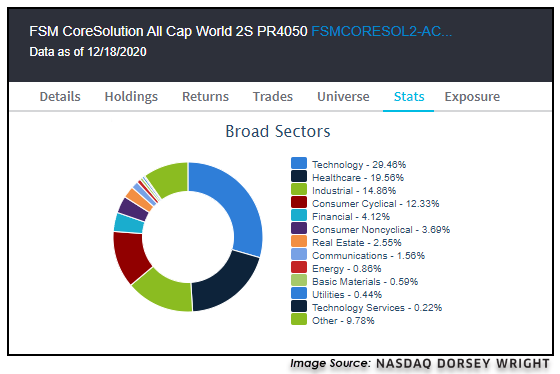
The FSM CoreSolution All Cap World 2S PR4050 model uses the FSM framework on a lineup of equity-only ETFs, including potential exposure toward domestic and international equity funds. As the name of the model suggests, this strategy seeks to hold the top two scoring funds at each evaluation point. The most recent evaluation saw the strategy gain exposure toward small-cap growth in addition to its mid-cap growth exposure. Looking at the model from a sector exposure standpoint of the underlying holdings of each ETF, we can see it is overweight technology at just under 30% of the portfolio, with elevated exposure toward healthcare, industrials, and consumer cyclicals. The model is up 49.17% so far this year, outpacing the return of its benchmark ACWI at a gain of 13.29% (through 12/18.)
401k – Nasdaq Lineup
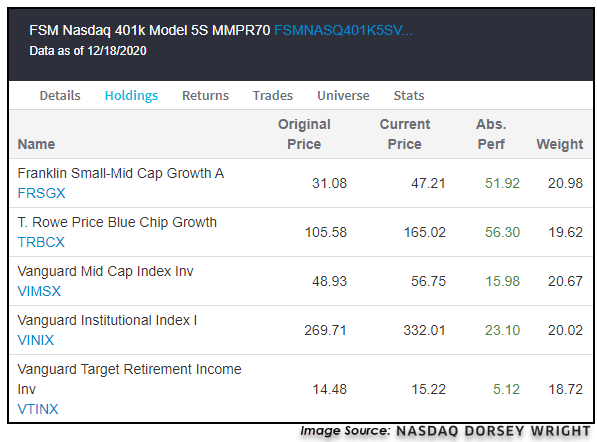
The FSM framework is also ideal for application toward 401k lineups, as it provides an objective, rule-based way to rotate among names in a 401k lineup that can easily demonstrate value to clients. With the new Custom FSM Modeler tool, you now have the ability to apply this framework to any 401k lineup, which we will cover more in-depth in a future article. One example that we have available on the platform is the FSM Nasdaq 401k 5S model, which applies the FSM framework to the 401k lineup available to us at Nasdaq Dorsey Wright. This model possesses an equity overweight but also has exposure toward fixed income. It is up 21.53% on the year, besting the DWA8020 return of 13.84%.
Today marked the first trading day with Tesla TSLA being included in the S&P 500 Index SPX, as it replaced Apartment Investment & Management Co. AIV. At a market capitalization of over $624 billion, TSLA is the largest company to ever join the S&P 500. The stock has also seen extreme improvement in 2020, posting a year-to-date gain of over 730% through Friday, 12/18. While the stock has seen major growth, this name is also known for its heightened levels of volatility, causing many investors to be concerned that it could carry this volatility into the broad domestic benchmark after its inclusion. Tesla has seen a trailing 12-month weekly standard deviation reading of 87.77% through trading last Thursday, significantly higher than the 31.43% calculation of SPX over the same timeframe.
In order to test how the S&P 500 Index was affected by the inclusion of volatile names, we took the 12-month trailing weekly standard deviation of each addition to the index since March 1990 at the time the stock was added and compared these reading with the same calculations 12 months after each stock was added. Out of the 640 names examined, TSLA would rank 21st in its pre-inclusion standard deviation based on market data through last Thursday, 12/17. However, if we normalize the volatility of each inclusion based on the trailing 12-month standard deviation of SPX at the time of each stock’s addition, TSLA falls to a ranking of 195th, proving to be only slightly more volatile than average in stocks that have been added since 1990. This may seem somewhat surprising given the recent price movement of Tesla, we must keep in mind that the S&P 500 Index has not been a stranger to volatility itself over the past year. While we cannot know for sure what TSLA will look like from a standard deviation standpoint 12 months from now, we can use the rest of the names that have been added to the broad index over the past 30+ years to get an idea of how their volatility was affected after being added to the index.
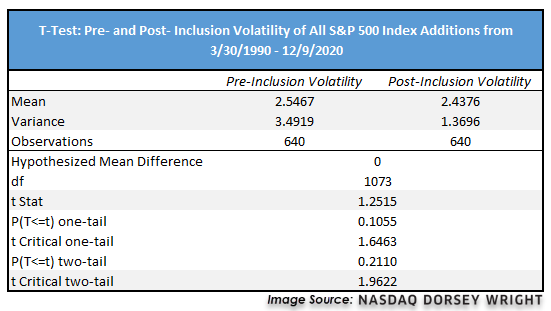
To test this, we took all the additions to the S&P 500 since March 1990 and ran a t-test on the normalized pre-inclusion volatility of each addition compared to the normalized post-inclusion volatility. As a refresher, a t-test is used in statistics to discern if there is a significant difference between the means of two groups of data (source: Investopedia.com). In our test, we are using the t-test to look at the mean of the pre-inclusion volatility compared with the post inclusion volatility, how the variance in these two sets of data changes, and whether or not the result is statistically significant as indicated by the t-stat being greater than the t-critical point.
Based on the results of this first test, we can see that the average of the post-inclusion volatility is slightly lower than the pre-inclusion average. Perhaps more notable, we can also see that the variance in the post-inclusion volatility declines substantially, indicating that the volatility of the stocks has a tighter buffer around the volatility of SPX after they are included in the index. However, our t-stat ultimately did not prove that there was a statistically significant difference between the two volatility averages. This means that while we saw noteworthy observations in the averages and variances of the pre-and post-inclusion volatility, we could not reach the 95% confidence threshold that the difference in averages was significant when examining all 640 additions.
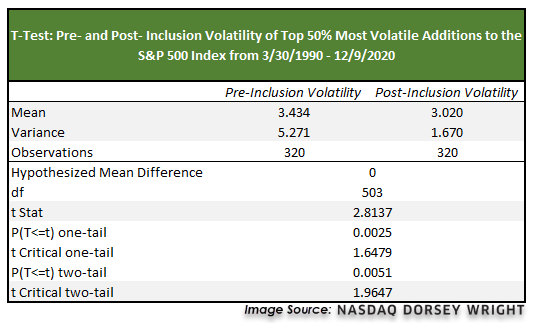
These results changed when we just examined the highly volatile additions to the S&P 500 Index, as identified by the stocks sitting in the top half of our pre-inclusion volatility ranking, or the top 320 names. Even though normalizing the trailing standard deviation of TSLA caused it to fall out of the top 10% of our volatility ranking, its position at 195th certainly leaves it in the top 50% of names. The results of our second t-test showed a further decline in the mean of post-inclusion volatility, and an even more significant decline in the variance of the two data sets. Furthermore, out t-stat reading did prove that we can be confident in the difference in mean between the two datasets. This tells us that names with heightened volatility at the time of their inclusion do typically show decreased volatility one year after being added to the S&P 500 Index.
As we previously mentioned, we cannot be certain what the volatility of Tesla will look like 12 months down the road. However, we do know that TSLA is the largest stock by market cap to ever be added to the S&P 500 Index. This likely heightened its publicity around volatility as it sits in about the 30th percentile of ranking S&P 500 additions from a pre-inclusion volatility perspective, after normalizing for SPX volatility. In looking at the top half of that pre-inclusion volatility ranking, we can also see that these more volatile names tend to trade more in line with the volatility of SPX one year after being added to the index.

Average Level
43.19
| AGG | iShares US Core Bond ETF |
| USO | United States Oil Fund |
| DIA | SPDR Dow Jones Industrial Average ETF |
| DVY | iShares Dow Jones Select Dividend Index ETF |
| DX/Y | NYCE U.S.Dollar Index Spot |
| EFA | iShares MSCI EAFE ETF |
| FXE | Invesco CurrencyShares Euro Trust |
| GLD | SPDR Gold Trust |
| GSG | iShares S&P GSCI Commodity-Indexed Trust |
| HYG | iShares iBoxx $ High Yield Corporate Bond ETF |
| ICF | iShares Cohen & Steers Realty ETF |
| IEF | iShares Barclays 7-10 Yr. Tres. Bond ETF |
| LQD | iShares iBoxx $ Investment Grade Corp. Bond ETF |
| IJH | iShares S&P 400 MidCap Index Fund |
| ONEQ | Fidelity Nasdaq Composite Index Track |
| QQQ | Invesco QQQ Trust |
| RSP | Invesco S&P 500 Equal Weight ETF |
| IWM | iShares Russell 2000 Index ETF |
| SHY | iShares Barclays 1-3 Year Tres. Bond ETF |
| IJR | iShares S&P 600 SmallCap Index Fund |
| SPY | SPDR S&P 500 Index ETF Trust |
| TLT | iShares Barclays 20+ Year Treasury Bond ETF |
| GCC | WisdomTree Continuous Commodity Index Fund |
| VOOG | Vanguard S&P 500 Growth ETF |
| VOOV | Vanguard S&P 500 Value ETF |
| EEM | iShares MSCI Emerging Markets ETF |
| XLG | Invesco S&P 500 Top 50 ETF |
| Symbol | Company | Sector | Current Price | Action Price | Target | Stop | Notes |
|---|---|---|---|---|---|---|---|
| AOS | A.O. Smith Corporation | Building | $55.64 | mid to upper 50s | 72 | 47 | 4 for 5'er, four consec buy signals, mutli-year high, market RS buy signal since 9/2008, 1.86% yield |
| BECN | Beacon Roofing Supply, Inc. | Building | $38.96 | 36 - 40 | 56 | 30 | 4 for 5'er, top third of fav DWABUIL, consec buy signals, 52 week highs, pos weekly mom flip |
| APAM | Artisan Partners Asset Management, Inc | Finance | $50.07 | mid-to-upper 40s | 53.50 | 39 | 5 for 5'er, top 20% of FINA sector matrix, multiple buy signals, pos wkly mom flip, 6% yield |
| LASR | nLIGHT, Inc. | Semiconductors | $35.17 | low-to-mid 30s | 55 | 27 | 5 for 5'er, top 10% of SEMI sector matrix, consec buy signals, pullback from multi-year high |
| JCI | Johnson Controls International PLC | Protection Safety Equipment | $46.24 | mid 30s | 58 | 39 | 4 for 5'er, top half of PROT sector matrix, multiple buy signals 2.3% yield, R-R>2.0 |
| DE | Deere & Company | Machinery and Tools | $270.70 | 250s to low 270s | 348 | 208 | 5 for 5'er, ATH, pos trend, top 25% of DWAMACH, triple top breakout |
| PWR | Quanta Services, Inc. | Electronics | $68.29 | hi 60s - low 70s | 86 | 58 | 5 for 5'er, top 20% of favored ELEC sector matrix, triple top breakout, pullback from ATH |
| PLAN | Anaplan, Inc. | Internet | $70.49 | upper 60s to mid 70s | 84 | 58 | 4 for 5'er, pullback from ATH, consec buy signals, top 25% DWAINET, pos weekly and mon mom |
| OPEN | Opendoor Technologies Inc. | Wall Street | $29.50 | 28 - 30 | 41 | 24 | 4 for 5'er, #1 of 24 in favored WALL sector matrix, multiple buy signals, new ATH |
| TGT | Target Corporation | Retailing | $170.42 | 160s - 170s | 186 | 140 | 4 for 5'er, favored RETA sector, multiple buy signals, pullback from ATH, 1.6% yield |
| Symbol | Company | Sector | Current Price | Action Price | Target | Stop | Notes |
|---|
| Comment |
|---|
| MS Morgan Stanley R ($68.20) - Wall Street - We will now raise our stop to $61, the first potential sell signal on MS's default chart. |
| AN Autonation Inc R. ($67.48) - Autos and Parts - Raise stop to $59 the second potential sell signal on AN's default chart. |
| TSLA Tesla Inc. R ($662.76) - Autos and Parts - We will now raise our stop to $560, the second potential sell signal on TSLA's default chart. |
TGT Target Corporation R ($172.28) - Retailing - TGT is a 4 for 5'er and belongs to the favored retail sector. On its default chart. After giving five consecutive buy signals and reaching an all-time high last month, TGT has subsequently pulled back to near the middle of its trading band, offering an entry point for long exposure here. Exposure may be added in the in the $160s - $170s and we will set our initial stop at $140, which would take out two levels of support on TGT's default chart. We will use the top of the trading band, $186, as our near-term price target. TGT also carries a 1.6% yield.
| 20 | |||||||||||||||||||||||||||||||||||||||||||||||||||||
| 180.00 | X | 180.00 | |||||||||||||||||||||||||||||||||||||||||||||||||||
| 178.00 | X | O | 178.00 | ||||||||||||||||||||||||||||||||||||||||||||||||||
| 176.00 | X | O | 176.00 | ||||||||||||||||||||||||||||||||||||||||||||||||||
| 174.00 | X | C | 174.00 | ||||||||||||||||||||||||||||||||||||||||||||||||||
| 172.00 | X | O | 172.00 | ||||||||||||||||||||||||||||||||||||||||||||||||||
| 170.00 | X | O | 170.00 | ||||||||||||||||||||||||||||||||||||||||||||||||||
| 168.00 | X | 168.00 | |||||||||||||||||||||||||||||||||||||||||||||||||||
| 166.00 | X | X | Mid | 166.00 | |||||||||||||||||||||||||||||||||||||||||||||||||
| 164.00 | X | O | X | 164.00 | |||||||||||||||||||||||||||||||||||||||||||||||||
| 162.00 | X | O | X | 162.00 | |||||||||||||||||||||||||||||||||||||||||||||||||
| 160.00 | A | O | X | 160.00 | |||||||||||||||||||||||||||||||||||||||||||||||||
| 158.00 | X | O | B | 158.00 | |||||||||||||||||||||||||||||||||||||||||||||||||
| 156.00 | X | X | O | X | 156.00 | ||||||||||||||||||||||||||||||||||||||||||||||||
| 154.00 | X | O | X | O | X | 154.00 | |||||||||||||||||||||||||||||||||||||||||||||||
| 152.00 | X | O | X | O | 152.00 | ||||||||||||||||||||||||||||||||||||||||||||||||
| 150.00 | X | O | X | 150.00 | |||||||||||||||||||||||||||||||||||||||||||||||||
| 148.00 | X | 9 | X | 148.00 | |||||||||||||||||||||||||||||||||||||||||||||||||
| 146.00 | X | O | X | Bot | 146.00 | ||||||||||||||||||||||||||||||||||||||||||||||||
| 144.00 | X | O | 144.00 | ||||||||||||||||||||||||||||||||||||||||||||||||||
| 142.00 | X | 142.00 | |||||||||||||||||||||||||||||||||||||||||||||||||||
| 140.00 | X | 140.00 | |||||||||||||||||||||||||||||||||||||||||||||||||||
| 138.00 | X | 138.00 | |||||||||||||||||||||||||||||||||||||||||||||||||||
| 136.00 | X | 136.00 | |||||||||||||||||||||||||||||||||||||||||||||||||||
| 134.00 | X | 134.00 | |||||||||||||||||||||||||||||||||||||||||||||||||||
| 132.00 | • | X | 132.00 | ||||||||||||||||||||||||||||||||||||||||||||||||||
| 130.00 | X | • | X | 130.00 | |||||||||||||||||||||||||||||||||||||||||||||||||
| 128.00 | C | O | • | X | 128.00 | ||||||||||||||||||||||||||||||||||||||||||||||||
| 126.00 | X | O | • | 8 | 126.00 | ||||||||||||||||||||||||||||||||||||||||||||||||
| 124.00 | X | 1 | • | X | X | 7 | 124.00 | ||||||||||||||||||||||||||||||||||||||||||||||
| 122.00 | X | O | • | X | O | X | X | O | X | 122.00 | |||||||||||||||||||||||||||||||||||||||||||
| 120.00 | X | O | • | X | O | X | O | X | O | X | 120.00 | ||||||||||||||||||||||||||||||||||||||||||
| 118.00 | X | O | 2 | • | X | O | X | O | X | O | 118.00 | ||||||||||||||||||||||||||||||||||||||||||
| 116.00 | X | O | X | O | • | X | O | 6 | 116.00 | ||||||||||||||||||||||||||||||||||||||||||||
| 114.00 | X | X | O | X | O | • | X | X | X | 114.00 | |||||||||||||||||||||||||||||||||||||||||||
| 112.00 | A | O | B | O | O | X | • | X | O | X | O | X | • | 112.00 | |||||||||||||||||||||||||||||||||||||||
| 110.00 | 9 | O | X | O | X | O | • | X | O | X | O | X | • | 110.00 | |||||||||||||||||||||||||||||||||||||||
| 108.00 | X | O | X | O | 3 | O | X | X | • | X | O | X | 5 | • | 108.00 | ||||||||||||||||||||||||||||||||||||||
| 106.00 | X | O | O | X | O | X | O | X | O | • | X | O | X | • | 106.00 | ||||||||||||||||||||||||||||||||||||||
| 104.00 | X | O | X | O | X | O | X | X | O | • | X | O | X | • | 104.00 | ||||||||||||||||||||||||||||||||||||||
| 102.00 | X | O | O | X | O | X | O | X | O | • | X | O | • | 102.00 | |||||||||||||||||||||||||||||||||||||||
| 100.00 | X | O | O | X | O | X | O | X | • | X | • | 100.00 | |||||||||||||||||||||||||||||||||||||||||
| 99.00 | X | O | X | O | X | O | X | O | • | X | • | 99.00 | |||||||||||||||||||||||||||||||||||||||||
| 98.00 | X | O | X | O | X | O | X | O | X | • | 98.00 | ||||||||||||||||||||||||||||||||||||||||||
| 97.00 | X | O | X | O | X | O | X | O | X | X | • | 97.00 | |||||||||||||||||||||||||||||||||||||||||
| 96.00 | X | O | X | O | X | O | X | O | X | O | X | • | 96.00 | ||||||||||||||||||||||||||||||||||||||||
| 95.00 | X | O | X | O | X | O | X | O | X | O | X | X | • | 95.00 | |||||||||||||||||||||||||||||||||||||||
| 94.00 | X | O | X | O | X | O | O | X | O | X | O | X | • | 94.00 | |||||||||||||||||||||||||||||||||||||||
| 93.00 | X | O | O | X | O | X | O | X | O | X | • | 93.00 | |||||||||||||||||||||||||||||||||||||||||
| 92.00 | X | O | O | X | 4 | O | X | • | 92.00 | ||||||||||||||||||||||||||||||||||||||||||||
| 91.00 | X | • | O | O | • | 91.00 | |||||||||||||||||||||||||||||||||||||||||||||||
| 90.00 | X | • | • | 90.00 | |||||||||||||||||||||||||||||||||||||||||||||||||
| 89.00 | X | 7 | X | X | • | 89.00 | |||||||||||||||||||||||||||||||||||||||||||||||
| 88.00 | X | O | X | O | X | O | X | • | 88.00 | ||||||||||||||||||||||||||||||||||||||||||||
| 87.00 | X | O | X | O | X | O | X | • | 87.00 | ||||||||||||||||||||||||||||||||||||||||||||
| 86.00 | X | O | O | O | X | X | • | 86.00 | |||||||||||||||||||||||||||||||||||||||||||||
| 85.00 | X | 8 | X | O | X | • | 85.00 | ||||||||||||||||||||||||||||||||||||||||||||||
| 84.00 | X | O | X | O | X | • | 84.00 | ||||||||||||||||||||||||||||||||||||||||||||||
| 83.00 | • | X | 6 | O | X | O | X | • | 83.00 | ||||||||||||||||||||||||||||||||||||||||||||
| 82.00 | • | 4 | O | X | O | X | O | • | 82.00 | ||||||||||||||||||||||||||||||||||||||||||||
| 81.00 | • | X | O | X | O | • | 81.00 | ||||||||||||||||||||||||||||||||||||||||||||||
| 80.00 | X | O | X | • | 80.00 | ||||||||||||||||||||||||||||||||||||||||||||||||
| 79.00 | X | O | X | • | 79.00 | ||||||||||||||||||||||||||||||||||||||||||||||||
| 78.00 | X | O | X | X | • | 78.00 | |||||||||||||||||||||||||||||||||||||||||||||||
| 77.00 | X | O | X | O | X | • | 77.00 | ||||||||||||||||||||||||||||||||||||||||||||||
| 76.00 | X | O | X | O | X | • | 76.00 | ||||||||||||||||||||||||||||||||||||||||||||||
| 75.00 | X | O | 5 | X | • | 75.00 | |||||||||||||||||||||||||||||||||||||||||||||||
| 74.00 | 3 | O | X | • | 74.00 | ||||||||||||||||||||||||||||||||||||||||||||||||
| 73.00 | X | X | O | X | • | 73.00 | |||||||||||||||||||||||||||||||||||||||||||||||
| 72.00 | X | O | X | O | X | • | 72.00 | ||||||||||||||||||||||||||||||||||||||||||||||
| 71.00 | X | O | X | O | • | 71.00 | |||||||||||||||||||||||||||||||||||||||||||||||
| 70.00 | X | 2 | • | 70.00 | |||||||||||||||||||||||||||||||||||||||||||||||||
| 69.00 | O | X | • | 69.00 | |||||||||||||||||||||||||||||||||||||||||||||||||
| 68.00 | O | X | • | 68.00 | |||||||||||||||||||||||||||||||||||||||||||||||||
| 67.00 | O | • | 67.00 | ||||||||||||||||||||||||||||||||||||||||||||||||||
| 20 |

| BHVN Biohaven Pharmaceutical Holding Company Ltd. ($93.44) - Drugs - BHVN shares pushed higher today to break a double top at $94 to mark its second consecutive buy signal. This 5 for 5'er has been in a positive trend since September and on an RS buy signal versus the market since April. BHVN is actionable at current levels with a weekly overbought/oversold reading of 22%. From here, support is offered at $90. |
| COLM Columbia Sportswear Company ($88.62) - Textiles/Apparel - COLM completed a bullish catapult pattern on Monday when it moved to $89. This breakout also caused the trend to flip positive. As a result, COLM is a 2 for 5’er within the textiles/apparel sector. At this time, COLM still shows weakness relative to its peers as it is on an RS sell signal and in a column of Os. From here, support sits at $83. |
| FLGT Fulgent Genetics Inc ($48.97) - Biomedics/Genetics - FLGT shares moved higher today to break a double top at $46 and continued higher to $49 marking its third consecutive buy signal. This 5 for 5'er has been in a positive trend since November and on an Rs buy signal versus the market since April. FLGT is actionable at current levels with a weekly overbought/oversold reading of 5%. From here, support is offered at $42. |
| HES Hess Corporation ($54.29) - Oil - HES gave an initial sell signal on Monday as it was down nearly 3% along with many other names in the sector as crude oil traded down more than 5% intraday. Despite Monday's action, the HES's technical picture remains positive as it is a 3 for 5'er, ranks in the top third of the oil sector matrix, and remains in a positive trend. From here, the next level of support sits at $47. |
| IDXX IDEXX Laboratories, Inc. ($487.78) - Healthcare - IDXX shares pushed higher today to break a double top at $488 to mark its fourth consecutive buy signal and reach a new all-time high. This 5 for 5'er has been in a positive trend since April and on an RS buy signal versus the market since June. IDXX is actionable at current levels with a weekly overbought/oversold reading of 45%. From here, support can be found at $424. |
| NWN Northwest Natural Gas Corp ($44.42) - Gas Utilities - NWN broke a double bottom at $46 before moving lower to $45 on Monday. As a result, NWN is now trading in a negative trend with just one technical attribute in its favor. The weight of the evidence is negative. Avoid. From here, additional support sits at $44. |
| PLCE Childrens Place Inc. ($47.95) - Retailing - PLCE, a perfect 5 for 5’er within the retailing sector, broke a double top at $48, marking the stock’s fourth consecutive buy signal. From here, support sits at $43. |
| PSNL Personalis, Inc. ($41.61) - Biomedics/Genetics - PSNL shares moved higher today to break a double top at $41 and continued higher to $42 to mark its second consecutive buy signal and reach a new all-time high. This 5 for 5'er has been in a positive trend since July and on an RS buy signal versus the market since April. PSNL is actionable at current levels with a weekly overbought/oversold reading of 52%. From here, support is offered at $34. |
| PVH Phillips-Van Heusen Corporation ($94.93) - Textiles/Apparel - PVH moved to a sell signal with Monday’s market action when it broke a triple bottom at $92. From here, PVH has support offered at $80. No new positions here. We will wait for a potential reversal up into Xs. PVH remains healthy for the long-term with 5 out of 5 attributes in its favor. |
| RCL Royal Caribbean Cruises Ltd. ($71.27) - Leisure - RCL broke a double bottom at $70 before moving lower to $69 on Monday, marking the stock’s second consecutive sell signal. RCL is a 4 for 5’er that would test its bullish support line with a move to $65. From here, RCL has support offered at $68. No new positions until demand re-enters the picture. |
| ROKU Roku, Inc. Class A ($355.57) - Media - ROKU broke a double top at $356 and is now trading at new all-time highs. Today’s breakout marks the ninth consecutive buy signal on the chart. ROKU is a perfect 5 for 5’er within the favored media sector that has experienced four weeks of positive weekly momentum. Note ROKU is heavily overbought at current levels and has support offered at $332. |
| URI United Rentals, Inc. ($229.55) - Machinery and Tools - Intraday action on Monday pushed URI to a sell signal with a double bottom break at $224. The 5 for 5'er remains in the top half of the favored machinery and tools stocks sector matrix and well-above its bullish support line. Market and Peer relative strength are also in favorable position. The weight of the evidence remains positive for URI. The next level of support is offered around $200. |
| Name | Option Symbol | Action | Stop Loss |
|---|---|---|---|
| Infosys Technologies Limited (India) ADR - $15.93 | O: 21D15.00D16 | Buy the April 15.00 calls at 1.70 | 14.00 |
| Name | Option | Action |
|---|---|---|
| NIKE, Inc. ( NKE) | Apr. 130.00 Calls | Raise the option stop loss to 16.35 (CP: 18.35) |
| Name | Option Symbol | Action | Stop Loss |
|---|---|---|---|
| Cisco Systems, Inc. - $44.88 | O: 21P45.00D16 | Buy the April 45.00 puts at 3.15 | 49.00 |
| Name | Option | Action |
|---|---|---|
| Intel Corporation (INTC) | Mar. 52.50 Puts | Raise the option stop loss to 5.65 (CP: 7.65) |
| Name | Option Sym. | Call to Sell | Call Price | Investment for 500 Shares | Annual Called Rtn. | Annual Static Rtn. | Downside Protection |
|---|---|---|---|---|---|---|---|
| Citizens Financial Group Inc $34.21 | O: 21B35.00D19 | Feb. 35.00 | 2.00 | $16,563.80 | 28.00% | 29.98% | 4.70% |
| Name | Action |
|---|---|
| Marathon Petroleum Corp. (MPC) - 40.35 | Sell the April 45.00 Calls. |
| Phillips-Van Heusen Corporation (PVH) - 95.26 | Sell the March 90.00 Calls. |
| Comerica Incorporated (CMA) - 52.63 | Sell the April 57.50 Calls. |
| Delta Air Lines Inc. (DAL) - 40.68 | Sell the March 45.00 Calls. |
| KeyCorp (KEY) - 15.42 | Sell the March 16.00 Calls. |
| Mosaic Company (MOS) - 23.39 | Sell the March 25.00 Calls. |
| American International Group, Inc. (AIG) - 37.48 | Sell the May 40.00 Calls. |
| L Brands Inc. (LB) - 38.63 | Sell the May 40.00 Calls. |
| Synovus Financial Corp. (SNV) - 31.96 | Sell the February 32.00 Calls. |
| Name | Covered Write |
|---|---|
|
|
|
Daily Equity & Market Analysis
Loading, Please Wait...
