Equity market futures suggested a pullback for the broad markets to start the holiday week, but intraday action reversed the storyline
We are excited to announce phase three of the Nasdaq Dorsey Wright Model Builder with the launch of Matrix and FSM-based Relative Strength (RS) Testing Service. As part of this launch, we are granting you free access to the service for the remainder of 2020. The tool is designed to help you more easily design, test, implement, and monitor custom models powered by the Nasdaq Dorsey Wright methodology. Please see below for replays of our latest webinar series covering the different aspects of the tool.
11/19/2020: Static Model Builder Demo Replay - Click Here
12/9/2020: Matrix Model Builder Demo Replay - Click here
11/5/2020: FSM Model Builder Demo Replay - Click here
Equity market futures were under pressure Monday (12/21) morning despite the highly anticipated announcement of a new stimulus bill from the United States government. Like the first package, the new action will include individual checks and weekly payments to those who qualify, in addition to funding for vaccine distribution (wsj.com). However, competing for headline attention, and arguably in focus much of the time, was an alternative strain of the coronavirus which appeared overseas. The news stoked investor fears as many risk-on assets traded lower during the morning hours; the Dow Jones Industrial Average (DJIA) was down as much as 400 points Monday morning before closing 37 points higher for the day. The Financials Sector was the best performing, followed by a late surge from the technology group. Given the notable intraday price swings of many indices and stocks, we decided to provide an update on a few major market charts and offer some key reminders about the rules of Point and Figure.
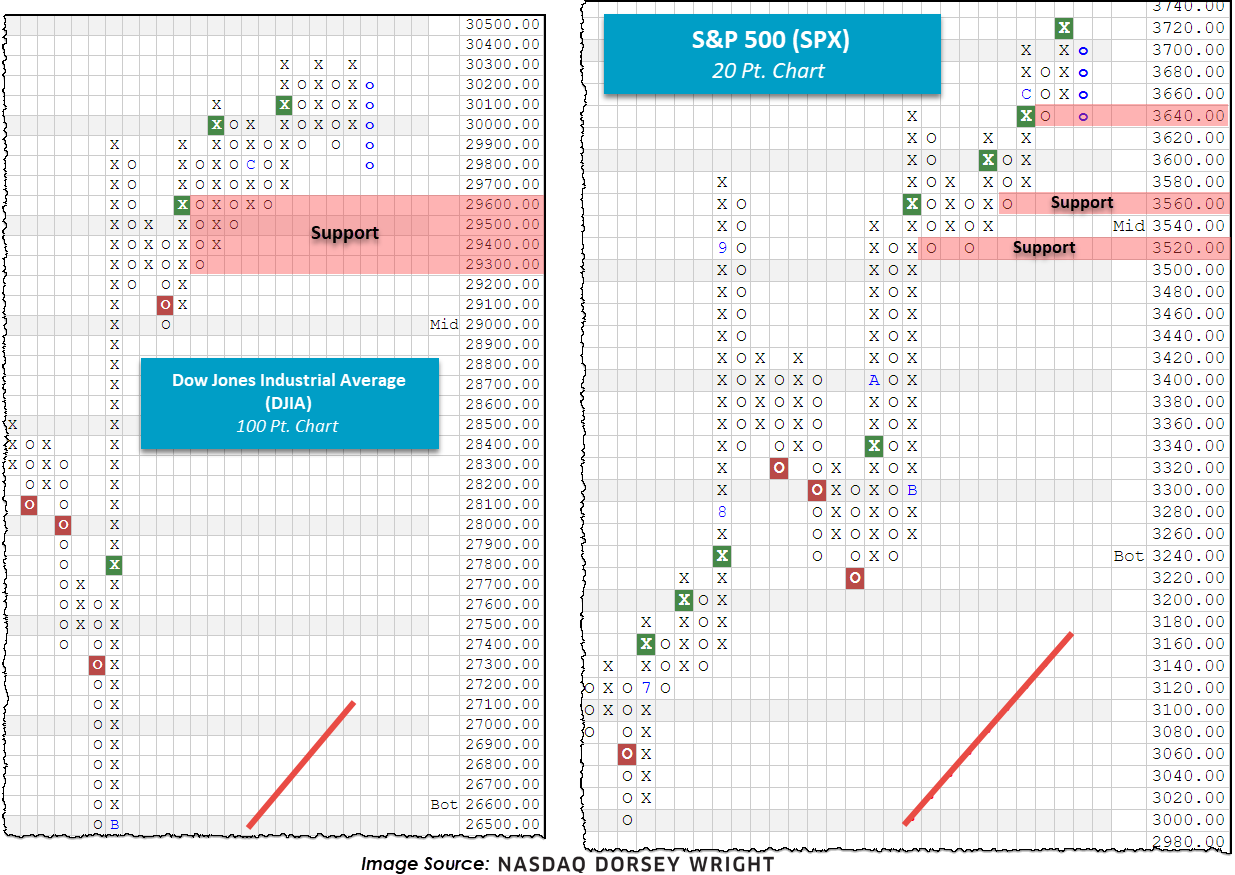
Beginning with the Dow, we note a blue column of Os which signals an intraday pullback to below the 29,800 level. The move did break support at 29,900 so we will now look toward the subsequent stair-stepped levels of support beginning around 29,600, a prior period of notable consolidation. Similarly, on the S&P 500 (SPX) 20-point chart we note a pullback from all-time high territory to 3640, resting the chart at initial support. Beyond current levels, we find support offered around 3560 and 3520. Looking across other risk-on areas we generally find similar movement, deep intraday pullbacks represented by a column of Os, despite a higher close for the day. This serves as a good reminder for a key rule of Point and Figure charting – one direction per day. Additionally, remember that Point & Figure uses the intraday highs and lows to plot price action, not closing values. Meaning, if a chart started the day in a column of Os and printed an intraday value beyond the current level (like many did this morning), the stock will post additional Os regardless if the stock were to rally later in the day. In the case of a rally, the change will likely reflect in the next trading day as a new series of highs and lows will be evaluated.
The majority of technical indicators across the NDW Research Platform remain unchanged despite the large movements today, and longer-dated positionings remain positive.