
Tesla is added to the S&P 500 Index as of Monday, but will its volatility come along for the ride?
Today marked the first trading day with Tesla TSLA being included in the S&P 500 Index SPX, as it replaced Apartment Investment & Management Co. AIV. At a market capitalization of over $624 billion, TSLA is the largest company to ever join the S&P 500. The stock has also seen extreme improvement in 2020, posting a year-to-date gain of over 730% through Friday, 12/18. While the stock has seen major growth, this name is also known for its heightened levels of volatility, causing many investors to be concerned that it could carry this volatility into the broad domestic benchmark after its inclusion. Tesla has seen a trailing 12-month weekly standard deviation reading of 87.77% through trading last Thursday, significantly higher than the 31.43% calculation of SPX over the same timeframe.
In order to test how the S&P 500 Index was affected by the inclusion of volatile names, we took the 12-month trailing weekly standard deviation of each addition to the index since March 1990 at the time the stock was added and compared these reading with the same calculations 12 months after each stock was added. Out of the 640 names examined, TSLA would rank 21st in its pre-inclusion standard deviation based on market data through last Thursday, 12/17. However, if we normalize the volatility of each inclusion based on the trailing 12-month standard deviation of SPX at the time of each stock’s addition, TSLA falls to a ranking of 195th, proving to be only slightly more volatile than average in stocks that have been added since 1990. This may seem somewhat surprising given the recent price movement of Tesla, we must keep in mind that the S&P 500 Index has not been a stranger to volatility itself over the past year. While we cannot know for sure what TSLA will look like from a standard deviation standpoint 12 months from now, we can use the rest of the names that have been added to the broad index over the past 30+ years to get an idea of how their volatility was affected after being added to the index.
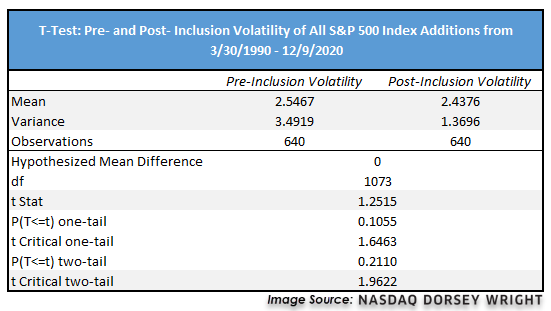
To test this, we took all the additions to the S&P 500 since March 1990 and ran a t-test on the normalized pre-inclusion volatility of each addition compared to the normalized post-inclusion volatility. As a refresher, a t-test is used in statistics to discern if there is a significant difference between the means of two groups of data (source: Investopedia.com). In our test, we are using the t-test to look at the mean of the pre-inclusion volatility compared with the post inclusion volatility, how the variance in these two sets of data changes, and whether or not the result is statistically significant as indicated by the t-stat being greater than the t-critical point.
Based on the results of this first test, we can see that the average of the post-inclusion volatility is slightly lower than the pre-inclusion average. Perhaps more notable, we can also see that the variance in the post-inclusion volatility declines substantially, indicating that the volatility of the stocks has a tighter buffer around the volatility of SPX after they are included in the index. However, our t-stat ultimately did not prove that there was a statistically significant difference between the two volatility averages. This means that while we saw noteworthy observations in the averages and variances of the pre-and post-inclusion volatility, we could not reach the 95% confidence threshold that the difference in averages was significant when examining all 640 additions.
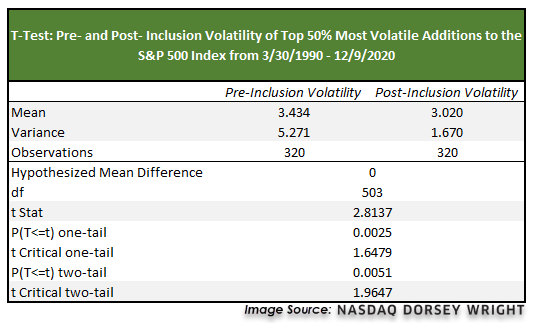
These results changed when we just examined the highly volatile additions to the S&P 500 Index, as identified by the stocks sitting in the top half of our pre-inclusion volatility ranking, or the top 320 names. Even though normalizing the trailing standard deviation of TSLA caused it to fall out of the top 10% of our volatility ranking, its position at 195th certainly leaves it in the top 50% of names. The results of our second t-test showed a further decline in the mean of post-inclusion volatility, and an even more significant decline in the variance of the two data sets. Furthermore, out t-stat reading did prove that we can be confident in the difference in mean between the two datasets. This tells us that names with heightened volatility at the time of their inclusion do typically show decreased volatility one year after being added to the S&P 500 Index.
As we previously mentioned, we cannot be certain what the volatility of Tesla will look like 12 months down the road. However, we do know that TSLA is the largest stock by market cap to ever be added to the S&P 500 Index. This likely heightened its publicity around volatility as it sits in about the 30th percentile of ranking S&P 500 additions from a pre-inclusion volatility perspective, after normalizing for SPX volatility. In looking at the top half of that pre-inclusion volatility ranking, we can also see that these more volatile names tend to trade more in line with the volatility of SPX one year after being added to the index.
