
Most Requested Symbols

The Percent Positive Trend for the S&P 500 (^PTSPX) and Percent Positive Trend for the NYSE (^PTNYSE) each reversed back up into a column of Xs.
Today, we will highlight some of the notable developments across the universe of major market ETFs covered in this report. Additionally, we will provide updated near-term support levels for all ten major market funds.
Today's featured stock is Square Inc (SQ).
ABG, AN, BLK, CVLG, KRNT, ODFL, RETA, SAH, TSLA & WERN.
Call: NRG Energy (NRG), Put: Flir Systems (FLIR), Covered Write: Discover Financial Services (DFS)
Upcoming KKM webinar: Join KKM on Wednesday, August 19th at 3 pm ET for a webinar focusing on models powered by Nasdaq Dorsey Wright methodology. The topic will be on "Dynamic & Active: Time to revisit two investment themes (powered by Nasdaq Dorsey Wright) for 2020", which is hosted by KKM and sponsored by Adhesion Wealth. Click here to register.
The pandemic has no doubt changed everyday life for people across the globe, which certainly applies to the way we travel. As many continue to stay at home and restrict their travels to only essential needs, we have seen the airline industry taking a significant hit during this difficult time. While many airline stocks continue to struggle having hit multi-year lows and trade in a negative trend, one stock that caught our attention is Southwest Airlines Co. LUV. The stock hit an intraday high on 8/11 at $37.44 putting the chart on a buy signal. That was also enough to push the stock into positive trend territory for the first time since February of this year, and as a result of that movement, its technical attribute moved from a 0 to a 1. Additionally, its weekly momentum is positive for the first week after having been negative for the last five weeks. While it is too early to make any judgement on the stock or the industry, it is worth keeping an eye on this particular chart for any future improvement that could potentially cause this to become a technically sound candidate.


Each week the analysts at DWA review and comment on all major asset classes in the global markets. Shown below is the summary or snapshot of the primary technical indicators we follow for multiple areas. Should there be changes mid-week we will certainly bring these to your attention via the report.
| Universe | BP Col & Level (actual) | BP Rev Level | PT Col & Level (actual) | PT Rev Level | HiLo Col & Level (actual) | HiLo Rev Level | 10 Week Col & Level (actual) | 10 Week Rev Level | 30 Week Col & Level (actual) | 30 Week Rev Level |
|---|---|---|---|---|---|---|---|---|---|---|
| ALL |
|
52% |
|
44% |
|
84% |
|
62% |
|
52% |
| NYSE |
|
62% |
|
50% |
|
86% |
|
68% |
|
54% |
| OTC |
|
48% |
|
40% |
|
84% |
|
58% |
|
52% |
| World |
|
54% |
|
40% |
|
|
|
54% |
|
48% |
As the S&P 500 SPX continues to push close to new highs, we are seeing a number of the underlying constituents of the index return to positive trends. The Percent Positive Trend for the S&P 500 ^PTSPX has reversed back into a column of X’s at 78% this week. After falling to a low of 8% on the chart back in March, PTSPX reversed up in April and was off to the races, rising all the way to 82% by mid-June. The current reading of 78% simply means that 78% of all S&P 500 stocks are in positive trends today, which is generally a positive sign for the market. This also comes as the Percent Positive Trend for the NYSE ^PTNYSE has reversed back to X’s at 56%, indicating a majority of NYSE stocks are in positive trends.
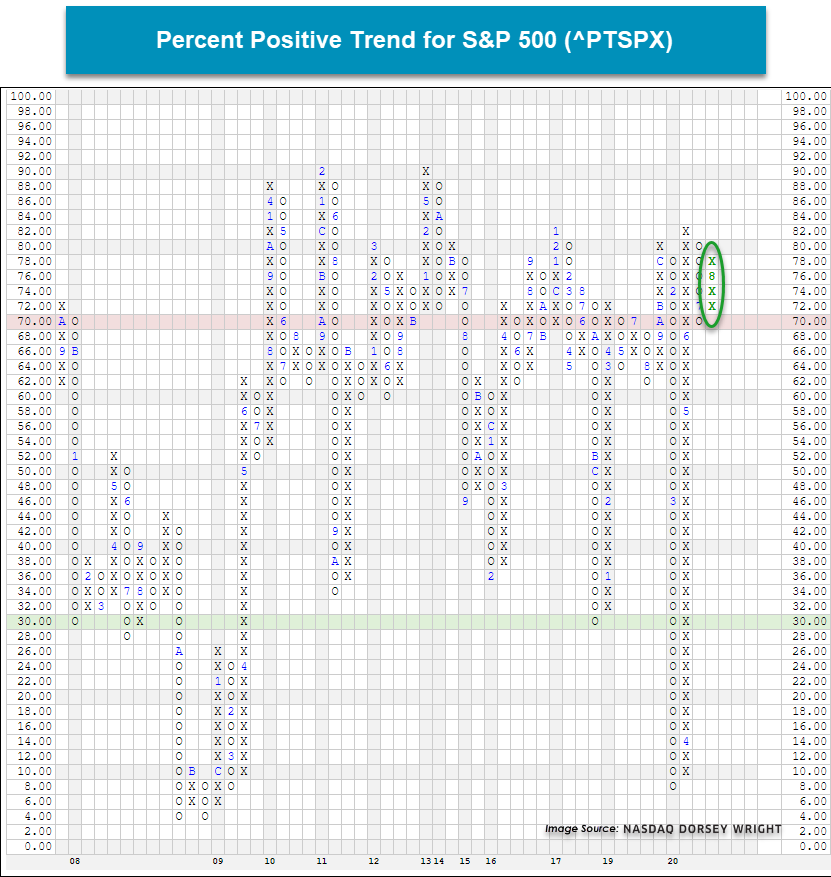
Going back to mid-2000, there have been 20 reversals back to X’s above 50% for the PTSPX chart and more often then not it has been a positive sign for the market. Of the previous 20 times the PTSPX reversed up while above 50%, the average 1-week, 2-week, 1-month, and 6-month returns have been positive. The average 6-month return was 3.17% for the S&P 500 with 13 out of the 20 occurrences showing positive returns. While there have not been all that many occasions to examine, as the PT charts are typically viewed as a long-term indicator, the reversal back to X’s for trend indicators like ^PTSPX or ^PTNYSE are signs that more stocks are returning to positive trends, which has historically been a good sign for the market.


| Symbol | Name | Price | Yield | PnF Trend | RS Signal | RS Col. | Fund Score | 200 Day MA | Weekly Mom |
|---|---|---|---|---|---|---|---|---|---|
| DIA | SPDR Dow Jones Industrial Average ETF Trust | 277.19 | 2.15 | Positive | O | 4.12 | 262.59 | +3W | |
| EEM | iShares MSCI Emerging Markets ETF | 43.86 | 2.04 | Positive | Sell | O | 4.99 | 40.80 | -1W |
| EFA | iShares MSCI EAFE ETF | 64.07 | 2.55 | Positive | Sell | O | 1.56 | 62.79 | -6W |
| FM | iShares MSCI Frontier 100 ETF | 24.13 | 3.29 | Negative | Sell | O | 0.39 | 26.00 | -6W |
| IJH | iShares S&P MidCap 400 Index Fund | 194.24 | 1.66 | Positive | Buy | O | 2.99 | 182.85 | +3W |
| IJR | iShares S&P SmallCap 600 Index Fund | 75.70 | 1.56 | Positive | Buy | O | 2.90 | 71.99 | +3W |
| QQQ | Invesco QQQ Trust | 265.19 | 0.62 | Positive | Buy | X | 5.72 | 221.23 | -1W |
| RSP | Invesco S&P 500 Equal Weight ETF | 110.55 | 1.94 | Positive | Buy | X | 4.28 | 104.57 | +3W |
| SPY | SPDR S&P 500 ETF Trust | 332.80 | 1.72 | Positive | O | 4.24 | 305.54 | +4W | |
| XLG | Invesco S&P 500 Top 50 ETF | 256.73 | 1.42 | Positive | O | 5.51 | 228.60 | -1W |
Over the last week of market action, two major market ETFs finished in the red while eight finished in positive territory. The best performing fund for the week was the iShares S&P SmallCap 600 Index Fund IJR with a gain of 4.50% while the Invesco QQQ Trust QQQ was the worst performing with a loss of -1.92%. Year-to-date, there are now three funds in positive territory for the year: QQQ (+24.73%) the Invesco S&P 500 Top 50 ETF XLG (+10%), and the SPDR S&P 500 ETF Trust SPY (+3.40%). Today, we will highlight some of the notable developments across the universe of major market ETFs covered in this report. Additionally, we will provide updated near-term support levels for all ten major market funds.
Spread Triple Top Buy Signal for EFA
With today’s market action, the chart of the iShares MSCI EAFE ETF EFA broke a spread triple top at $65, moving above resistance dating back to March of this year. Today’s breakout marks the third consecutive buy signal on the chart, confirming that demand is in control. Also, monthly momentum just flipped positive after having spent the prior six months on the negative side. Currently, EFA has a less than ideal fund score of 1.56 as it is showing weakness versus both the market and its peers. Be sure to set a fund score alert so that you will be emailed if EFA is able to move above the 3.00 threshold, making the fund more actionable. From here, initial support sits at $60 while the next level of resistance sits at $70, EFA’s January high.

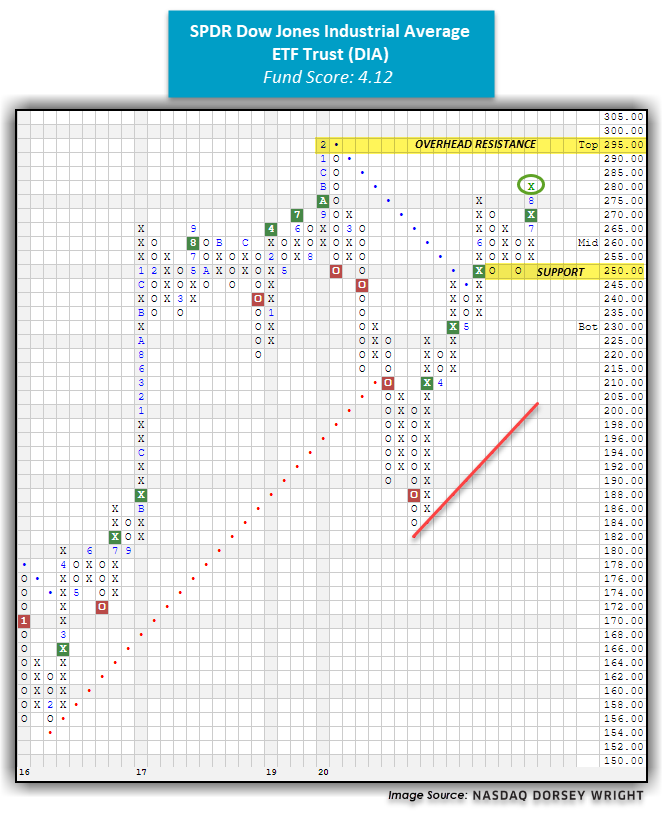
DIA Moves Higher
With yesterday’s market action, the SPDR Dow Jones Industrial Average ETF Trust DIA printed an X at $280, breaking through resistance dating back to June and now sits about 5% away from its all-time high from February at $295. In March, DIA fell as low as $184 when it gave four consecutive sell signals and moved into a negative trend. The fund has steadily recovered and has now given four consecutive buy signals. DIA has a solid fund score of 4.12 with a positive score direction of 1.64. Monthly momentum has been positive for two months, suggesting the potential for higher prices. From current levels, initial support sits at $250 while the bullish support line would be tested with a move to $200. Note DIA provides investors with a yield of 2.16%.
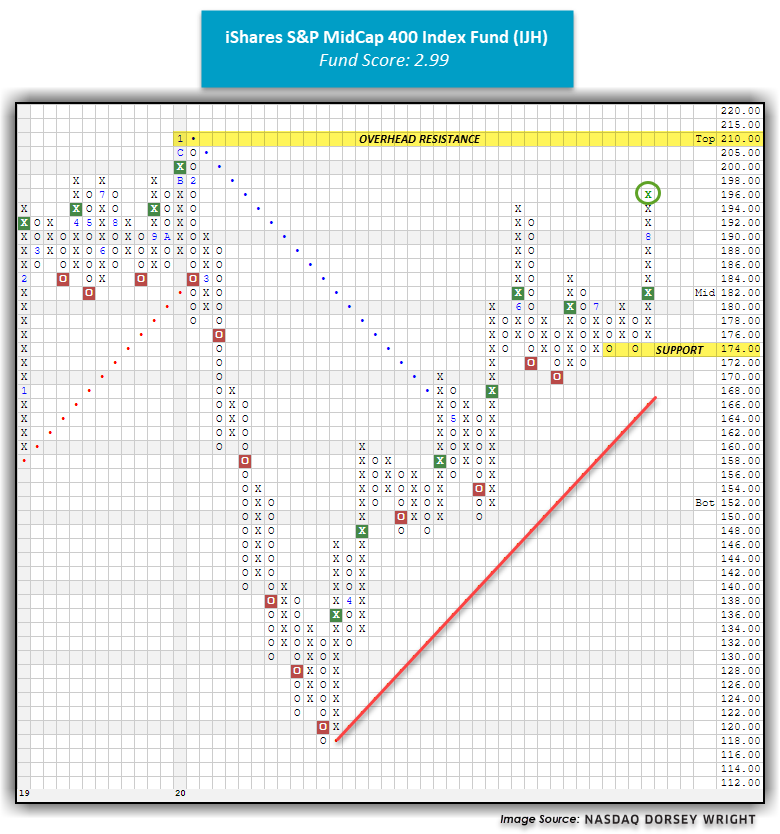
IJH Breaks Through Resistance
Yesterday, the iShares S&P MidCap 400 Index Fund IJH printed an X at $196, breaking through overhead resistance established in June. As a result, IJH has one final level of resistance to move through before it is back at all-time highs, which would come with a move to $215 or higher. IJH has given two consecutive buy signals since June, confirming that demand is in control. Monthly momentum has been positive for two months while weekly momentum has been positive for three weeks. Additionally, IJH has a fund score of 2.99 with a positive score direction of 2.56, speaking to the fund’s improvement over the trailing six months. The technical picture for IJH is strengthening, making new long positions welcome at current levels if looking for mid-cap exposure. As mentioned above, the last level of resistance lies at $210, IJH’s all-time high from January of this year, while initial support sits at $174.
Updated Support Levels

SECTOR BULLISH PERCENT CHANGES
| Reversed to X | Reversed to O |
|---|---|
| 11 (BPAERO | 64), (BPBANK | 54), (BPFINA | 56), (BPGAME | 74), (BPLEIS | 56), (BPMEDI | 60), (BPOIL | 46), (BPREAL | 66), (BPSAVI | 48), (BPTEXT | 64), (BPWALL | 70), |
3 (BPINET | 58), (BPPREC | 58), (BPSOFT | 56), |
| To Xs | To Os |
|---|---|
| Metals Non Ferrous ( 0.97 to 54 ) | None |
Average Level
61.88
| Sector |
|---|
| None |
| Sector |
|---|
| Oil (46%) - Bear Correction |
| Oil Service (42%) - Bull Alert |
| Savings & Loans (48%) - Bull Confirmed |
| Sector |
|---|
| Internet (58%) - Bull Correction |
| Precious Metals (58%) - Bull Correction |
| Software (56%) - Bear Confirmed |
SECTOR INDICATOR CHART CHANGES
PT is the percentage of stocks within a sector that are trading above their bullish support lines. RSX is the percentage of stocks within a sector whose relative strength charts are in a column of Xs. RSP is the percentage of stocks within a sector whose relative strength charts are on a buy signal. The strongest sectors, i.e. market leaders, will have most of these indicators positive and moving higher in a column of Xs.
|
There were only rising sector PT charts this week, with 26 rising and none moving lower. The following sector charts rose: Aerospace Airline [^PTAERO]-Rev. , Banks [^PTBANK]-Rev. , Business Products [^PTBUSI], Chemicals [^PTCHEM], Computers [^PTCOMP], Food Beverages/Soap [^PTFOOD], Forest Prods/Paper [^PTFORE], Gaming [^PTGAME]-Rev. , Healthcare [^PTHEAL], Household Goods [^PTHOUS], Insurance [^PTINSU], Leisure [^PTLEIS]-Rev. , Machinery and Tools [^PTMACH], Media [^PTMEDI]-Rev. , Metals Non Ferrous [^PTMETA], Oil Service [^PTOILS], Precious Metals [^PTPREC], Protection Safety Equipment [^PTPROT], Restaurants [^PTREST], Retailing [^PTRETA], Semiconductors [^PTSEMI], Software [^PTSOFT], Steel/Iron [^PTSTEE], Telephone [^PTTELE], Transports/Non Air [^PTTRAN], Waste Management [^PTWAST]. There were 5 that reversed to X. |
|
| ^PT Charts Reversing Up - | ^PT Charts Reversing Down - |
|
|
|
| ^PT Charts Moving Higher - | ^PT Charts Moving Lower - |
|
|
|
There were mostly falling sector RSX charts this week, with 12 falling and 9 rising. The following sector charts rose: Autos and Parts [^RSXAUTO]-Rev. , Computers [^RSXCOMP]-Rev. , Gaming [^RSXGAME], Oil [^RSXOIL], Oil Service [^RSXOILS], Restaurants [^RSXREST], Retailing [^RSXRETA]-Rev. , Savings & Loans [^RSXSAVI]-Rev. , Textiles/Apparel [^RSXTEXT]-Rev. . The following sector charts fell: Biomedics/Genetics [^RSXBIOM], Drugs [^RSXDRUG], Forest Prods/Paper [^RSXFORE]-Rev. , Healthcare [^RSXHEAL], Leisure [^RSXLEIS], Media [^RSXMEDI], Precious Metals [^RSXPREC], Protection Safety Equipment [^RSXPROT]-Rev. , Semiconductors [^RSXSEMI]-Rev. , Software [^RSXSOFT], Telephone [^RSXTELE], Transports/Non Air [^RSXTRAN]. |
|
| ^RSX Charts Reversing Up - | ^RSX Charts Reversing Down - |
| ^RSX Charts Moving Higher - | ^RSX Charts Moving Lower - |
|
There were mostly falling sector RSP charts this week, with 7 falling and 5 rising. The following sector charts rose: Building [^RSPBUIL], Electronics [^RSPELEC], Household Goods [^RSPHOUS], Machinery and Tools [^RSPMACH], Steel/Iron [^RSPSTEE]. The following sector charts fell: Banks [^RSPBANK], Biomedics/Genetics [^RSPBIOM], Drugs [^RSPDRUG], Media [^RSPMEDI]-Rev. , Oil [^RSPOIL], Oil Service [^RSPOILS], Textiles/Apparel [^RSPTEXT]-Rev. . There were 2 that reversed to O. |
|
| ^RSP Charts Reversing Up - | ^RSP Charts Reversing Down - |
|
|
|
| ^RSP Charts Moving Higher - | ^RSP Charts Moving Lower - |
FAVORED SECTOR STATUS CHANGES
A sector is considered to be Favored if it has 3 or 4 of the sector indicators (Relative Strength, RSX, RSP, & PT) positive, Average if it has 2 of the 4 indicators positive, & Unfavored if it has 0 or 1 of the indicators positive. The table below contains those sectors that have experienced a Favored Sector Status change over the past week. It is best to focus on sectors that are about 50% or lower on their Bullish Percent charts & are in Xs. Note: If a sector moves from Favored to Average, it doesn't necessarily mean that the sector in question has to be sold - it just means you need to evaluate your individual positions with exposure to that sector.
| Changes since 08/05/2020 | Full Report |
|
|
|
|
|||||||||||
|
|
|
|
|
|
|||||||||
|
|
|
|
|
|||||||||
|
|
|
|
|
|
|||||||||

International equities have continued to gain strength over the past week, as has been exemplified through some of the relative comparisons on the NDW research platform. One such example can be found in the broad asset class comparison of the Dynamic Asset Level Investing (DALI) tool, which stacks each of the six broad asset classes against one another in order to determine which area possesses the most relative strength. This ranking saw domestic equities overtake cash following market action on August 5th, during which the domestic equities asset class picked up 5 relative strength buy signals. Interestingly enough, we saw international equities also gain 5 buy signals on the same day, followed by an additional signal gained in the subsequent trading day. While international equities still sits in last place, it has moved substantially off its COVID-19 induced tally count low of 65 signals to its current tally of 123.
One way to view movement underneath the hood of the foreign equity space is through the Asset Class Group Scores (ACGS) page, which looks at a more in-depth breakdown of strength among various country and regional representatives, all sorted by the average score of the ETFs and mutual funds included in each classification. Out of 135 groups examined on this page, there are currently 102 groups with average scores above the 3.00 score threshold, which is often used as the line of demarcation for acceptable areas of the market. With over three-fourths of the tracked groups being in the top end of the 0 to 6 score range, we see most international equity groups in this territory, with the exception of the country/regional groups outside of Asia. This is not for lack of trying, as we can see through the score direction rank of the non-US view that only frontier markets and Middle East Africa Equity have seen a negative directional move.
One area that just moved above the 3 score line is India, with its recent score of 3.01 marking its highest level in over a year. Earlier this year, this group fell to its second-lowest fund score dating back to November of 2010, at a reading of only 0.53 on March 24th. Since that time, the score has moved largely higher to its current position. This improvement is also depicted through the 2.48 average direction of the India group, which is the fifth-highest directional reading of any group on the ACGS system.

The near-term strength of India is also shown through the iShares MSCI India ETF INDA, which fell to a multi-year low of $20.50 in March before climbing higher over the past few months. INDA moved back to a positive trend and gave a second consecutive buy signal in late-June at $29.50 having continued higher since that time to its current default chart position of $33. The 3.38 fund score bests the average non-Us equity fund of 3.30 as well as the aforementioned average India fund (3.01) and is paired with a strongly positive 3.23 score direction. Monthly momentum recently flipped positive, suggesting the potential for further upside from here. While the technical picture continues to improve, the recent price movement has left the fund in overbought territory, so those looking to add exposure would be best served to wait for a pullback or normalization of the trading band. Initial support can be found on the default chart at $27, while the more sensitive, ¼ point chart shows the potential for additional support at $31.75, $30.25, and $29.

The US Treasury 10YR Yield Index TNX completed a bearish signal reversal in Wednesday’s trading. Prior to Wednesday’s buy signal, TNX had given three consecutive sell signals, and hit its lowest point since March when it fell to 0.525% on its default chart earlier this month. The rise in yields was cited as one factor leading to the sell-off of gold GC/ and silver SI/ which had both been on strong upward trajectories in recent weeks.

There was similar action further out on the yield curve as the US Treasury 30YR Yield Index TYX also returned to a buy signal in Wednesday’s trading when it hit 1.375%. TYX had also given three consecutive sell signals prior to Wednesday.
The buy signals given by TNX and TYX are first sign of potentially rising interest rates that we have seen since June, when both yield indexes rallied to the highest points since February before reversing course and finding a series of lower tops and lower bottoms.
Despite the upward action movement in rates, which contributed to funds like the iShares Barclays 20+ Year Treasury Bond ETF TLT and iShares US Core Bond Fund AGG reversing down into Os on their default charts, the iShares Barclays US Treasury Inflation Protected Securities ETF TIP remains at an all-time high on its default chart as Producer Price Index and Consumer Price Index showed higher than expected inflation this week. Within the Asset Class Group Scores (ACGS) System, the inflation protection group now has an average group score of 4.87 placing it second amongst fixed income groups after convertible bonds.
Remember, these are technical comments only. Just as you must be aware of fundamental data for the stocks we recommend based on technical criteria in the report, so too must you be aware of important data regarding delivery, market moving government releases, and other factors that may influence commodity pricing. We try to limit our technical comments to the most actively traded contracts in advance of delivery, but some contracts trade actively right up to delivery while others taper off well in advance. Be sure you check your dates before trading these contracts. For questions regarding this section or additional coverage of commodities email james.west@dorseywright.com.
Data represented in the table below is through 8/11/2020:
Broad Market Commodities Report
| Symbol | Name | Price | PnF Trend | RS Signal | RS Col. | 200 Day MA | Weekly Mom |
|---|---|---|---|---|---|---|---|
| CL/ | Crude Oil Continuous | 41.54 | Positive | Buy | X | 42.69 | -6W |
| DBLCIX | Deutsche Bank Liquid Commodities Index | 273.59 | Negative | Sell | O | 279.49 | +18W |
| DWACOMMOD | DWA Continuous Commodity Index | 495.76 | Positive | Buy | O | 461.31 | -183W |
| GC/ | Gold Continuous | 1917.50 | Positive | Buy | X | 1651.53 | +6W |
| HG/ | Copper Continuous | 2.84 | Positive | Buy | X | 2.60 | -2W |
| ZG/ | Corn (Electronic Day Session) Continuous | 311.75 | Negative | Buy | O | 351.68 | -4W |
The recent week of market action ushered in more headlines surrounding the commodities space, specifically the sharp pullback in precious metals and rebound in softs. Recent darlings like Gold GC/ and Silver SI/ experienced rather dramatic moves lower over the past week, posting losses of -5.76% and -6.54%, respectively (returns from 8/4/20 - 8/11/20). Consequently, GC/ returned to a sell signal on its default Point and Figure chart after a series of four consecutive buy signals and SI/ reversed down into a column of Os, yet remained above near-term support offered at $23.50 to maintain its two consecutive buy signals. Tracking ETFs like the SPDR Gold Trust GLD and iShares Silver Trust SLV also downshifted yet remain on Point and Figure buy signals on their default chart. However, perhaps noteworthy is the divergence in score direction between GLD and SLV, as the latter maintains a strongly positive score direction while GLD shows negative recent movement. Both funds remain above the optimal 4.00 score threshold and in overall positive trends, but ensure alerts are set if any further deterioration manifests.
On the contrary, we note near-term improvement from soft commodities like Cocoa CC/ and Coffee KC/. In fact, according to data from the Commodity Futures Trading Commission, “short positions in sugar were down by nearly 10,000 contracts, cocoa shorts were cut by more than 7,000 contracts and coffee shorts fell by more than 19,000 contracts” (Source: wsj.com). From a technical perspective, we find CC/ and KC/ both reentering positive trends in the last three weeks, demonstrating absolute strength after posting bottoms in June and July. Furthermore, products like the iPath Bloomberg Cocoa Subindex Total Return ETN NIB and iPath Bloomberg Coffee Subindex Total Return ETN JO reentered positive trends in the past two weeks, and also sport strongly positive score directions north of 2.0. Note the current fund scores for NIB and JO are also hovering around the acceptable 3.0 score line, yet still below the optimal fund scores put out by the precious metals camp.
In aggregate, the near-term pullback in precious metals and rebound in soft commodities has narrowed the leadership gap within the alternative assets space; however, the weight of the evidence does not yet suggest a change in the leaders themselves.

Average Level
32.67
| AGG | iShares US Core Bond ETF |
| USO | United States Oil Fund |
| DIA | SPDR Dow Jones Industrial Average ETF |
| DVY | iShares Dow Jones Select Dividend Index ETF |
| DX/Y | NYCE U.S.Dollar Index Spot |
| EFA | iShares MSCI EAFE ETF |
| FXE | Invesco CurrencyShares Euro Trust |
| GLD | SPDR Gold Trust |
| GSG | iShares S&P GSCI Commodity-Indexed Trust |
| HYG | iShares iBoxx $ High Yield Corporate Bond ETF |
| ICF | iShares Cohen & Steers Realty ETF |
| IEF | iShares Barclays 7-10 Yr. Tres. Bond ETF |
| LQD | iShares iBoxx $ Investment Grade Corp. Bond ETF |
| IJH | iShares S&P 400 MidCap Index Fund |
| ONEQ | Fidelity Nasdaq Composite Index Track |
| QQQ | Invesco QQQ Trust |
| RSP | Invesco S&P 500 Equal Weight ETF |
| IWM | iShares Russell 2000 Index ETF |
| SHY | iShares Barclays 1-3 Year Tres. Bond ETF |
| IJR | iShares S&P 600 SmallCap Index Fund |
| SPY | SPDR S&P 500 Index ETF Trust |
| TLT | iShares Barclays 20+ Year Treasury Bond ETF |
| GCC | WisdomTree Continuous Commodity Index Fund |
| VOOG | Vanguard S&P 500 Growth ETF |
| VOOV | Vanguard S&P 500 Value ETF |
| EEM | iShares MSCI Emerging Markets ETF |
| XLG | Invesco S&P 500 Top 50 ETF |
Relative strength is a measure of how a stock is performing when compared to something else, in this case the S&P 500 Equal Weighted Index (SPXEWI). Each day the stock's closing price is divided by that of the SPXEWI, the resulting numbers decimal is moved two places and then plotted on a Point & Figure chart. Whenever the relative strength chart shows a double top buy signal (e.g. RS Buy or Positive Relative Strength), it suggests the stock is likely to outperform the market for the foreseeable future. Conversely, whenever the relative strength chart gives a double bottom sell signal (e.g. RS Sell or Negative Relative Strength) it suggests the stock will under-perform the market. Relative strength signals tend to last roughly 18 to 24 months on average. Consequently, changes from buy signals to sell signals (and vice versa) are important to be aware of as they are longer-term implications of a stock's likely performance versus the indices. Using the Point & Figure chart along with the relative strength chart will allow you to better ascertain risk-reward and other trade management tools, but we always want to over-weight our portfolios toward those stocks that are on RS buy signals, giving us the best chance of outperforming the broader market.
In the Optionable Universe, this week we saw 23 relative strength buy signals compared to 27 last week. On the sell side, there were 29 relative strength sell signals compared to 26 last week.
| Symbol | Company | Sector | Price | RS vs Market Signal | RS vs Market Column | RS vs Peer Signal | RS vs Peer Column | Tech Attrib |
|---|---|---|---|---|---|---|---|---|
| AGYS | Agilysys, Inc. | Industrial Goods & Svcs | 24.020 | Buy | X | Sell | X | 4 |
| CMC | Commercial Metals Corporation | Basic Resources | 22.490 | Buy | X | Buy | X | 5 |
| DE | Deere & Company | Industrial Goods & Svcs | 193.220 | Buy | X | Buy | X | 4 |
| FDX | FedEx Corporation | Industrial Goods & Svcs | 196.450 | Buy | X | Buy | X | 5 |
| FIX | Comfort Systems U.S.A. | Industrial Goods & Svcs | 54.300 | Buy | X | Buy | X | 4 |
| FSLR | First Solar, Inc. | Semiconductors | 70.190 | Buy | X | Sell | X | 4 |
| MTOR | Meritor Inc | Automobiles | 25.500 | Buy | X | Buy | X | 5 |
| MOS | Mosaic Company | Chemicals | 17.640 | Buy | X | Buy | X | 5 |
| MTSC | MTS Systems Corp | Industrial Goods & Svcs | 24.130 | Buy | X | Sell | X | 3 |
| PCAR | PACCAR Inc. | Industrial Goods & Svcs | 90.390 | Buy | X | Buy | X | 4 |
| PWR | Quanta Services, Inc. | Industrial Goods & Svcs | 49.860 | Buy | X | Sell | X | 4 |
| OMER | Omeros Corporation | Biotechnology | 15.890 | Buy | O | Buy | O | 3 |
| TRMB | Trimble Inc. | Communications Technology | 47.960 | Buy | X | Sell | X | 4 |
| TTEC | TTEC Holdings Inc | Industrial Goods & Svcs | 56.130 | Buy | X | Buy | X | 5 |
| TWIN | Twin Disc, Incorporated | Automobiles | 7.230 | Buy | X | Sell | X | 2 |
| VLRS | Controladora Vuela Compania (Mexico) ADR | Cyclical Goods and Services | 6.900 | Buy | X | Sell | X | 3 |
| PFNX | Pfenex Inc. | Biotechnology | 12.830 | Buy | X | Buy | X | 5 |
| CNXM | CNX Midstream Partners LP | 9.560 | Buy | X | Buy | X | 4 |
|
| SPNE | SeaSpine Holdings Corp | Medical Products | 13.980 | Buy | X | Buy | X | 5 |
| MCRB | Seres Therapeutics Inc. | Biotechnology | 20.040 | Buy | X | Buy | X | 5 |
| MOS.TR | Mosaic Company TR | Chemicals | 17.860 | Buy | X | Buy | X | 5 |
| PWR.TR | Quanta Services, Inc. TR | Industrial Goods & Svcs | 50.172 | Buy | X | Sell | X | 4 |
| TRMB.TR | Trimble Inc. TR | Communications Technology | 47.960 | Buy | X | Sell | X | 4 |
| Symbol | Company | Sector | Price | RS vs Market Signal | RS vs Market Column | RS vs Peer Signal | RS vs Peer Column | Tech Attrib |
|---|---|---|---|---|---|---|---|---|
| CORT | Corcept Therapeutics Inc. | Biotechnology | 13.510 | Sell | O | Buy | O | 2 |
| ED | Consolidated Edison, Inc. | Electric Utilities | 73.260 | Sell | O | Sell | O | 0 |
| HFC | HollyFrontier Corporation | Oil Companies Secondary | 26.490 | Sell | O | Sell | O | 0 |
| DK | Delek US Holdings, Inc. | Oil Companies Major | 15.250 | Sell | O | Buy | O | 1 |
| GLUU | Glu Mobile Inc. | Software | 7.410 | Sell | O | Sell | O | 1 |
| ASPS | Altisource Portfolio Solutions SA (Luxembourg) ADR | Financial Services | 9.000 | Sell | O | Sell | O | 0 |
| GRFS | Grifols S.A. (Spain) ADR | Biotechnology | 17.990 | Sell | O | Sell | O | 1 |
| MYL | Mylan NV | Pharmaceuticals | 16.640 | Sell | O | Sell | O | 1 |
| NWN | Northwest Natural Gas Corp | Gas Utilities | 54.050 | Sell | O | Buy | O | 1 |
| ODP | Office Depot, Inc. | Retail | 19.290 | Sell | O | Sell | O | 0 |
| SKT | Tanger Factory Outlet Centers | Equity REITs | 6.670 | Sell | O | Sell | O | 0 |
| UFI | Unifi Inc | Cyclical Goods and Services | 12.690 | Sell | O | Sell | O | 0 |
| ZIXI | ZixIt Corporation | Software | 5.880 | Sell | O | Sell | O | 1 |
| AGIO | Agios Pharmaceuticals Inc. | Biotechnology | 40.400 | Sell | O | Sell | O | 0 |
| DRNA | Dicerna Pharmaceuticals Inc | Biotechnology | 19.750 | Sell | O | Buy | O | 2 |
| AKBA | Akebia Therapeutics, Inc | Biotechnology | 10.280 | Sell | O | Buy | O | 2 |
| ATNM | Actinium Pharmaceuticals Inc | Pharmaceuticals | 9.660 | Sell | O | Buy | O | 1 |
| XENE | Xenon Pharmaceuticals Inc | Biotechnology | 11.030 | Sell | O | Sell | O | 0 |
| RETA | Reata Pharmaceuticals Inc | Biotechnology | 103.600 | Sell | O | Sell | O | 0 |
| EVBG | Everbridge Inc | Software | 120.870 | Sell | O | Sell | O | 0 |
| AYX | Alteryx Inc | Software | 110.740 | Sell | O | Sell | O | 0 |
| APRN | Blue Apron Holdings, Inc. Class A | Noncyclical Goods and Svcs | 8.340 | Sell | O | Sell | O | 1 |
| FENC | Fennec Pharmaceuticals Inc. | Biotechnology | 6.660 | Sell | O | Sell | O | 0 |
| CRON | Cronos Group Inc | Pharmaceuticals | 5.550 | Sell | O | Sell | O | 0 |
| FSLY | Fastly, Inc. Class A | Technology Services | 74.960 | Sell | O | Sell | O | 1 |
| WORK | Slack Technologies, Inc. Class A | Technology Services | 27.610 | Sell | O | Sell | O | 1 |
| NEU.TR | NewMarket Corporation TR | Chemicals | 379.029 | Sell | O | Sell | O | 0 |
| UFI.TR | Unifi Inc TR | Cyclical Goods and Services | 12.690 | Sell | O | Sell | O | 0 |
| SKT.TR | Tanger Factory Outlet Centers TR | Equity REITs | 7.010 | Sell | O | Buy | O | 1 |
| Symbol | Company | Sector | Current Price | Action Price | Target | Stop | Notes |
|---|---|---|---|---|---|---|---|
| PAGS | PagSeguro Digital Ltd. Class A | Business Products | $37.74 | hi 30s - low 40s | 53 | 33 | 5 for 5'er, #5 of 100 names in favored BUSI sector matrix, triple top breakout, pos monthly mom flip, |
| BLK | BlackRock, Inc. | Wall Street | $586.64 | mid 530s - low 600s | $680 | $448 | 4 for 5'er, pullback from ATH, consec buy signals, pos weekly & mon mom, 2.52% yield |
| SNPS | Synopsys Inc | Software | $191.04 | mid 190s to low 210s | 228 | 162 | 5 for 5'er, consec buy signals, pullback from ATH, pos mon mom, LT market RS buy signal Earnings 8/19 |
| MS | Morgan Stanley | Wall Street | $51.78 | hi 40s - low 50s | 70 | 43 | 5 for 5'er, top quartile of WALL sector matrix, LT pos mkt RS, 2.9% yield, good R-R |
| NOW | Servicenow Inc | Software | $421.36 | low 440s to upper 460s | $588 | $344 | 4 for 5'er, 8 consec buy signals, pullback from AT high, LT makret RS buy signal |
| PII | Polaris Inc. | Leisure | $107.26 | low $100s to mid $110s | $138 | $84 | 5 for 5'er, one box from 5th consec buy signal, pos weekly mom flip, 2 mons pos month momentum, 2.36% yield |
| NRG | NRG Energy, Inc. | Utilities/Electricity | $34.90 | mid to upper 30s | $49 | $27 | 5 for 5'er, LT market RS buy signal, consec buy signals, pos mon and weekly momentum, 3.58% yield |
| CTAS | Cintas Corporation | Textiles/Apparel | $318.33 | low 300s to mid 330s | $400 | $252 | 5 for 5'er, top 25% of favored DWATEXT sector, pos mon & weekly mom, LT market/peer RS buy signals, up against ATH. |
| WMB | Williams Companies Inc. | Gas Utilities | $21.42 | 20 - 22 | 26.5 | 17 | 4 for 5'er, top 10% of GUTI sector matrix, 7.7% yield, pot. covered write |
| SQ | Square Inc | Software | $138.25 | high $130s - low $140s | $156 | $116 | 5 for 5'er, #2 of 113 names in favored SOFT sector matrix, pullback from ATH, pot. covered write, |
| Symbol | Company | Sector | Current Price | Action Price | Target | Stop | Notes |
|---|---|---|---|---|---|---|---|
| THS | TreeHouse Foods, Inc. | Food Beverages/Soap | $43.33 | low to mid 40s | 36 | 53 | 0 for 5'er, consec sell signals, LT market RS sell signal, bottom quartile of DWAFOOD |
| Symbol | Company | Sector | Current Price | Action Price | Target | Stop | Notes |
|---|---|---|---|---|---|---|---|
| MSFT | Microsoft Corporation | Software | $203.38 | hi 190s - low 210s | 264 | 164 | OK to add or maintain exposure here. Abide by trend line stop. |
| Comment |
|---|
| MDB MongoDB, Inc. Class A R ($194.01) - Software - MDB reversed up in Wednesday's trading after hitting our stop on Tuesday offering a potential exit opp for any with open long exposure. |
| ABBV AbbVie Inc. R ($95.41) - Drugs - We will now raise our stop to $80, which would take out multiple levels of support on ABBV's default chart. |
| SAH Sonic Automotive Inc. R ($46.11) - Retailing - We will now raise our stop to $37, the first potential sell signal on SAH's default chart. |
SQ Square Inc R ($138.90) - Software - SQ is 5 for 5'er that ranks #2 out of 113 names in the favored software sector matrix. On its default chart, SQ has given two consecutive buy signals and reached a new all-time high earlier this month before pulling back, offering an entry point for long exposure. SQ also offers a potential covered write opportunity on the December '20 call options. Long exposure may be added in the high $130s to low $140s and we will set our initial stop at $116, a potential spread triple bottom break on SQ's default chart. We will use the bullish price objective of $156 as our target price.
| 158.00 | X | 158.00 | ||||||||||||||||||||||||||||||||||||||||||||||||||||
| 156.00 | X | O | 156.00 | |||||||||||||||||||||||||||||||||||||||||||||||||||
| 154.00 | X | O | Top | 154.00 | ||||||||||||||||||||||||||||||||||||||||||||||||||
| 152.00 | X | O | 152.00 | |||||||||||||||||||||||||||||||||||||||||||||||||||
| 150.00 | X | O | 150.00 | |||||||||||||||||||||||||||||||||||||||||||||||||||
| 148.00 | X | O | 148.00 | |||||||||||||||||||||||||||||||||||||||||||||||||||
| 146.00 | X | O | 146.00 | |||||||||||||||||||||||||||||||||||||||||||||||||||
| 144.00 | X | O | 144.00 | |||||||||||||||||||||||||||||||||||||||||||||||||||
| 142.00 | X | O | x | 142.00 | ||||||||||||||||||||||||||||||||||||||||||||||||||
| 140.00 | X | O | x | 140.00 | ||||||||||||||||||||||||||||||||||||||||||||||||||
| 138.00 | X | O | x | 138.00 | ||||||||||||||||||||||||||||||||||||||||||||||||||
| 136.00 | X | O | 136.00 | |||||||||||||||||||||||||||||||||||||||||||||||||||
| 134.00 | X | 134.00 | ||||||||||||||||||||||||||||||||||||||||||||||||||||
| 132.00 | X | 8 | 132.00 | |||||||||||||||||||||||||||||||||||||||||||||||||||
| 130.00 | X | O | X | X | 130.00 | |||||||||||||||||||||||||||||||||||||||||||||||||
| 128.00 | X | X | O | X | O | X | 128.00 | |||||||||||||||||||||||||||||||||||||||||||||||
| 126.00 | X | O | X | O | X | O | X | 126.00 | ||||||||||||||||||||||||||||||||||||||||||||||
| 124.00 | X | O | X | O | X | X | O | X | 124.00 | |||||||||||||||||||||||||||||||||||||||||||||
| 122.00 | X | O | O | X | O | X | O | X | 122.00 | |||||||||||||||||||||||||||||||||||||||||||||
| 120.00 | X | O | X | O | X | O | X | 120.00 | ||||||||||||||||||||||||||||||||||||||||||||||
| 118.00 | X | O | X | O | O | 118.00 | ||||||||||||||||||||||||||||||||||||||||||||||||
| 116.00 | X | O | X | 116.00 | ||||||||||||||||||||||||||||||||||||||||||||||||||
| 114.00 | X | O | X | Mid | 114.00 | |||||||||||||||||||||||||||||||||||||||||||||||||
| 112.00 | X | O | 112.00 | |||||||||||||||||||||||||||||||||||||||||||||||||||
| 110.00 | X | 110.00 | ||||||||||||||||||||||||||||||||||||||||||||||||||||
| 108.00 | 7 | 108.00 | ||||||||||||||||||||||||||||||||||||||||||||||||||||
| 106.00 | X | X | 106.00 | |||||||||||||||||||||||||||||||||||||||||||||||||||
| 104.00 | X | O | X | 104.00 | ||||||||||||||||||||||||||||||||||||||||||||||||||
| 102.00 | X | O | X | 102.00 | ||||||||||||||||||||||||||||||||||||||||||||||||||
| 100.00 | X | X | O | X | 100.00 | |||||||||||||||||||||||||||||||||||||||||||||||||
| 99.00 | X | O | X | O | 99.00 | |||||||||||||||||||||||||||||||||||||||||||||||||
| 98.00 | X | O | X | 98.00 | ||||||||||||||||||||||||||||||||||||||||||||||||||
| 97.00 | X | O | X | 97.00 | ||||||||||||||||||||||||||||||||||||||||||||||||||
| 96.00 | X | O | 96.00 | |||||||||||||||||||||||||||||||||||||||||||||||||||
| 95.00 | X | 95.00 | ||||||||||||||||||||||||||||||||||||||||||||||||||||
| 94.00 | X | 94.00 | ||||||||||||||||||||||||||||||||||||||||||||||||||||
| 93.00 | X | 93.00 | ||||||||||||||||||||||||||||||||||||||||||||||||||||
| 92.00 | X | X | X | 92.00 | ||||||||||||||||||||||||||||||||||||||||||||||||||
| 91.00 | X | O | X | X | O | X | 91.00 | |||||||||||||||||||||||||||||||||||||||||||||||
| 90.00 | X | O | X | O | X | O | X | 90.00 | ||||||||||||||||||||||||||||||||||||||||||||||
| 89.00 | X | O | X | O | X | O | X | 89.00 | ||||||||||||||||||||||||||||||||||||||||||||||
| 88.00 | X | O | X | O | O | X | 88.00 | |||||||||||||||||||||||||||||||||||||||||||||||
| 87.00 | X | O | O | X | 87.00 | |||||||||||||||||||||||||||||||||||||||||||||||||
| 86.00 | X | O | X | 86.00 | ||||||||||||||||||||||||||||||||||||||||||||||||||
| 85.00 | X | O | 85.00 | |||||||||||||||||||||||||||||||||||||||||||||||||||
| 84.00 | • | X | X | 84.00 | ||||||||||||||||||||||||||||||||||||||||||||||||||
| 83.00 | O | • | X | X | O | 6 | 83.00 | |||||||||||||||||||||||||||||||||||||||||||||||
| 82.00 | O | • | X | O | X | O | X | 82.00 | ||||||||||||||||||||||||||||||||||||||||||||||
| 81.00 | O | • | X | X | O | X | O | X | 81.00 | |||||||||||||||||||||||||||||||||||||||||||||
| 80.00 | O | • | X | O | X | O | X | O | X | 80.00 | ||||||||||||||||||||||||||||||||||||||||||||
| 79.00 | O | X | • | X | O | X | O | O | X | 79.00 | ||||||||||||||||||||||||||||||||||||||||||||
| 78.00 | O | X | O | • | X | O | X | O | X | 78.00 | ||||||||||||||||||||||||||||||||||||||||||||
| 77.00 | O | X | O | • | X | X | O | O | 77.00 | |||||||||||||||||||||||||||||||||||||||||||||
| 76.00 | O | O | • | X | X | O | X | • | 76.00 | |||||||||||||||||||||||||||||||||||||||||||||
| 75.00 | O | • | X | O | X | O | X | • | Bot | 75.00 | ||||||||||||||||||||||||||||||||||||||||||||
| 74.00 | O | • | X | O | X | O | X | • | 74.00 | |||||||||||||||||||||||||||||||||||||||||||||
| 73.00 | O | • | X | O | X | O | X | • | 73.00 | |||||||||||||||||||||||||||||||||||||||||||||
| 72.00 | O | • | X | O | O | X | • | 72.00 | ||||||||||||||||||||||||||||||||||||||||||||||
| 71.00 | • | O | • | X | O | • | 71.00 | |||||||||||||||||||||||||||||||||||||||||||||||
| 70.00 | • | O | • | X | • | 70.00 | ||||||||||||||||||||||||||||||||||||||||||||||||
| 69.00 | O | • | X | • | 69.00 | |||||||||||||||||||||||||||||||||||||||||||||||||
| 68.00 | O | X | • | X | • | 68.00 | ||||||||||||||||||||||||||||||||||||||||||||||||
| 67.00 | O | X | O | • | X | • | 67.00 | |||||||||||||||||||||||||||||||||||||||||||||||
| 66.00 | O | X | O | • | X | X | • | 66.00 | ||||||||||||||||||||||||||||||||||||||||||||||
| 65.00 | O | X | O | X | O | X | • | 65.00 | ||||||||||||||||||||||||||||||||||||||||||||||
| 64.00 | O | O | X | X | O | X | • | 64.00 | ||||||||||||||||||||||||||||||||||||||||||||||
| 63.00 | O | X | O | X | X | 5 | X | • | 63.00 | |||||||||||||||||||||||||||||||||||||||||||||
| 62.00 | O | X | O | X | X | O | X | O | • | 62.00 | ||||||||||||||||||||||||||||||||||||||||||||
| 61.00 | O | X | O | X | O | X | O | X | • | 61.00 | ||||||||||||||||||||||||||||||||||||||||||||
| 60.00 | O | X | O | X | O | X | O | X | • | 60.00 | ||||||||||||||||||||||||||||||||||||||||||||
| 59.00 | O | X | X | O | X | O | X | O | X | • | 59.00 | |||||||||||||||||||||||||||||||||||||||||||
| 58.00 | O | X | O | X | O | X | O | X | O | X | • | 58.00 | ||||||||||||||||||||||||||||||||||||||||||
| 57.00 | O | X | X | O | X | O | O | O | • | 57.00 | ||||||||||||||||||||||||||||||||||||||||||||
| 56.00 | O | X | O | X | O | X | • | 56.00 | ||||||||||||||||||||||||||||||||||||||||||||||
| 55.00 | O | X | O | X | O | X | X | • | 55.00 | |||||||||||||||||||||||||||||||||||||||||||||
| 54.00 | O | X | O | X | O | X | O | X | • | 54.00 | ||||||||||||||||||||||||||||||||||||||||||||
| 53.00 | O | O | X | O | X | O | X | • | 53.00 | |||||||||||||||||||||||||||||||||||||||||||||
| 52.00 | O | X | O | O | X | • | 52.00 | |||||||||||||||||||||||||||||||||||||||||||||||
| 51.00 | O | X | 4 | X | • | 51.00 | ||||||||||||||||||||||||||||||||||||||||||||||||
| 50.00 | O | X | O | X | • | 50.00 | ||||||||||||||||||||||||||||||||||||||||||||||||
| 49.00 | O | X | O | X | • | 49.00 | ||||||||||||||||||||||||||||||||||||||||||||||||
| 48.00 | O | X | O | X | • | 48.00 | ||||||||||||||||||||||||||||||||||||||||||||||||
| 47.00 | O | X | X | O | X | • | 47.00 | |||||||||||||||||||||||||||||||||||||||||||||||
| 46.00 | O | X | O | X | O | X | • | 46.00 | ||||||||||||||||||||||||||||||||||||||||||||||
| 45.00 | O | X | O | X | O | X | • | 45.00 | ||||||||||||||||||||||||||||||||||||||||||||||
| 44.00 | O | X | O | X | O | X | • | 44.00 | ||||||||||||||||||||||||||||||||||||||||||||||
| 43.00 | O | X | O | X | O | • | 43.00 | |||||||||||||||||||||||||||||||||||||||||||||||
| 42.00 | O | X | O | X | • | 42.00 | ||||||||||||||||||||||||||||||||||||||||||||||||
| 41.00 | O | X | O | X | • | 41.00 | ||||||||||||||||||||||||||||||||||||||||||||||||
| 40.00 | O | X | O | X | • | 40.00 | ||||||||||||||||||||||||||||||||||||||||||||||||
| 39.00 | O | X | O | X | • | 39.00 | ||||||||||||||||||||||||||||||||||||||||||||||||
| 38.00 | O | X | O | X | • | 38.00 | ||||||||||||||||||||||||||||||||||||||||||||||||
| 37.00 | O | X | O | • | 37.00 | |||||||||||||||||||||||||||||||||||||||||||||||||
| 36.00 | O | X | • | 36.00 | ||||||||||||||||||||||||||||||||||||||||||||||||||
| 35.00 | O | X | • | 35.00 | ||||||||||||||||||||||||||||||||||||||||||||||||||
| 34.00 | O | X | • | 34.00 | ||||||||||||||||||||||||||||||||||||||||||||||||||
| 33.00 | O | • | 33.00 |
| ABG Asbury Automotive Group Inc. ($111.64) - Retailing - ABG broke a double top at $110 before moving higher to $112, marking a new rally high. This stock is a strong 5 for 5’er that ranks 9th out of 82 stocks in the favored retailing sector RS matrix. In addition, monthly momentum has been positive for two months and ABG has given a total of five consecutive buy signals since June. From here, initial support sits at $98. |
| AN Autonation Inc. ($57.51) - Autos and Parts - AN moved higher Wednesday to break a double top at $58, which also marks a new multi-year high. This 5 for 5'er moved to a positive trend in May and ranks 5th out of 51 names in the favored autos and parts sector RS matrix. Weekly and monthly momentum are also each positive, suggesting the potential for further upside from here. However, recent price movement has left the stock in overbought territory so those looking to add exposure may be best served to wait for a pullback or normalization of the trading band. Initial support can be found at $51. |
| BLK BlackRock, Inc. ($591.42) - Wall Street - BLK broke a double top at $600, successfully completing a bullish catapult pattern. As a result, BLK is now trading at new all-time highs and has given a total of four consecutive buy signals. BLK is a solid 4 for 5’er within the Wall Street sector that has maintained a peer RS buy signal since April 2013. Overall, demand is in control and the weight of the evidence is positive. From here, initial support sits at $568. Note BLK provides a yield of 2.5%. |
| CVLG Covenant Logistics Group Inc. ($19.50) - Transports/Non Air - CVLG broke a double top at $19.50 before moving higher to $20 and as a result, is now trading at new 52-week highs. This stock is a perfect 5 for 5’er that ranks 4th out of 43 names in the transports/nonair sector. Additionally, CVLG is trading in a positive trend. Demand is in control however CVLG is heavily overbought. From here, initial support sits at $17. |
| KRNT Kornit Digital Ltd ($57.00) - Machinery and Tools - KRNT broke a double top at $58 before moving higher to $59 on Wednesday, marking a new all-time high. This marks the third consecutive buy signal for this 5 for 5’er, confirming that demand is in control. Overall, the technical picture is positive. From here, initial support sits at $54. |
| ODFL Old Dominion Freight Line, Inc. ($192.58) - Transports/Non Air - ODFL broke a double top at $192 before moving higher to $194 on Wednesday. This stock is a perfect 5 for 5’er that has been trading in a positive trend since late April. Today’s breakout marks the sixth consecutive buy signal, confirming that demand is in control. From here, initial support sits at $178. |
| RETA Reata Pharmaceuticals Inc ($104.04) - Biomedics/Genetics - RETA broke a double bottom at $102 on Wednesday, marking the fourth consecutive sell signal on the chart. RETA is an unacceptable 0 for 5’er that ranks 125th out of 128 stocks in the unfavored biomedics/genetics sector. Supply is in control and the weight of the evidence is negative. Avoid. |
| SAH Sonic Automotive Inc. ($46.11) - Retailing - SAH broke a double top at $44 before moving higher to $46, marking a new all-time high and the fourth consecutive buy signal on the chart. This stock is a perfect 5 for 5’er that ranks 3rd out of 82 names in the retailing sector RS matrix. Additionally, SAH has experienced two months of positive monthly momentum and has maintained a long-term market RS buy signal since July 2019. From here, initial support sits at $38. |
| TSLA Tesla Inc. ($1,540.53) - Autos and Parts - TSLA returned to a buy signal on Wednesday with a double top breakout at $1536 before moving higher to $1584. This stock is a 4 for 5’er that ranks in the top quartile of the favored autos and parts sector RS matrix. From here, TSLA faces overhead resistance at $1664 while support sits at $1376. |
| WERN Werner Enterprises Inc ($45.65) - Transports/Non Air - WERN broke a triple top at $46 before moving higher to $47 and is now trading at new all-time highs. This marks the fourth consecutive buy signal on the chart for this 3 for 5’er within the transports/non air sector. Demand is in control. From here, initial support sits at $42 while the bullish support line would be tested with a move to $40. |
| Name | Option Symbol | Action | Stop Loss |
|---|---|---|---|
| NRG Energy, Inc. - $35.26 | NRG2018L34 | Buy the December 34.00 calls at 3.60 | 30.00 |
| Name | Option | Action |
|---|---|---|
| Home Depot, Inc. ( HD) | Sep. 250.00 Calls | Raise the option stop loss to 30.85 (CP: 32.85) |
| Lowe's Companies, Inc. ( LOW) | Sep. 130.00 Calls | Raise the option stop loss to 24.05 (CP: 26.05) |
| Applied Materials, Inc. ( AMAT) | Oct. 55.00 Calls | Raise the option stop loss to 6.30 (CP: 8.30) |
| Fastenal Company ( FAST) | Nov. 40.00 Calls | Raise the option stop loss to 6.70 (CP: 8.70) |
| Best Buy Co., Inc. ( BBY) | Oct. 85.00 Calls | Raise the option stop loss to 18.80 (CP: 20.80) |
| D.R. Horton, Inc. ( DHI) | Nov. 60.00 Calls | Raise the option stop loss to 11.60 (CP: 13.60) |
| Name | Option Symbol | Action | Stop Loss |
|---|---|---|---|
| Flir Systems Inc - $36.55 | FLIR2018X40 | Buy the December 40.00 puts at 6.50 | 44.00 |
| Name | Option | Action |
|---|---|---|
| CME Group, Inc. (CME) | Sep. 170.00 Puts | Stopped at 172.00 (CP: 170.39) |
| Name | Option Sym. | Call to Sell | Call Price | Investment for 500 Shares | Annual Called Rtn. | Annual Static Rtn. | Downside Protection |
|---|---|---|---|---|---|---|---|
| Discover Financial Services $55.76 | DFS2115A60 | Jan. 60.00 | 4.60 | $25,240.45 | 41.59% | 18.58% | 7.36% |
| Name | Action |
|---|---|
| JD.COM INC (JD) - 61.18 | Sell the October 65.00 Calls. |
| Lennar Corporation (LEN) - 73.57 | Sell the November 75.00 Calls. |
| Teradyne, Inc. (TER) - 86.27 | Sell the January 97.50 Calls. |
| eBay Inc. (EBAY) - 54.29 | Sell the January 60.00 Calls. |
| NIKE, Inc. (NKE) - 105.12 | Sell the January 110.00 Calls. |
| Name | Covered Write |
|---|---|
| Astrazeneca Group PLC Ads (United Kingdom) ADR ( AZN - 55.18 ) | January 57.50 covered write. |
| Williams Companies Inc. ( WMB - 21.42 ) | November 22.00 covered write. |
Daily Equity & Market Analysis
Loading, Please Wait...
