
Today, we will highlight some of the notable developments across the universe of major market ETFs covered in this report. Additionally, we will provide updated near-term support levels for all ten major market funds.
Portfolio View - Major Market ETFs
| Symbol | Name | Price | Yield | PnF Trend | RS Signal | RS Col. | Fund Score | 200 Day MA | Weekly Mom |
|---|---|---|---|---|---|---|---|---|---|
| DIA | SPDR Dow Jones Industrial Average ETF Trust | 277.19 | 2.15 | Positive | O | 4.12 | 262.59 | +3W | |
| EEM | iShares MSCI Emerging Markets ETF | 43.86 | 2.04 | Positive | Sell | O | 4.99 | 40.80 | -1W |
| EFA | iShares MSCI EAFE ETF | 64.07 | 2.55 | Positive | Sell | O | 1.56 | 62.79 | -6W |
| FM | iShares MSCI Frontier 100 ETF | 24.13 | 3.29 | Negative | Sell | O | 0.39 | 26.00 | -6W |
| IJH | iShares S&P MidCap 400 Index Fund | 194.24 | 1.66 | Positive | Buy | O | 2.99 | 182.85 | +3W |
| IJR | iShares S&P SmallCap 600 Index Fund | 75.70 | 1.56 | Positive | Buy | O | 2.90 | 71.99 | +3W |
| QQQ | Invesco QQQ Trust | 265.19 | 0.62 | Positive | Buy | X | 5.72 | 221.23 | -1W |
| RSP | Invesco S&P 500 Equal Weight ETF | 110.55 | 1.94 | Positive | Buy | X | 4.28 | 104.57 | +3W |
| SPY | SPDR S&P 500 ETF Trust | 332.80 | 1.72 | Positive | O | 4.24 | 305.54 | +4W | |
| XLG | Invesco S&P 500 Top 50 ETF | 256.73 | 1.42 | Positive | O | 5.51 | 228.60 | -1W |
Additional Comments:
Over the last week of market action, two major market ETFs finished in the red while eight finished in positive territory. The best performing fund for the week was the iShares S&P SmallCap 600 Index Fund IJR with a gain of 4.50% while the Invesco QQQ Trust QQQ was the worst performing with a loss of -1.92%. Year-to-date, there are now three funds in positive territory for the year: QQQ (+24.73%) the Invesco S&P 500 Top 50 ETF XLG (+10%), and the SPDR S&P 500 ETF Trust SPY (+3.40%). Today, we will highlight some of the notable developments across the universe of major market ETFs covered in this report. Additionally, we will provide updated near-term support levels for all ten major market funds.
Spread Triple Top Buy Signal for EFA
With today’s market action, the chart of the iShares MSCI EAFE ETF EFA broke a spread triple top at $65, moving above resistance dating back to March of this year. Today’s breakout marks the third consecutive buy signal on the chart, confirming that demand is in control. Also, monthly momentum just flipped positive after having spent the prior six months on the negative side. Currently, EFA has a less than ideal fund score of 1.56 as it is showing weakness versus both the market and its peers. Be sure to set a fund score alert so that you will be emailed if EFA is able to move above the 3.00 threshold, making the fund more actionable. From here, initial support sits at $60 while the next level of resistance sits at $70, EFA’s January high.

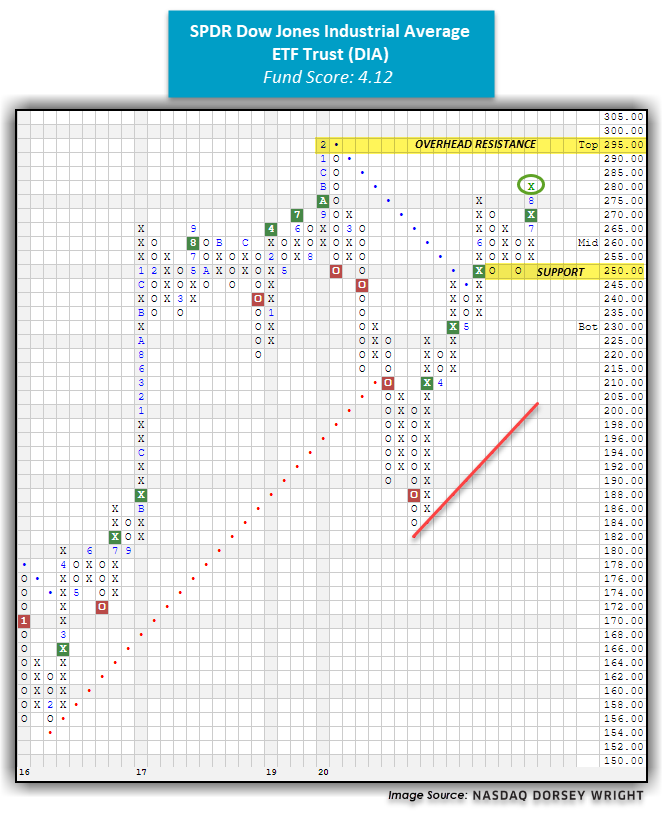
DIA Moves Higher
With yesterday’s market action, the SPDR Dow Jones Industrial Average ETF Trust DIA printed an X at $280, breaking through resistance dating back to June and now sits about 5% away from its all-time high from February at $295. In March, DIA fell as low as $184 when it gave four consecutive sell signals and moved into a negative trend. The fund has steadily recovered and has now given four consecutive buy signals. DIA has a solid fund score of 4.12 with a positive score direction of 1.64. Monthly momentum has been positive for two months, suggesting the potential for higher prices. From current levels, initial support sits at $250 while the bullish support line would be tested with a move to $200. Note DIA provides investors with a yield of 2.16%.
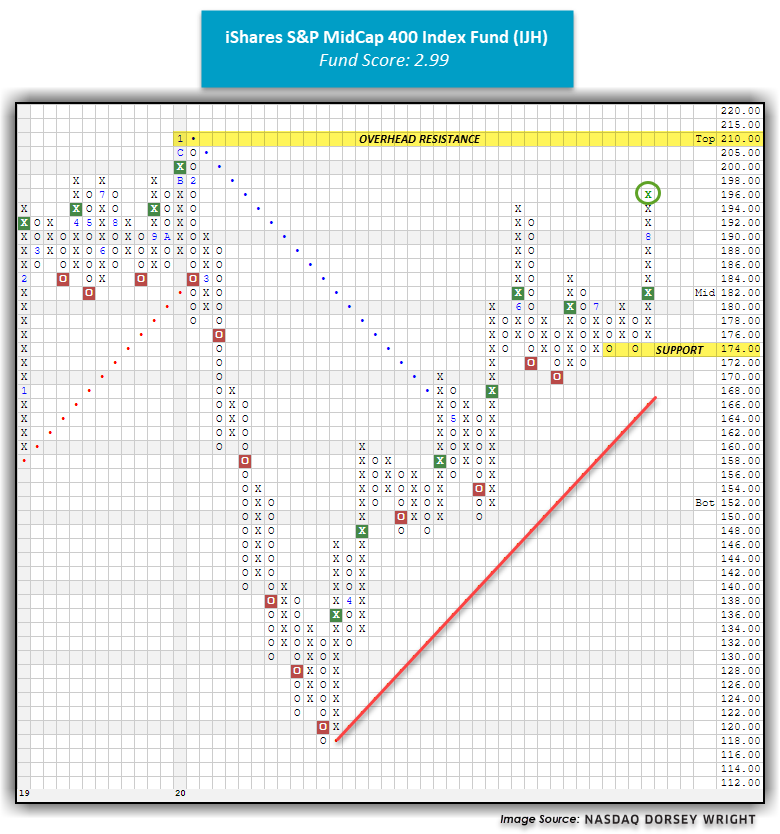
IJH Breaks Through Resistance
Yesterday, the iShares S&P MidCap 400 Index Fund IJH printed an X at $196, breaking through overhead resistance established in June. As a result, IJH has one final level of resistance to move through before it is back at all-time highs, which would come with a move to $215 or higher. IJH has given two consecutive buy signals since June, confirming that demand is in control. Monthly momentum has been positive for two months while weekly momentum has been positive for three weeks. Additionally, IJH has a fund score of 2.99 with a positive score direction of 2.56, speaking to the fund’s improvement over the trailing six months. The technical picture for IJH is strengthening, making new long positions welcome at current levels if looking for mid-cap exposure. As mentioned above, the last level of resistance lies at $210, IJH’s all-time high from January of this year, while initial support sits at $174.
Updated Support Levels

