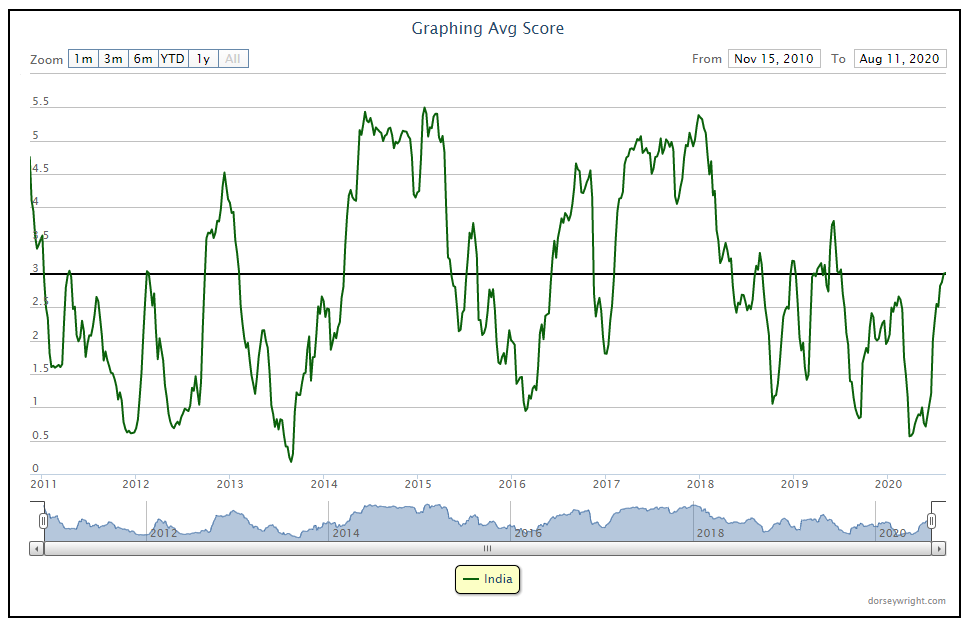
India is showing its highest group score in over a year.
International equities have continued to gain strength over the past week, as has been exemplified through some of the relative comparisons on the NDW research platform. One such example can be found in the broad asset class comparison of the Dynamic Asset Level Investing (DALI) tool, which stacks each of the six broad asset classes against one another in order to determine which area possesses the most relative strength. This ranking saw domestic equities overtake cash following market action on August 5th, during which the domestic equities asset class picked up 5 relative strength buy signals. Interestingly enough, we saw international equities also gain 5 buy signals on the same day, followed by an additional signal gained in the subsequent trading day. While international equities still sits in last place, it has moved substantially off its COVID-19 induced tally count low of 65 signals to its current tally of 123.
One way to view movement underneath the hood of the foreign equity space is through the Asset Class Group Scores (ACGS) page, which looks at a more in-depth breakdown of strength among various country and regional representatives, all sorted by the average score of the ETFs and mutual funds included in each classification. Out of 135 groups examined on this page, there are currently 102 groups with average scores above the 3.00 score threshold, which is often used as the line of demarcation for acceptable areas of the market. With over three-fourths of the tracked groups being in the top end of the 0 to 6 score range, we see most international equity groups in this territory, with the exception of the country/regional groups outside of Asia. This is not for lack of trying, as we can see through the score direction rank of the non-US view that only frontier markets and Middle East Africa Equity have seen a negative directional move.
One area that just moved above the 3 score line is India, with its recent score of 3.01 marking its highest level in over a year. Earlier this year, this group fell to its second-lowest fund score dating back to November of 2010, at a reading of only 0.53 on March 24th. Since that time, the score has moved largely higher to its current position. This improvement is also depicted through the 2.48 average direction of the India group, which is the fifth-highest directional reading of any group on the ACGS system.

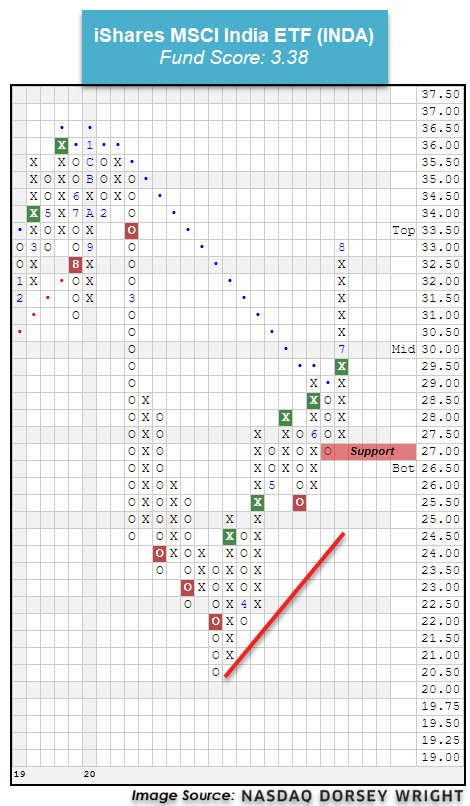
The near-term strength of India is also shown through the iShares MSCI India ETF INDA, which fell to a multi-year low of $20.50 in March before climbing higher over the past few months. INDA moved back to a positive trend and gave a second consecutive buy signal in late-June at $29.50 having continued higher since that time to its current default chart position of $33. The 3.38 fund score bests the average non-Us equity fund of 3.30 as well as the aforementioned average India fund (3.01) and is paired with a strongly positive 3.23 score direction. Monthly momentum recently flipped positive, suggesting the potential for further upside from here. While the technical picture continues to improve, the recent price movement has left the fund in overbought territory, so those looking to add exposure would be best served to wait for a pullback or normalization of the trading band. Initial support can be found on the default chart at $27, while the more sensitive, ¼ point chart shows the potential for additional support at $31.75, $30.25, and $29.

